Pricing

Infographic templates for presentations

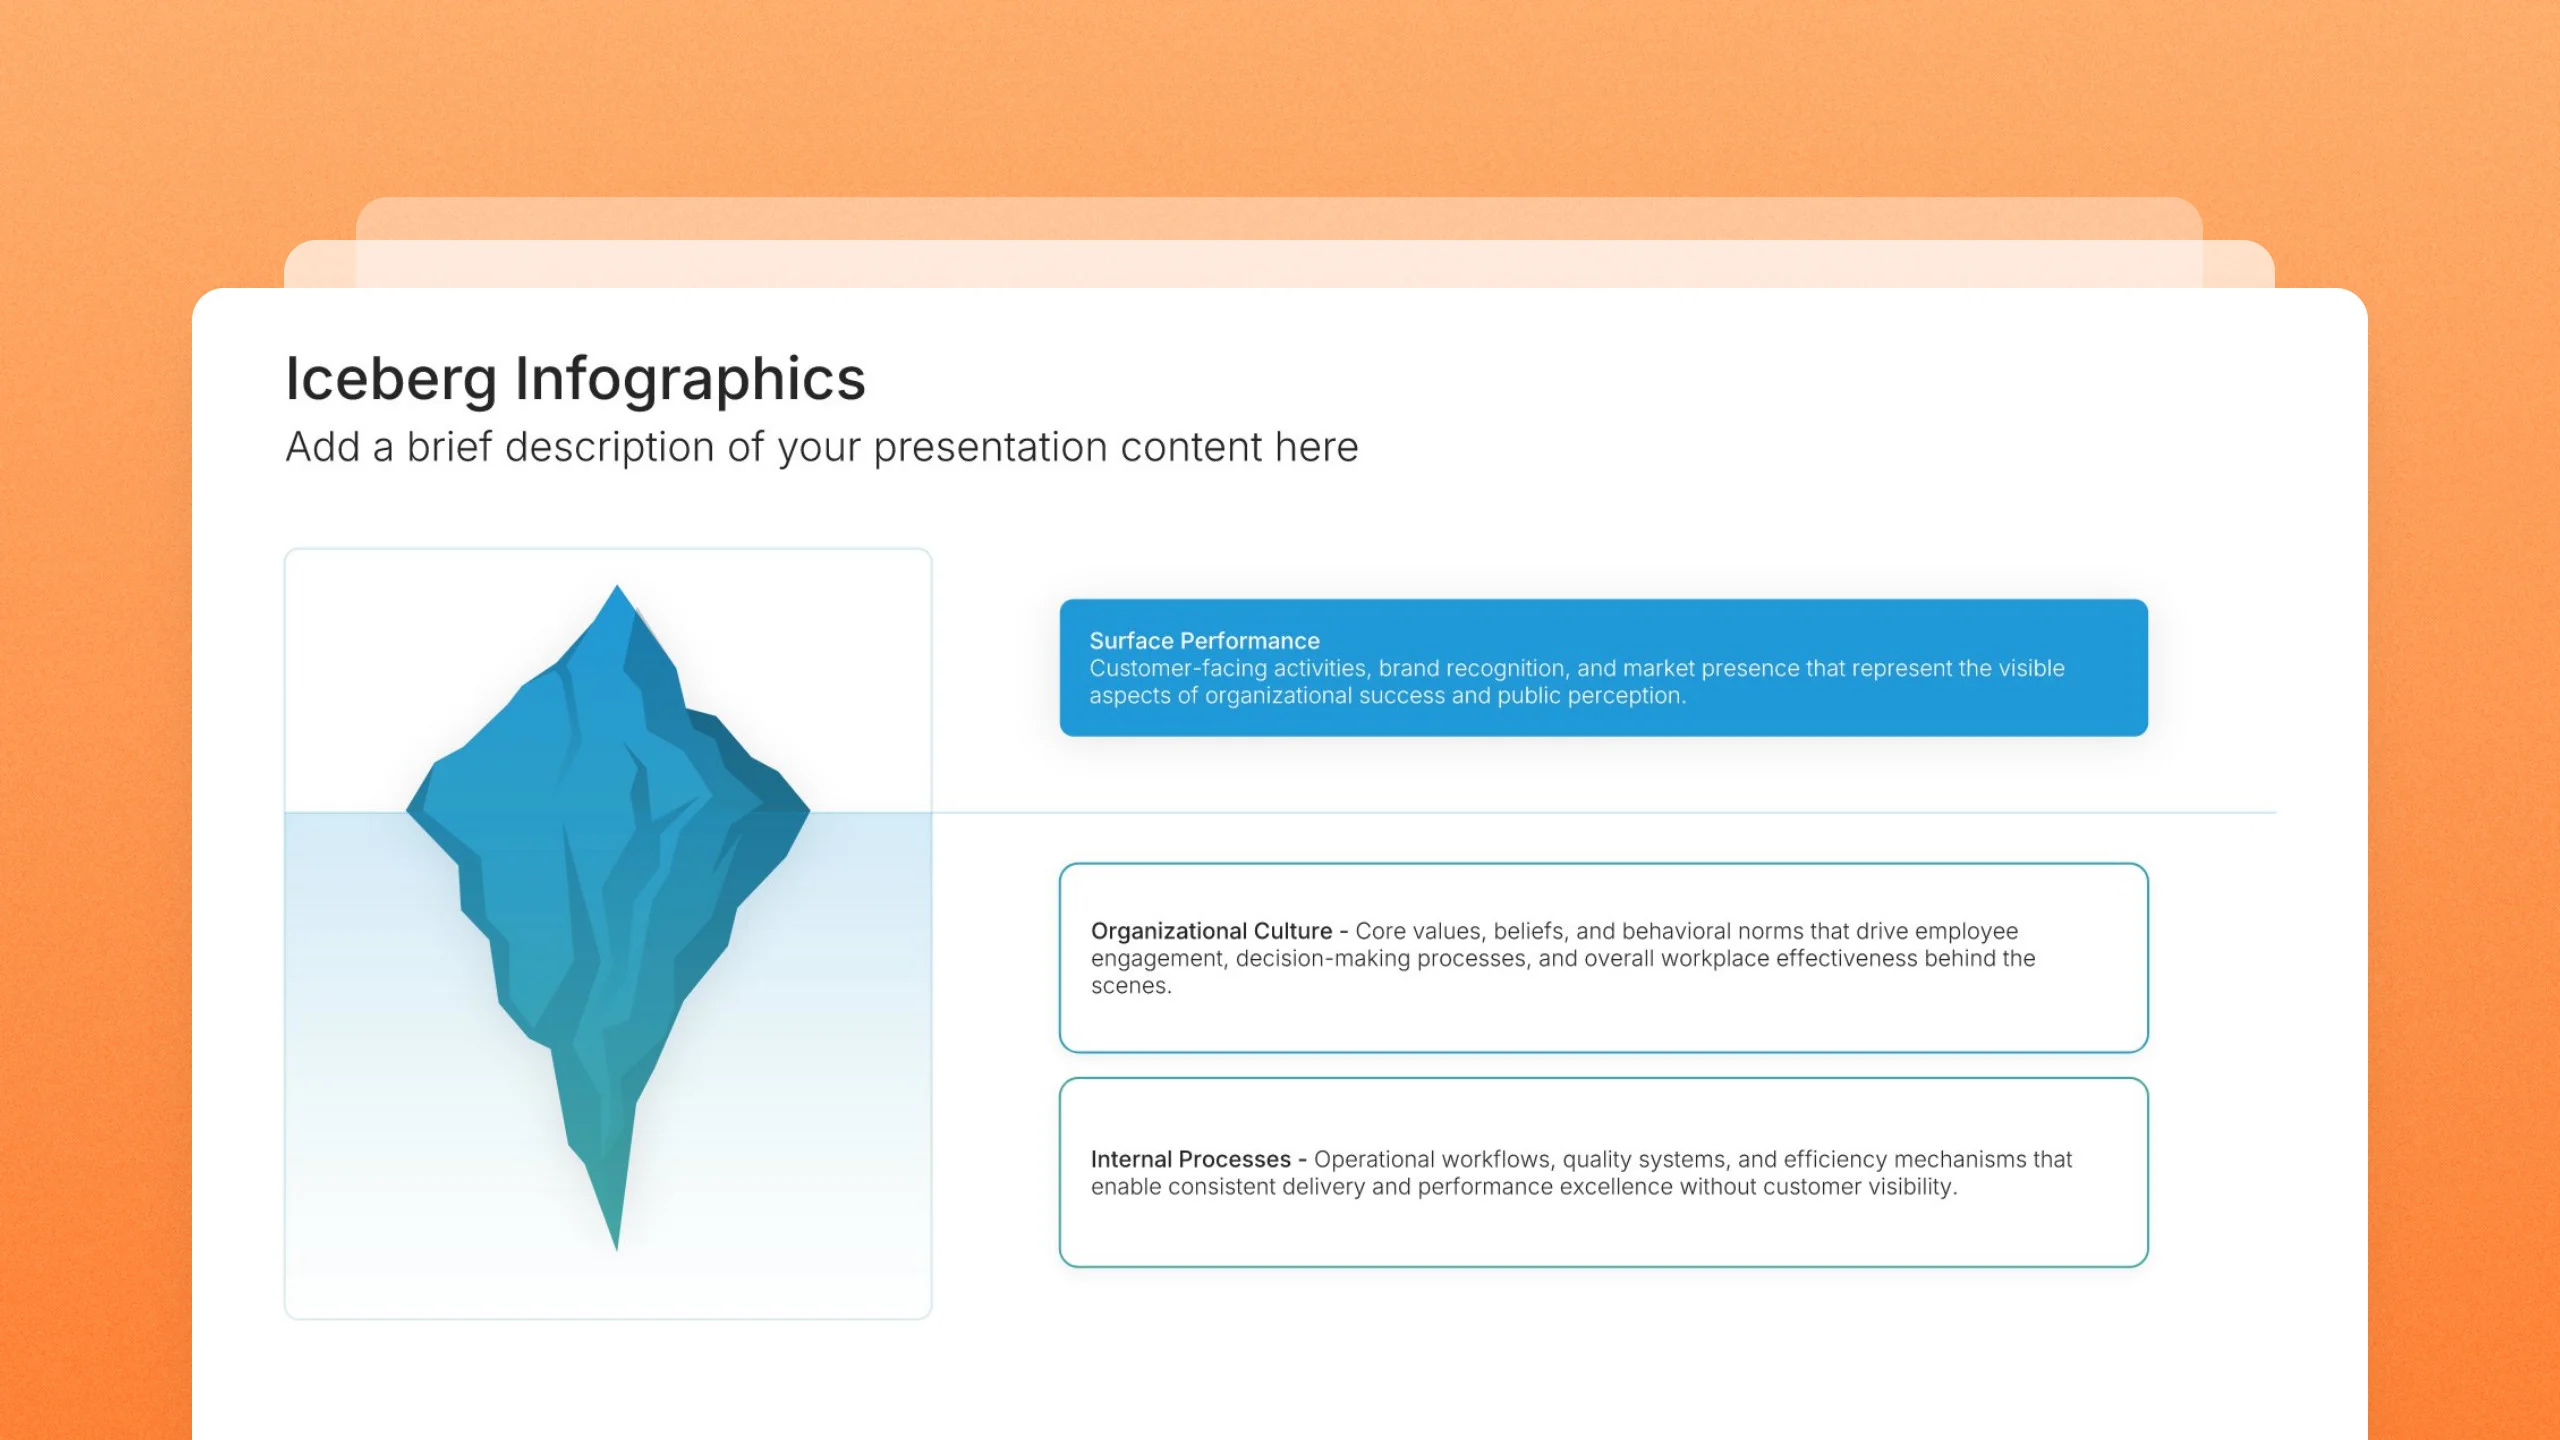
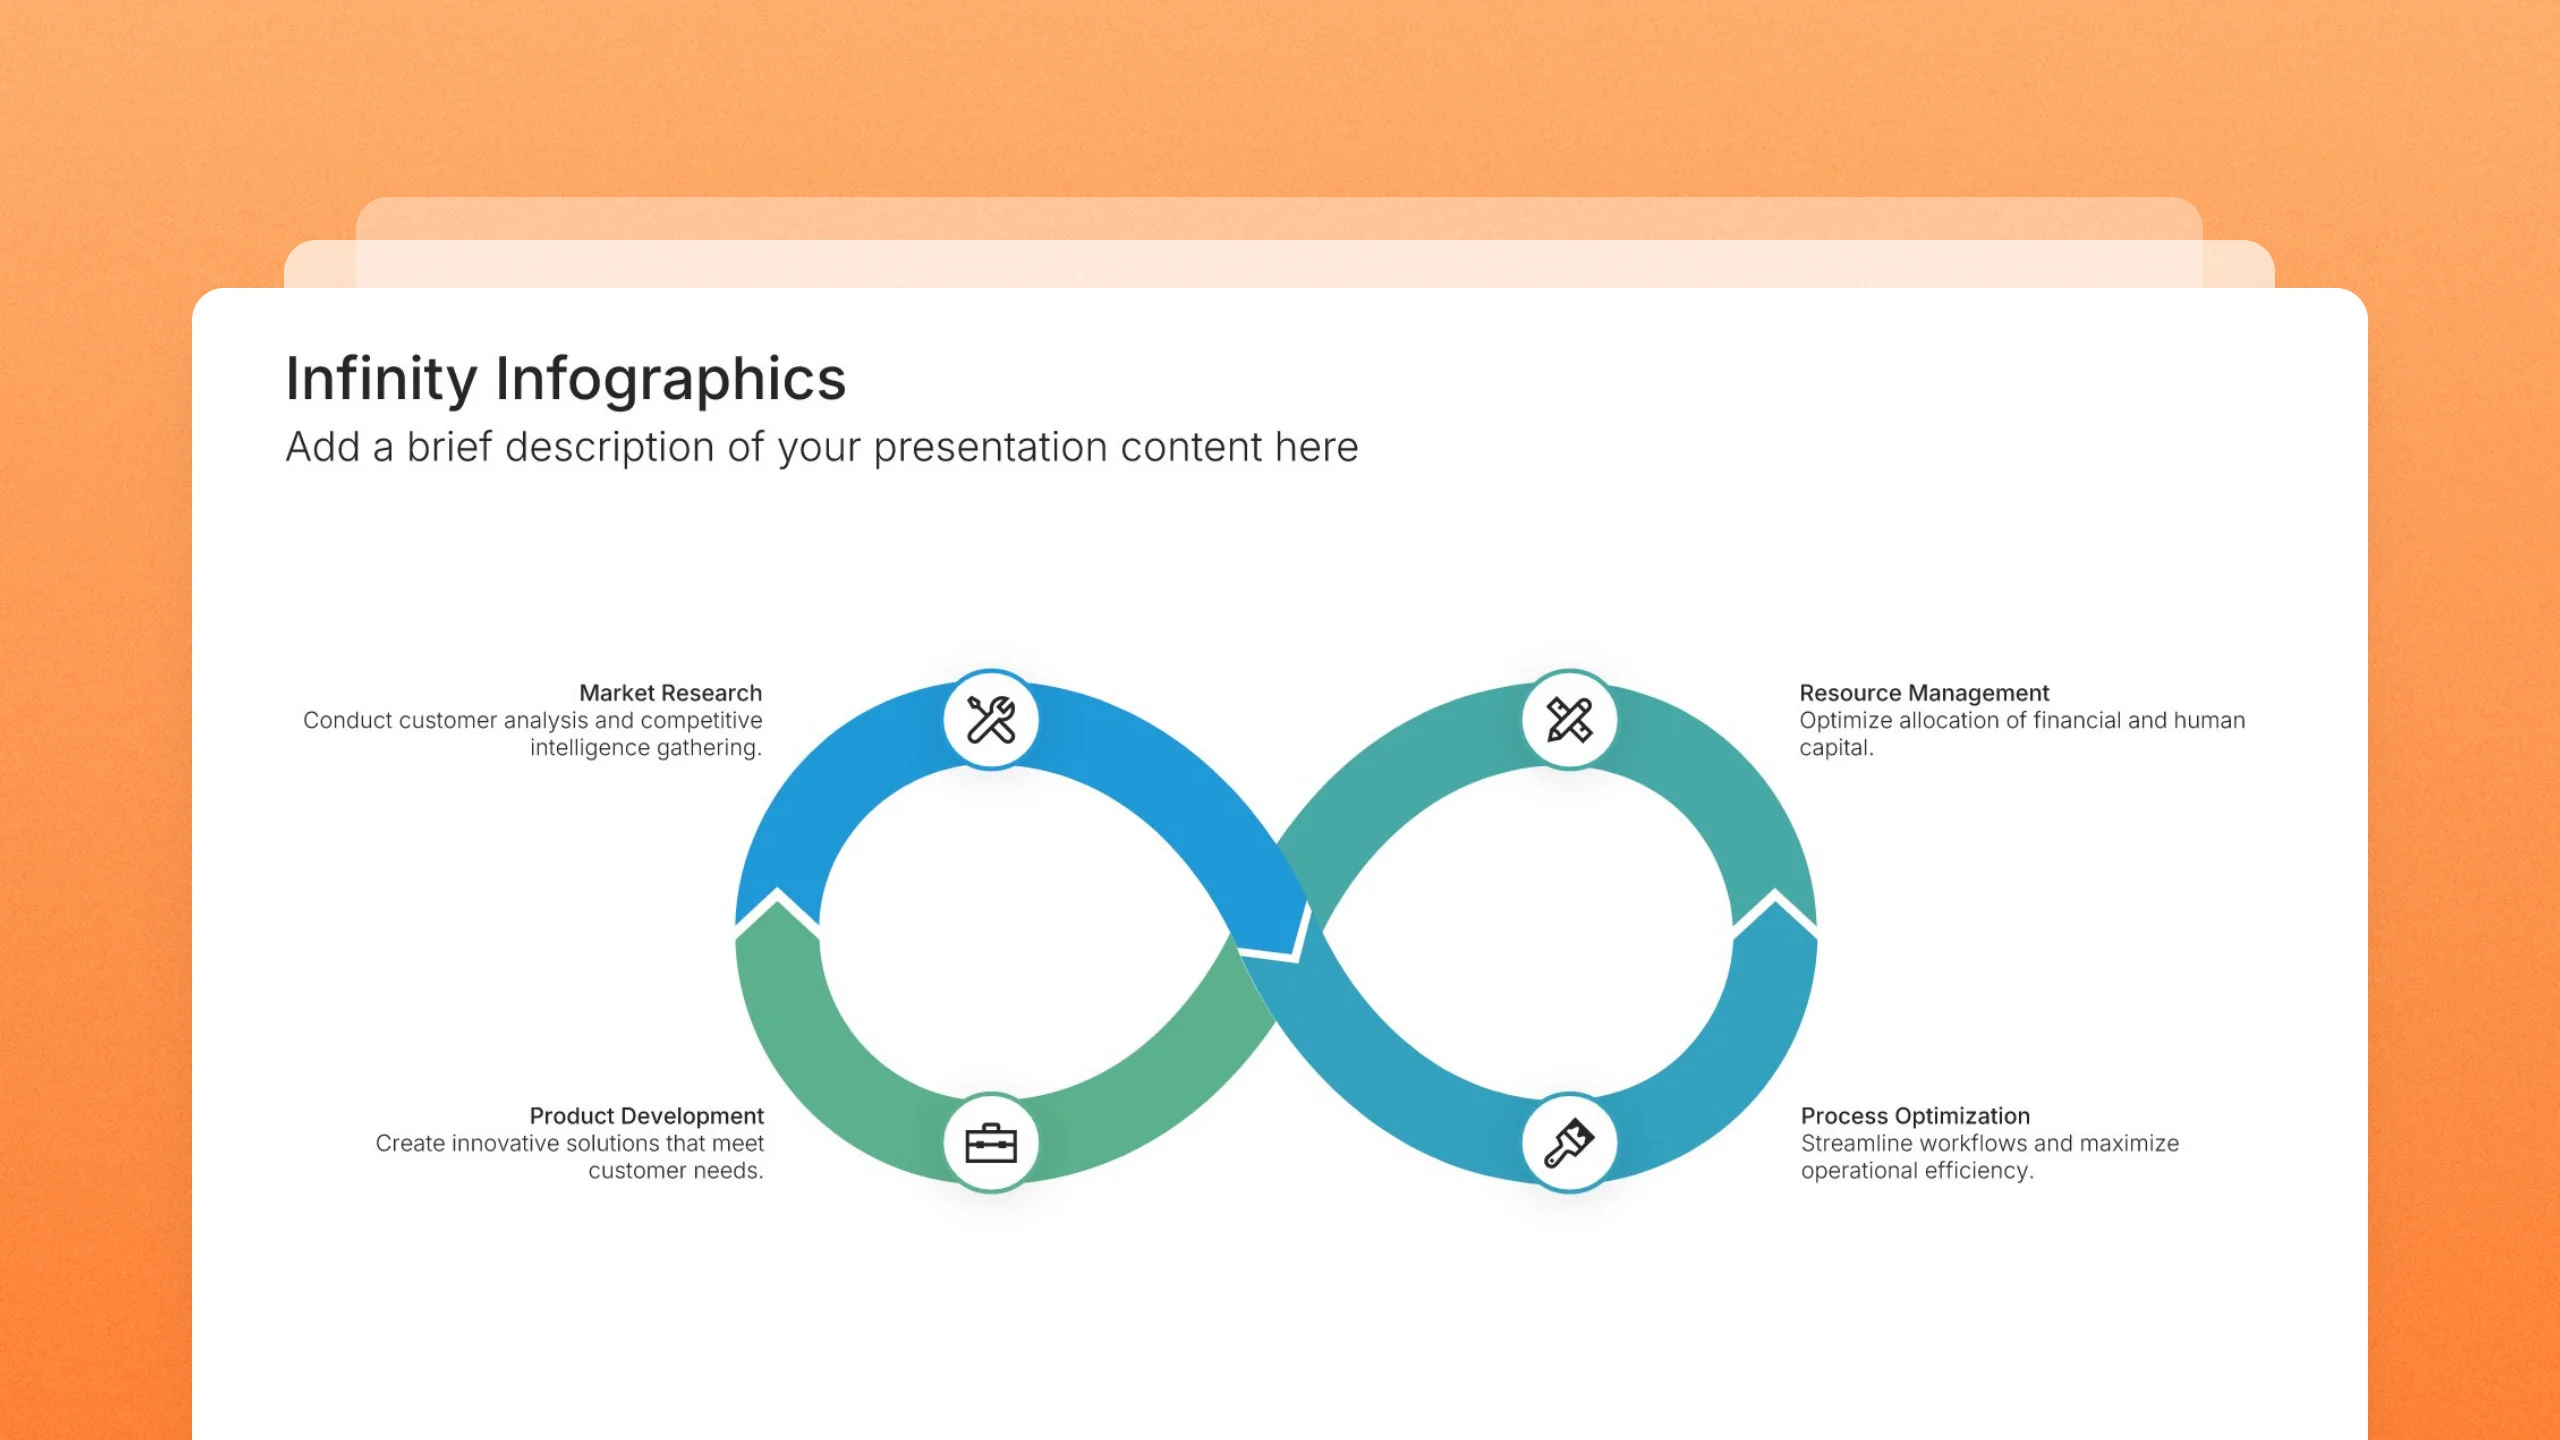
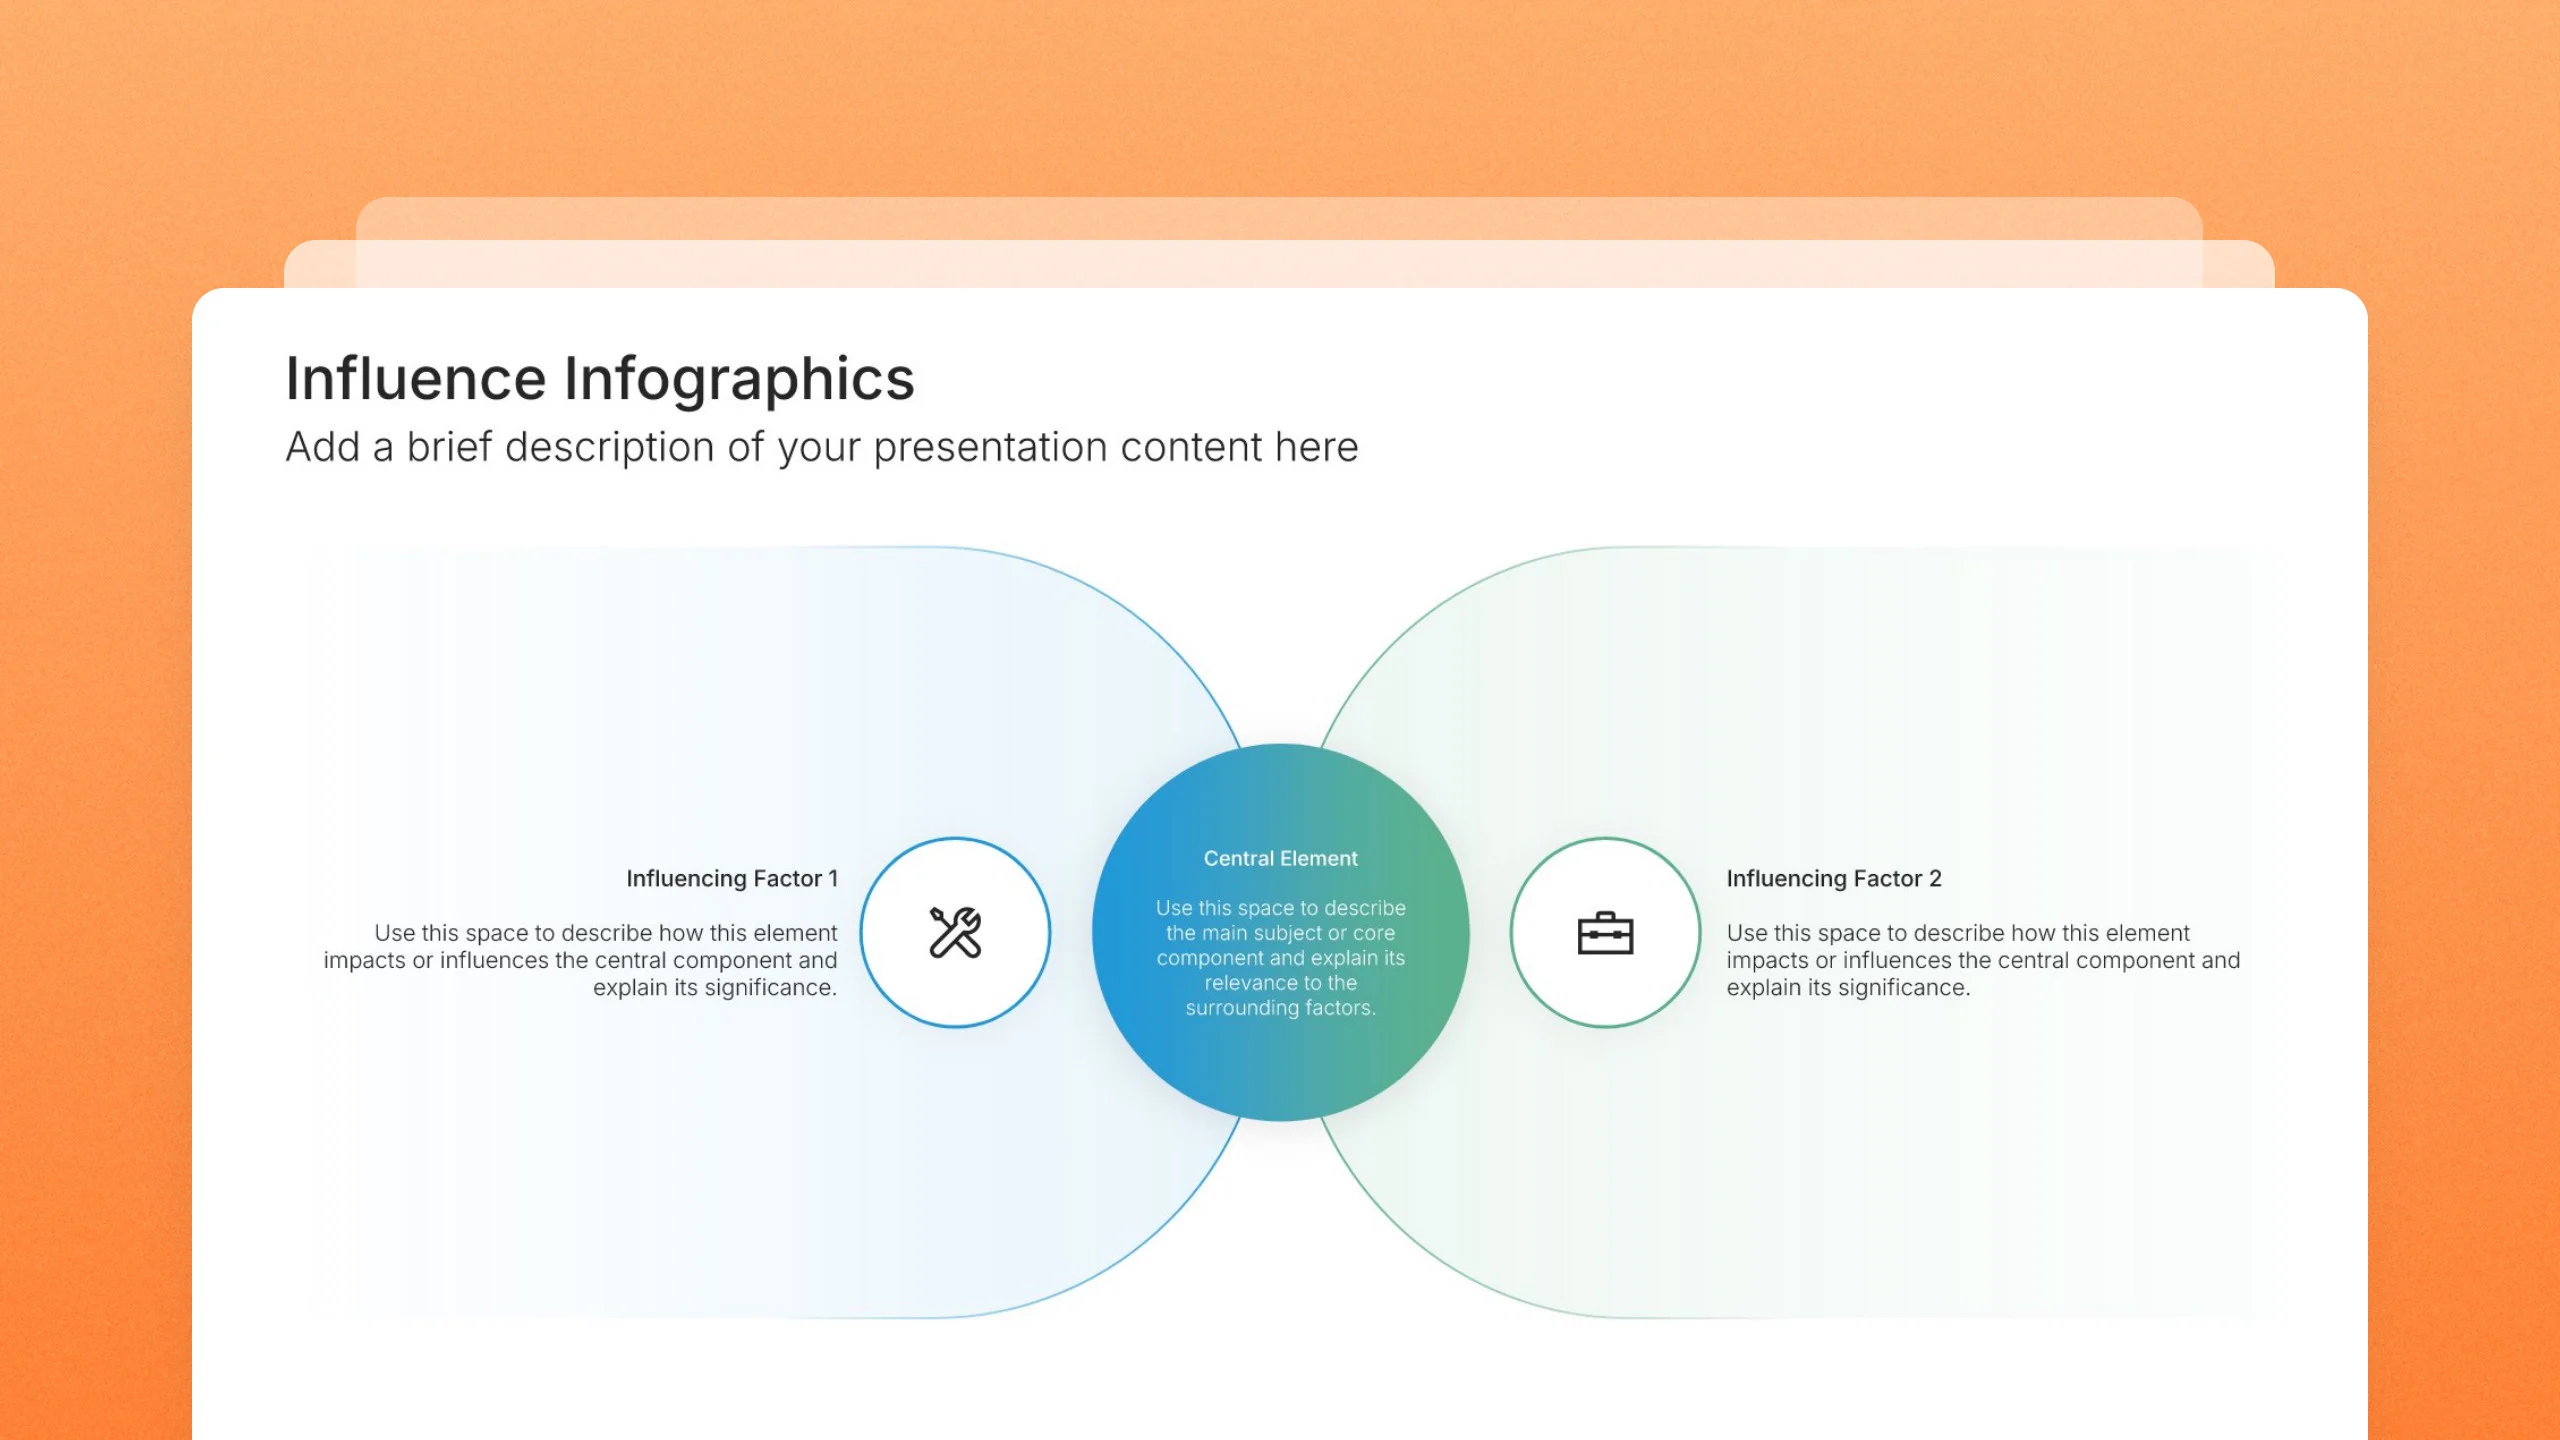
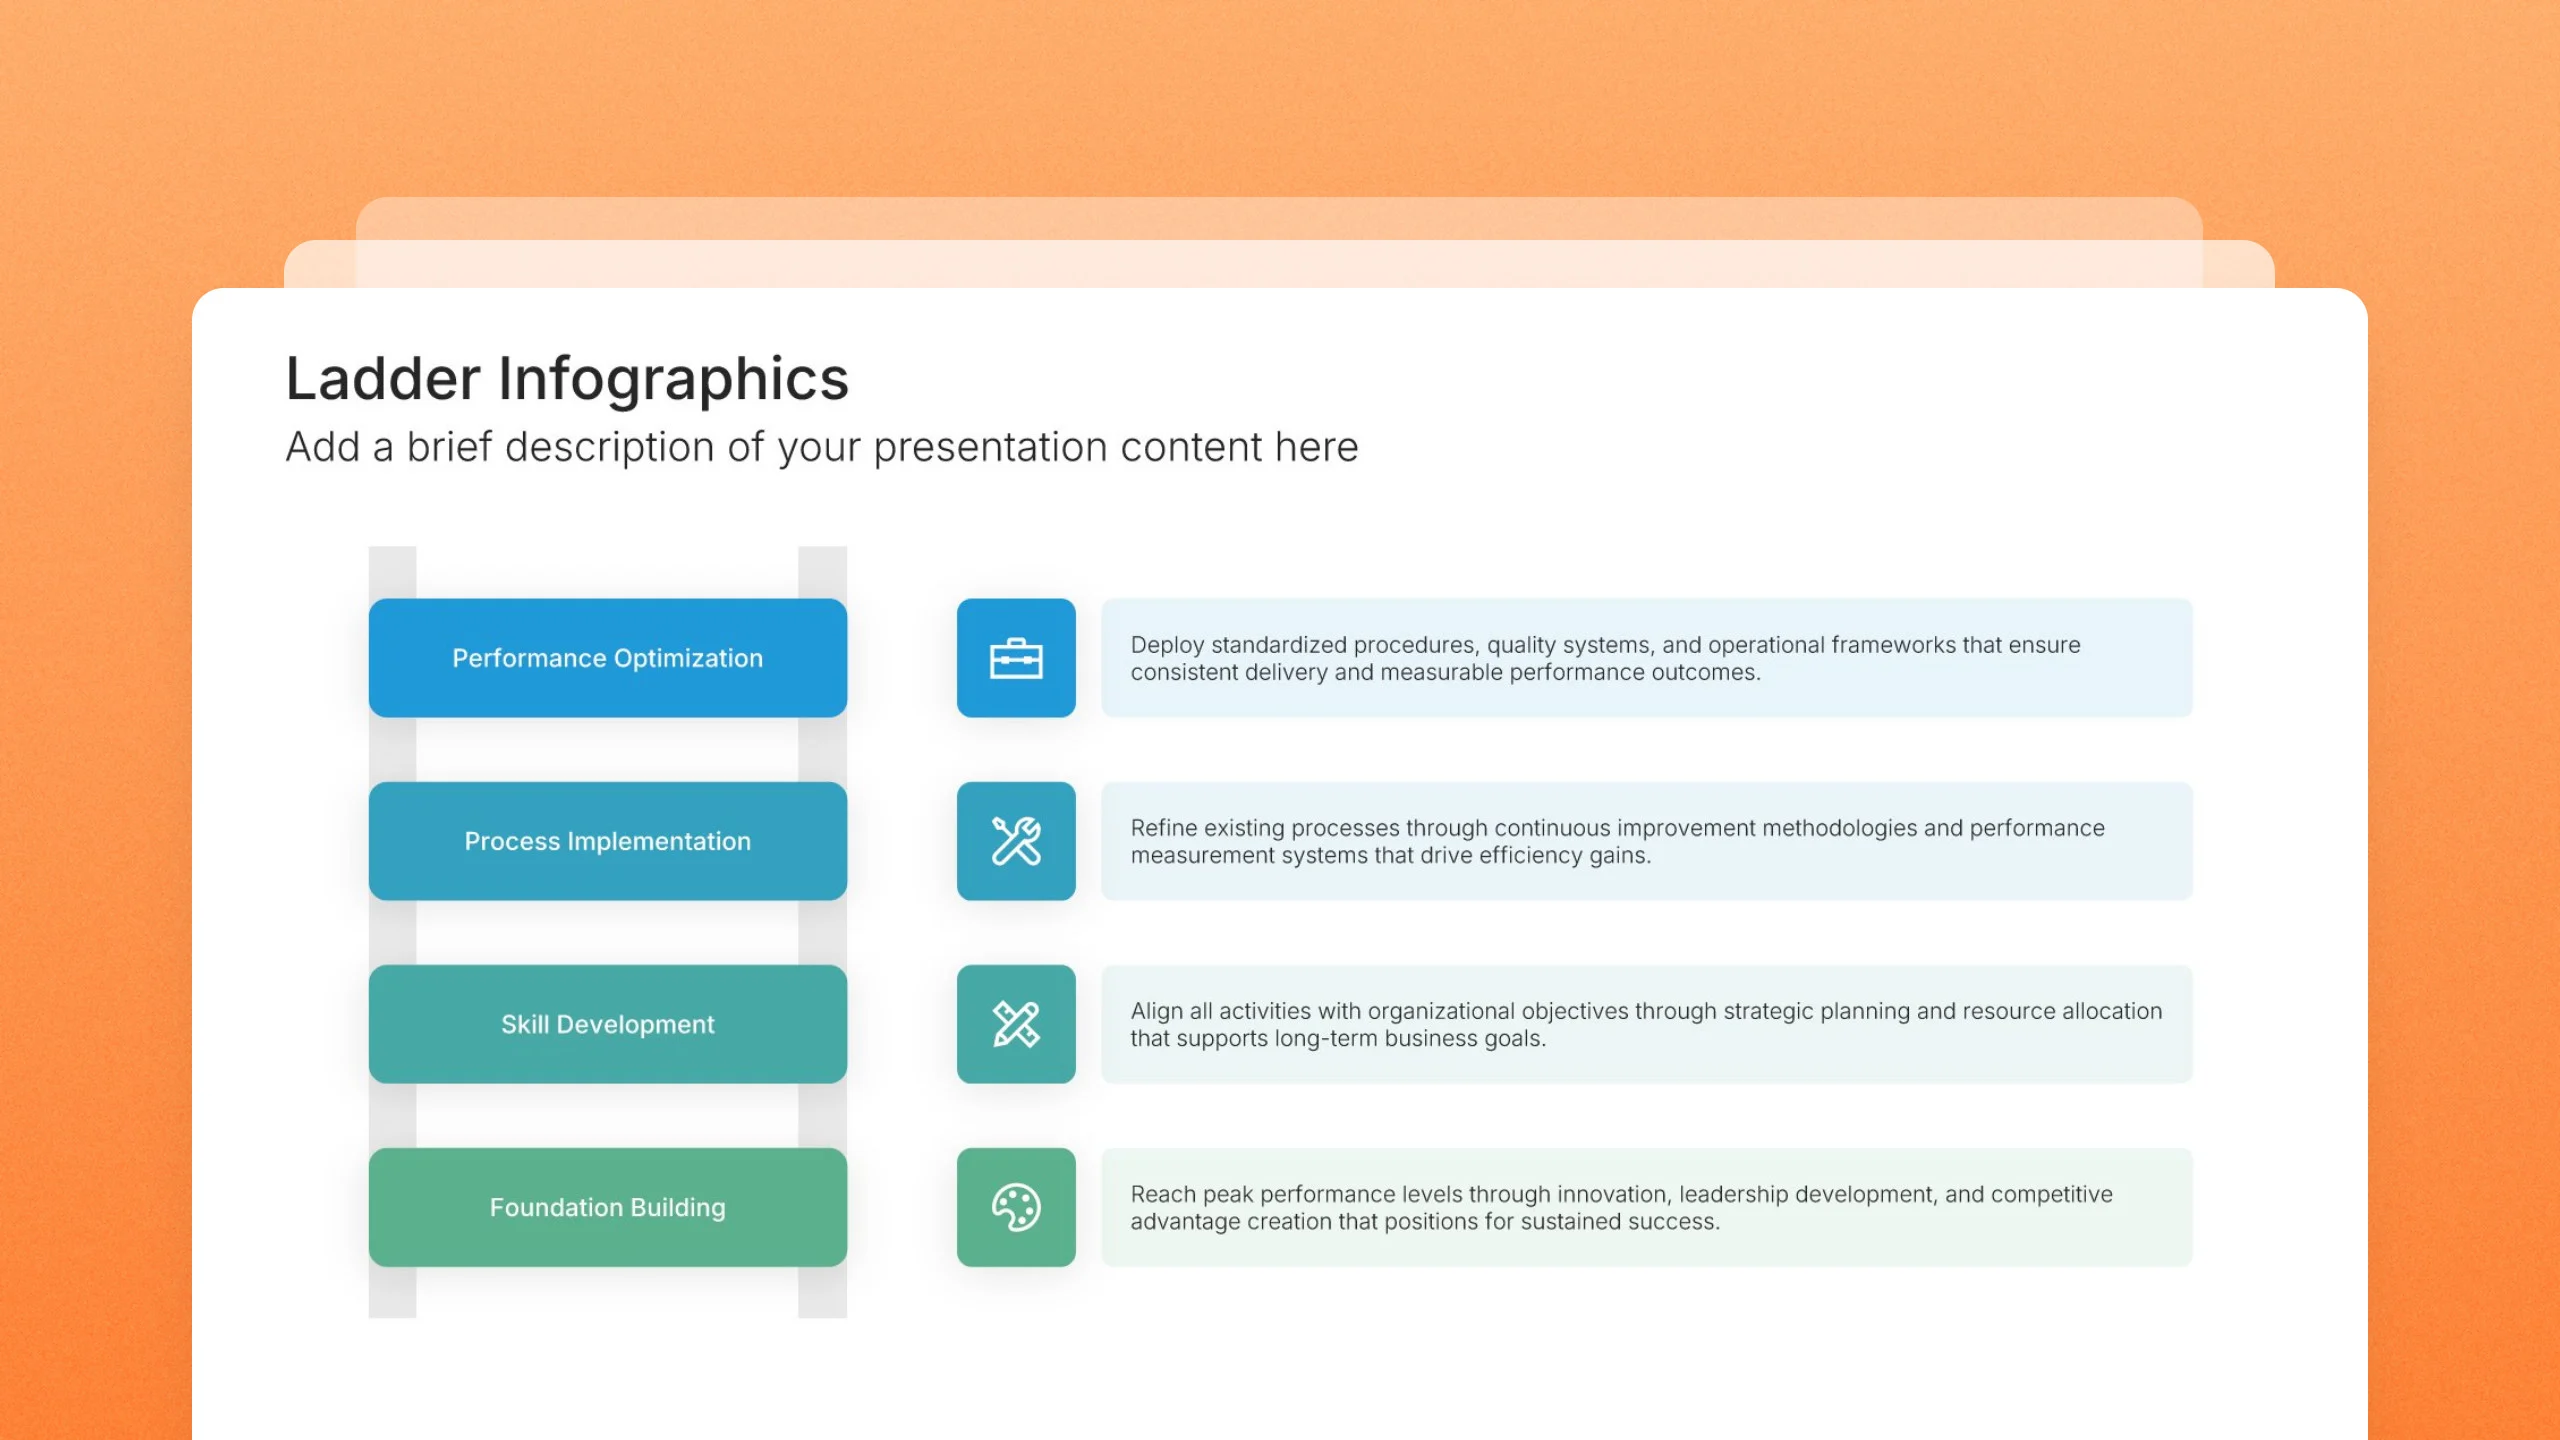
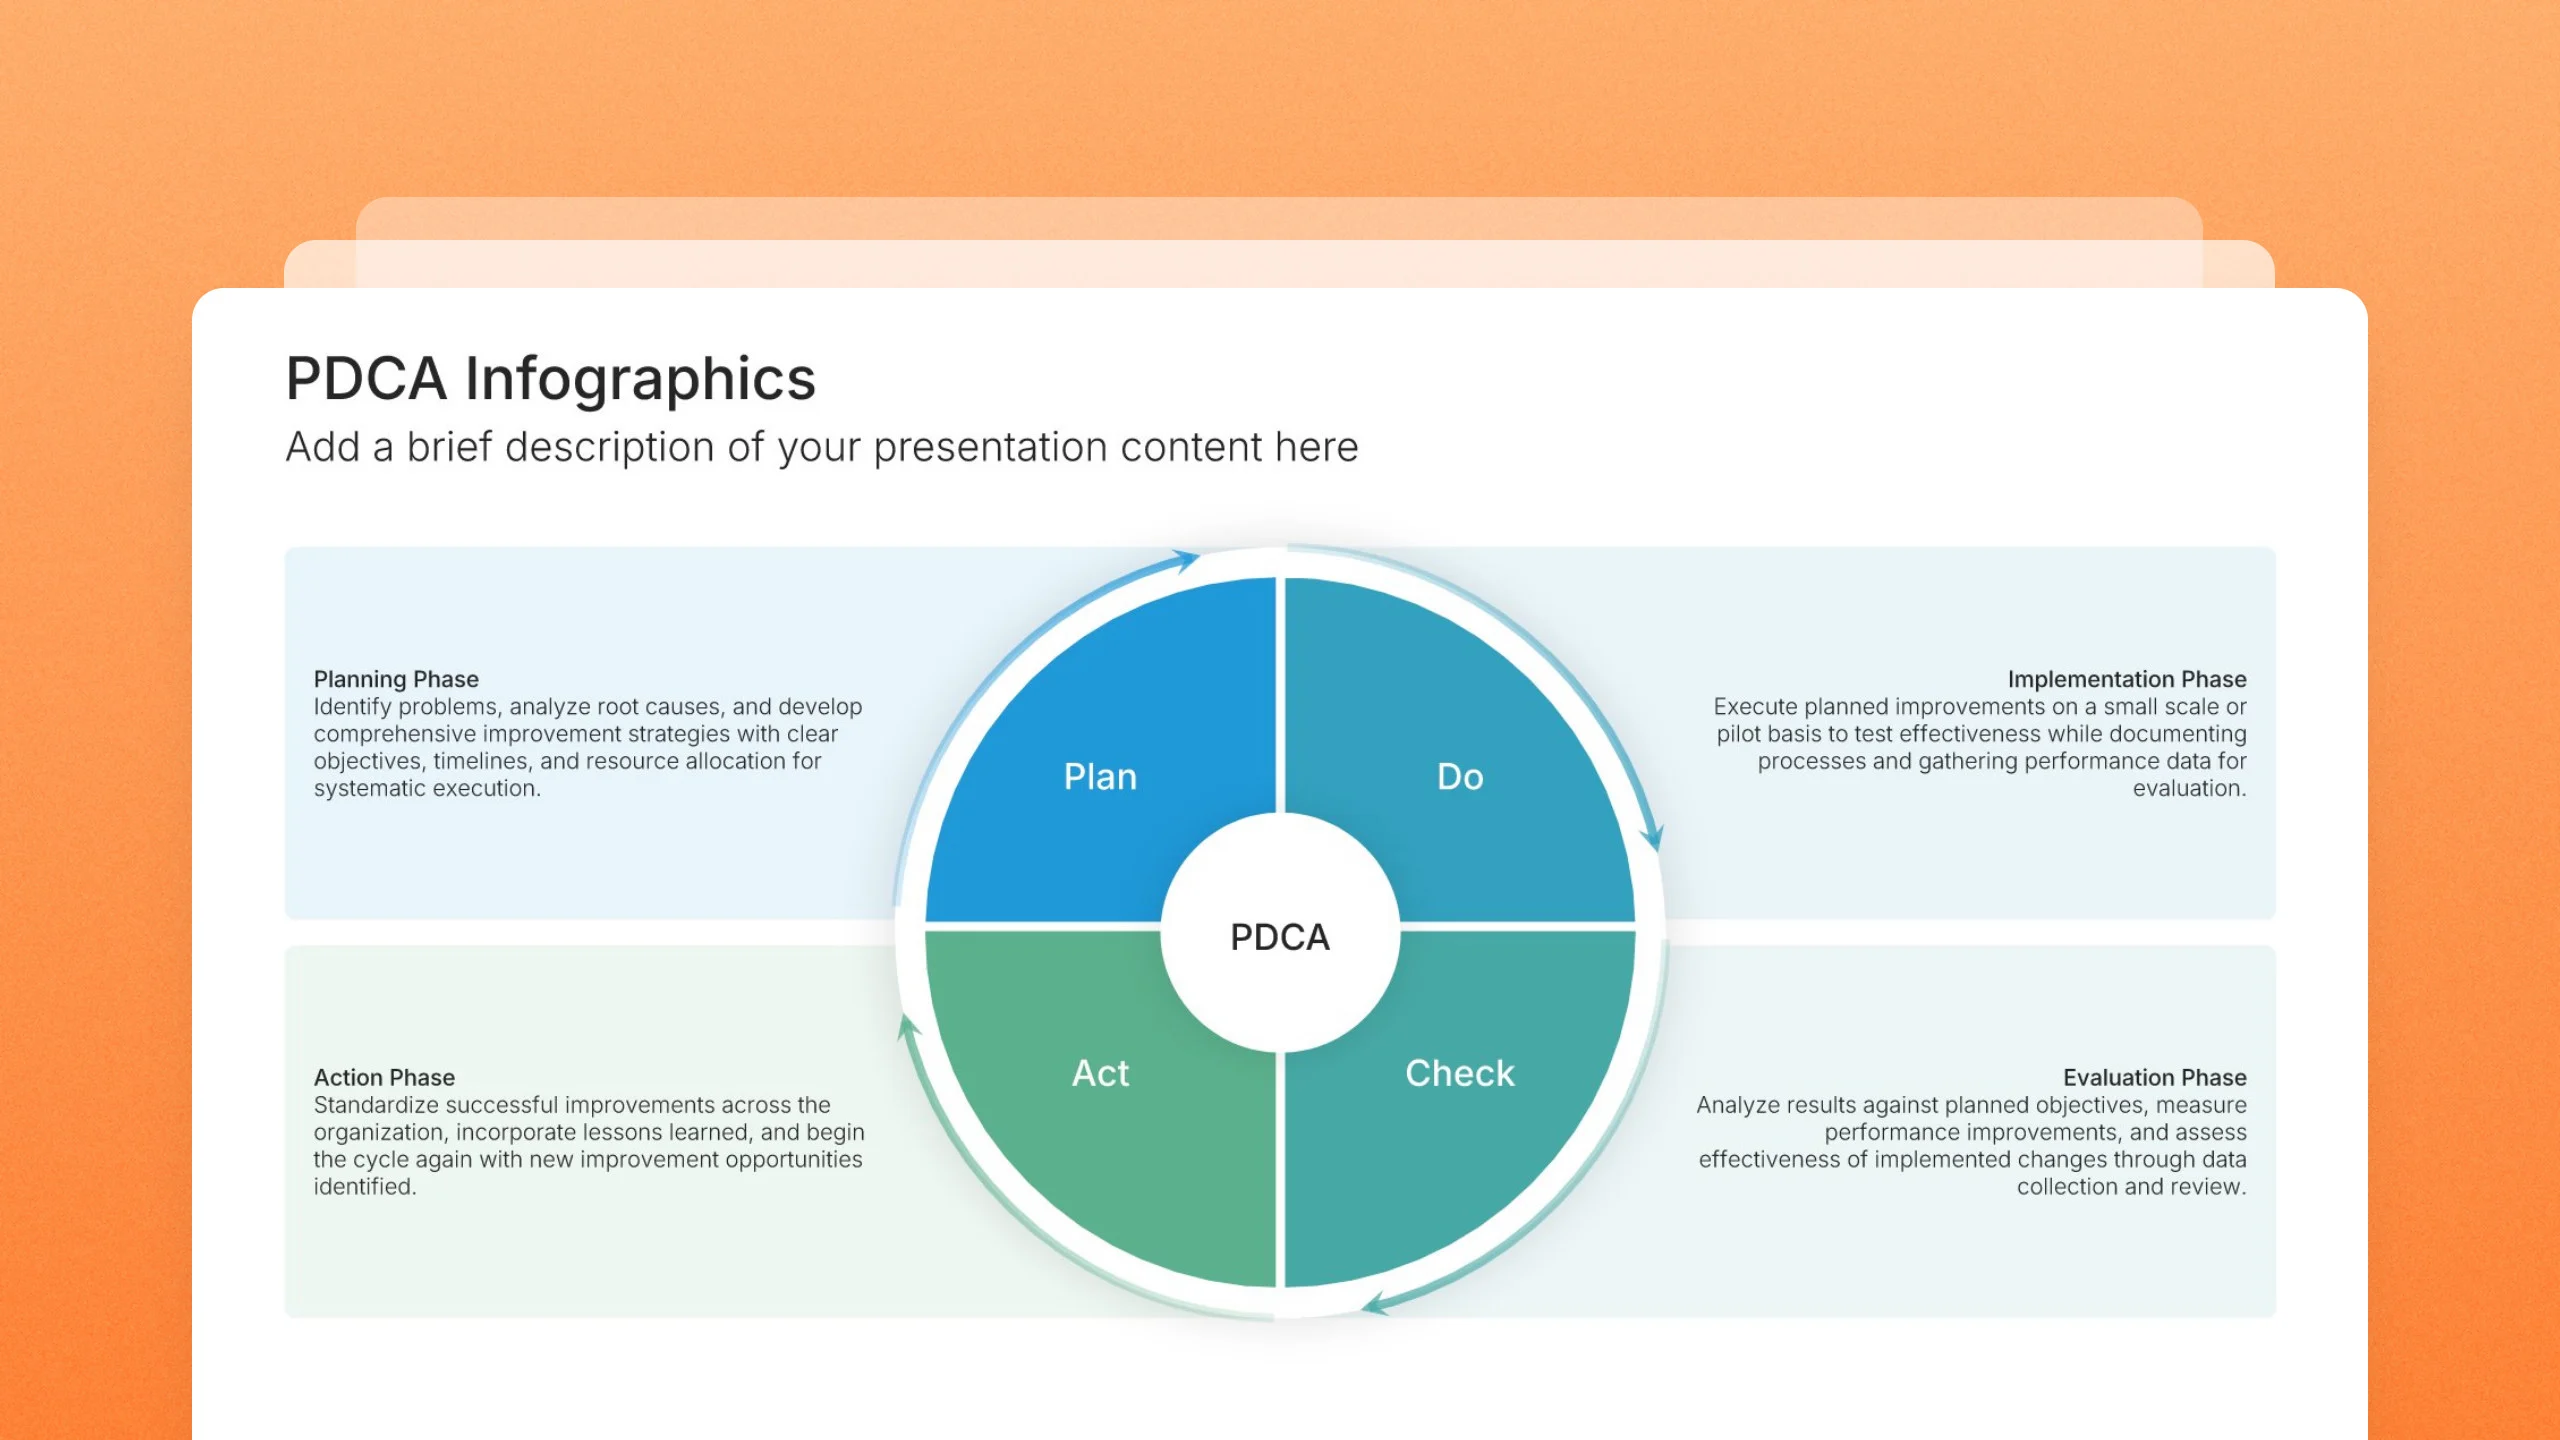
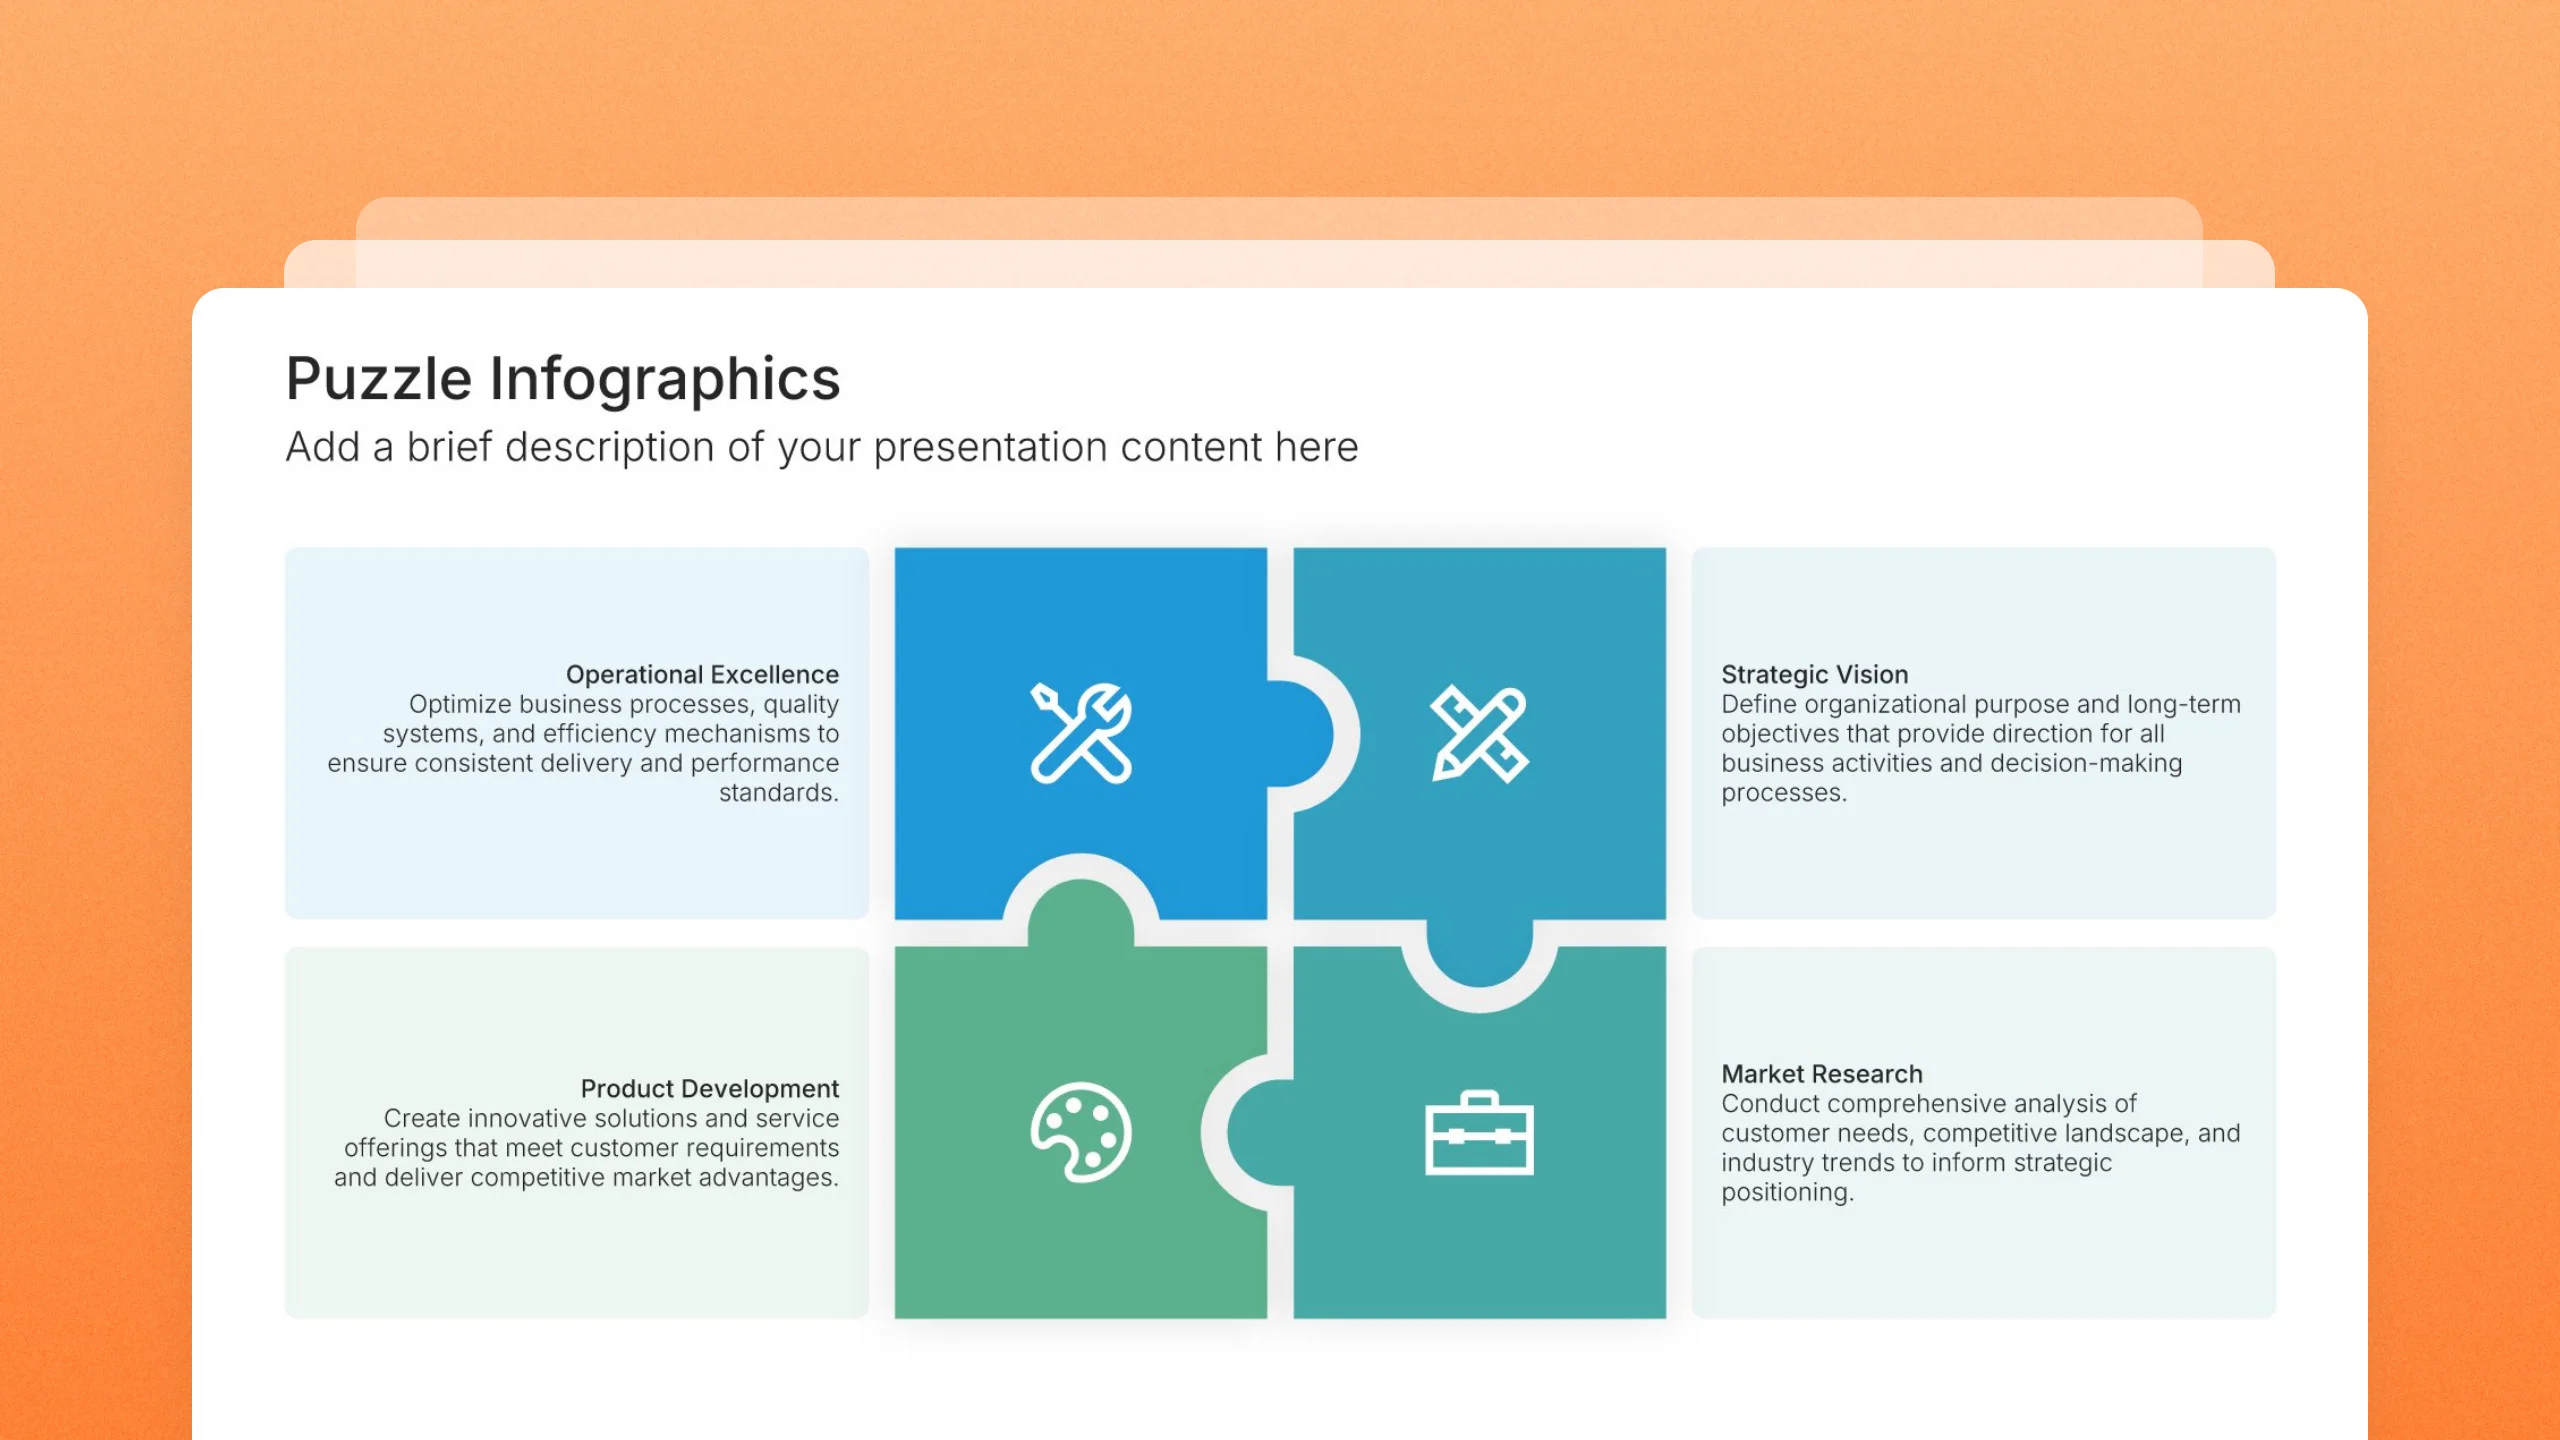
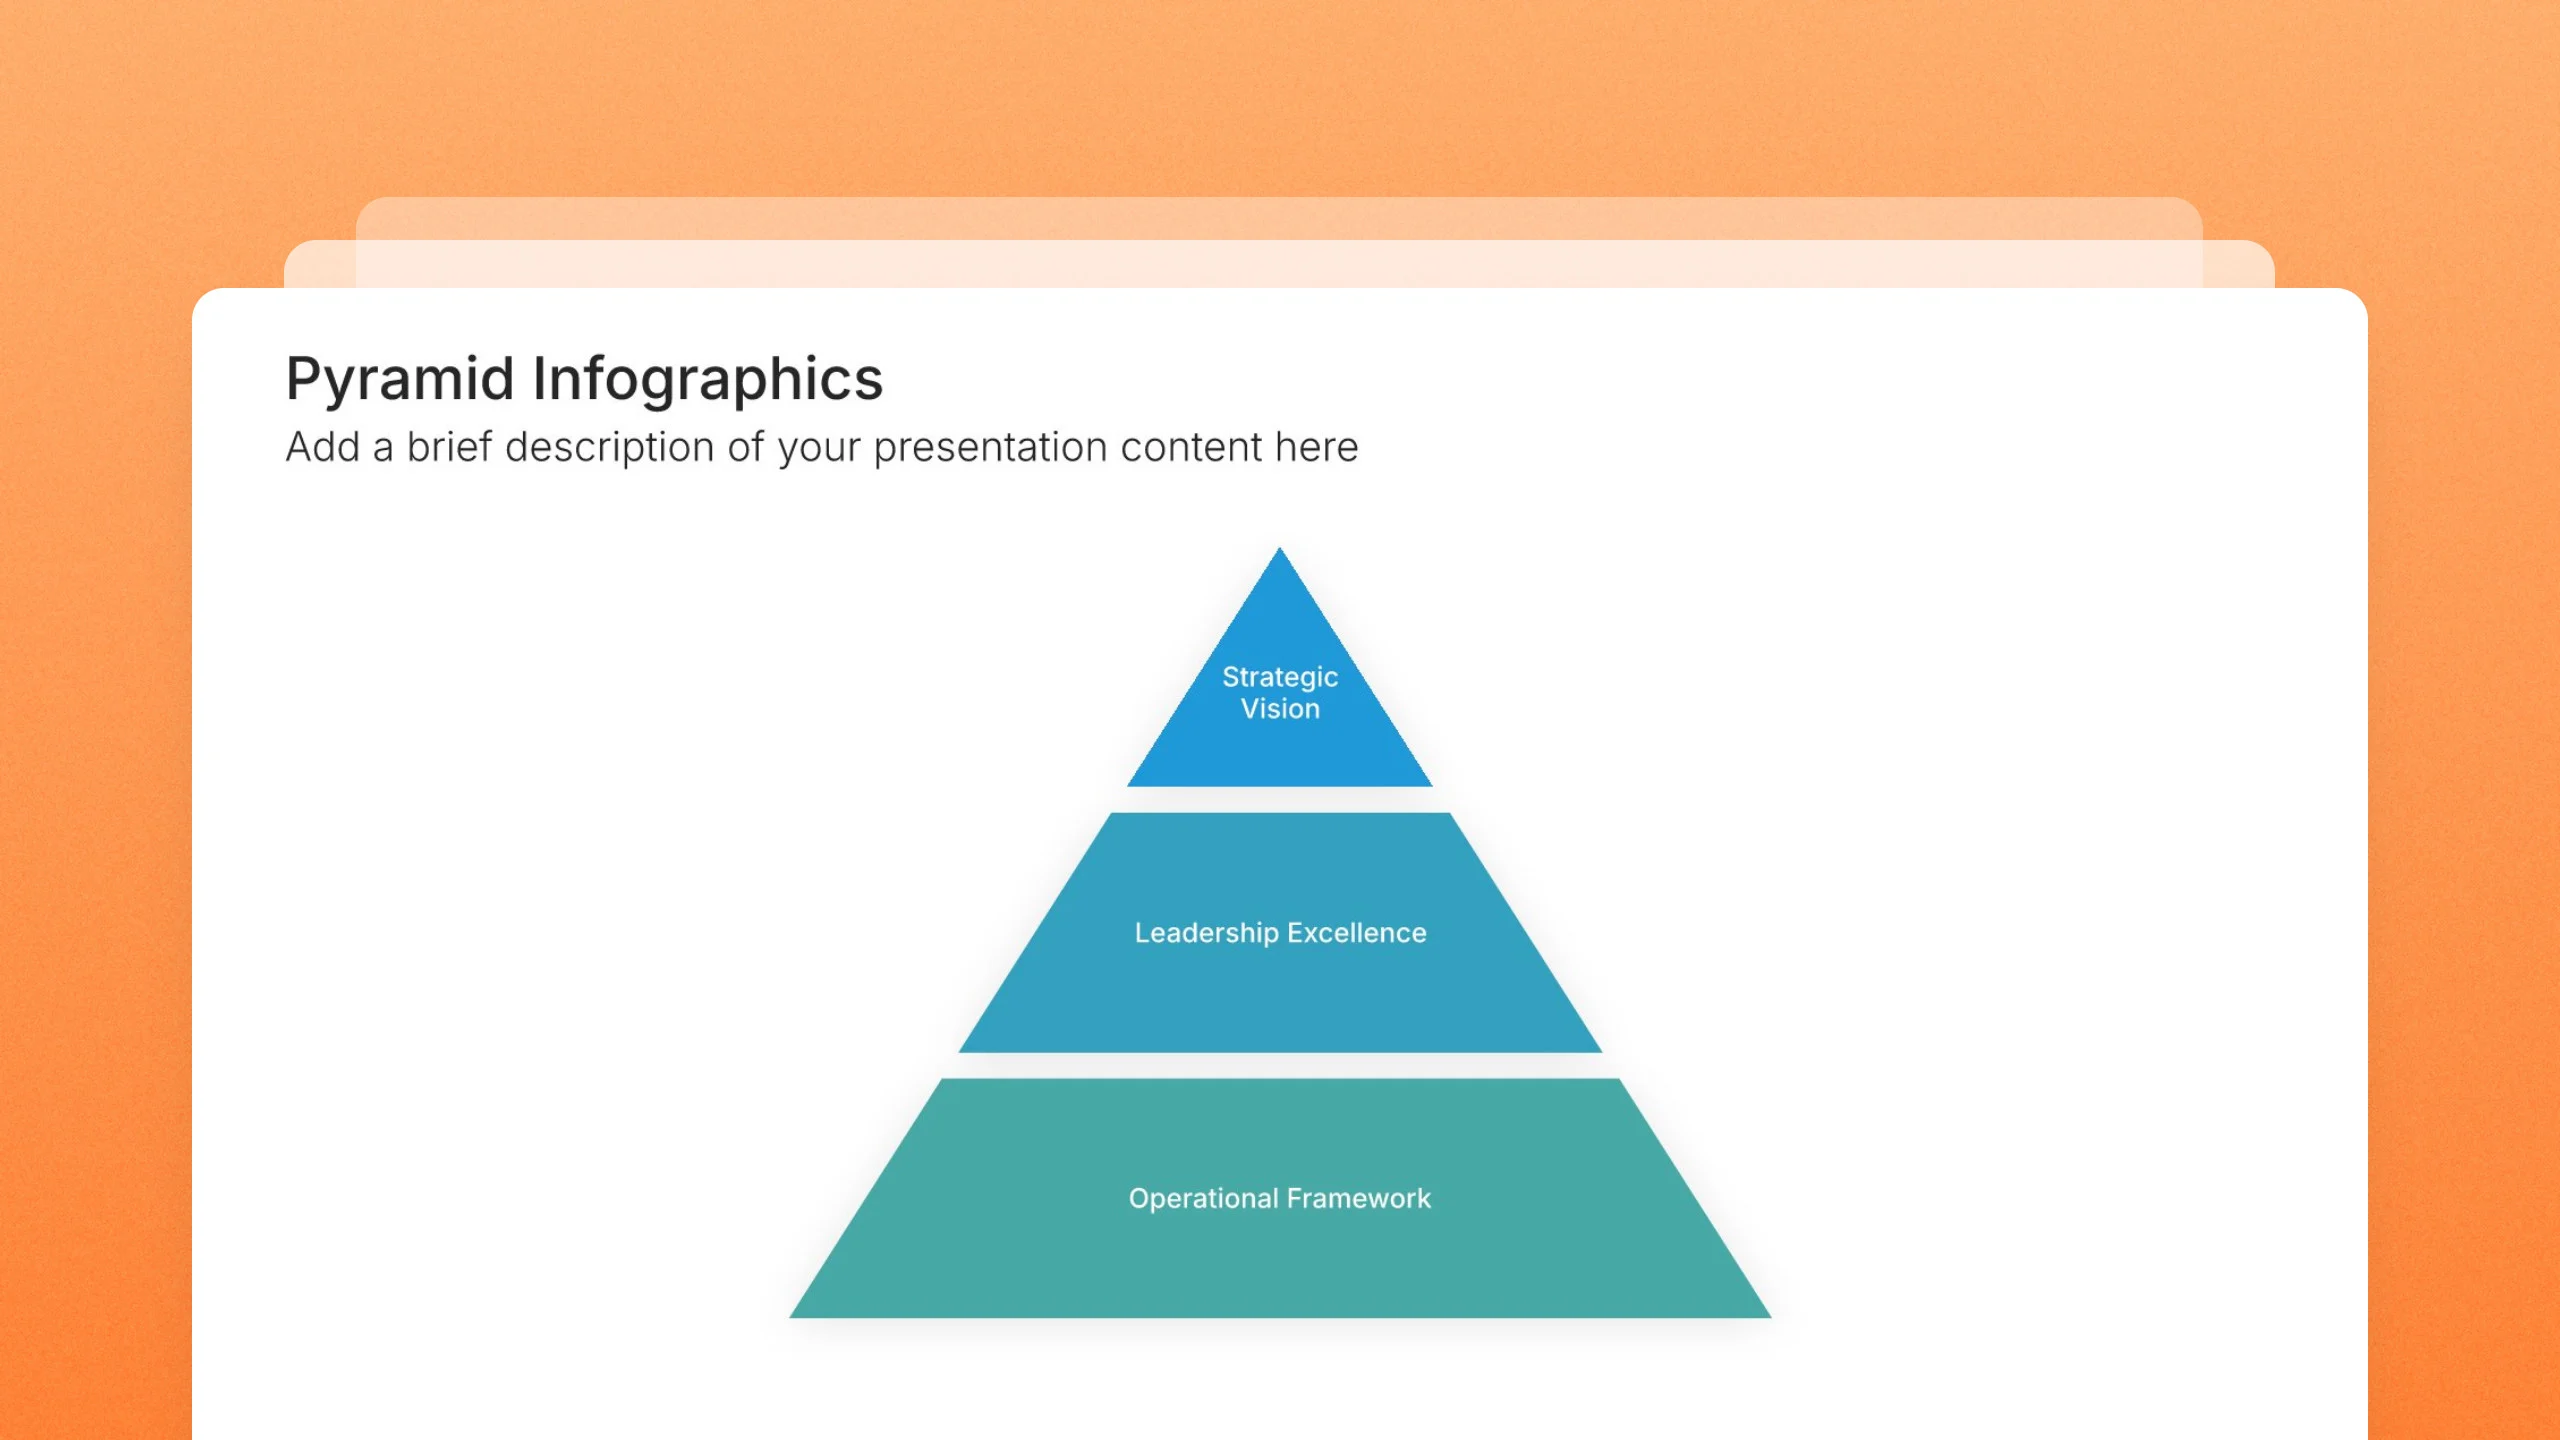
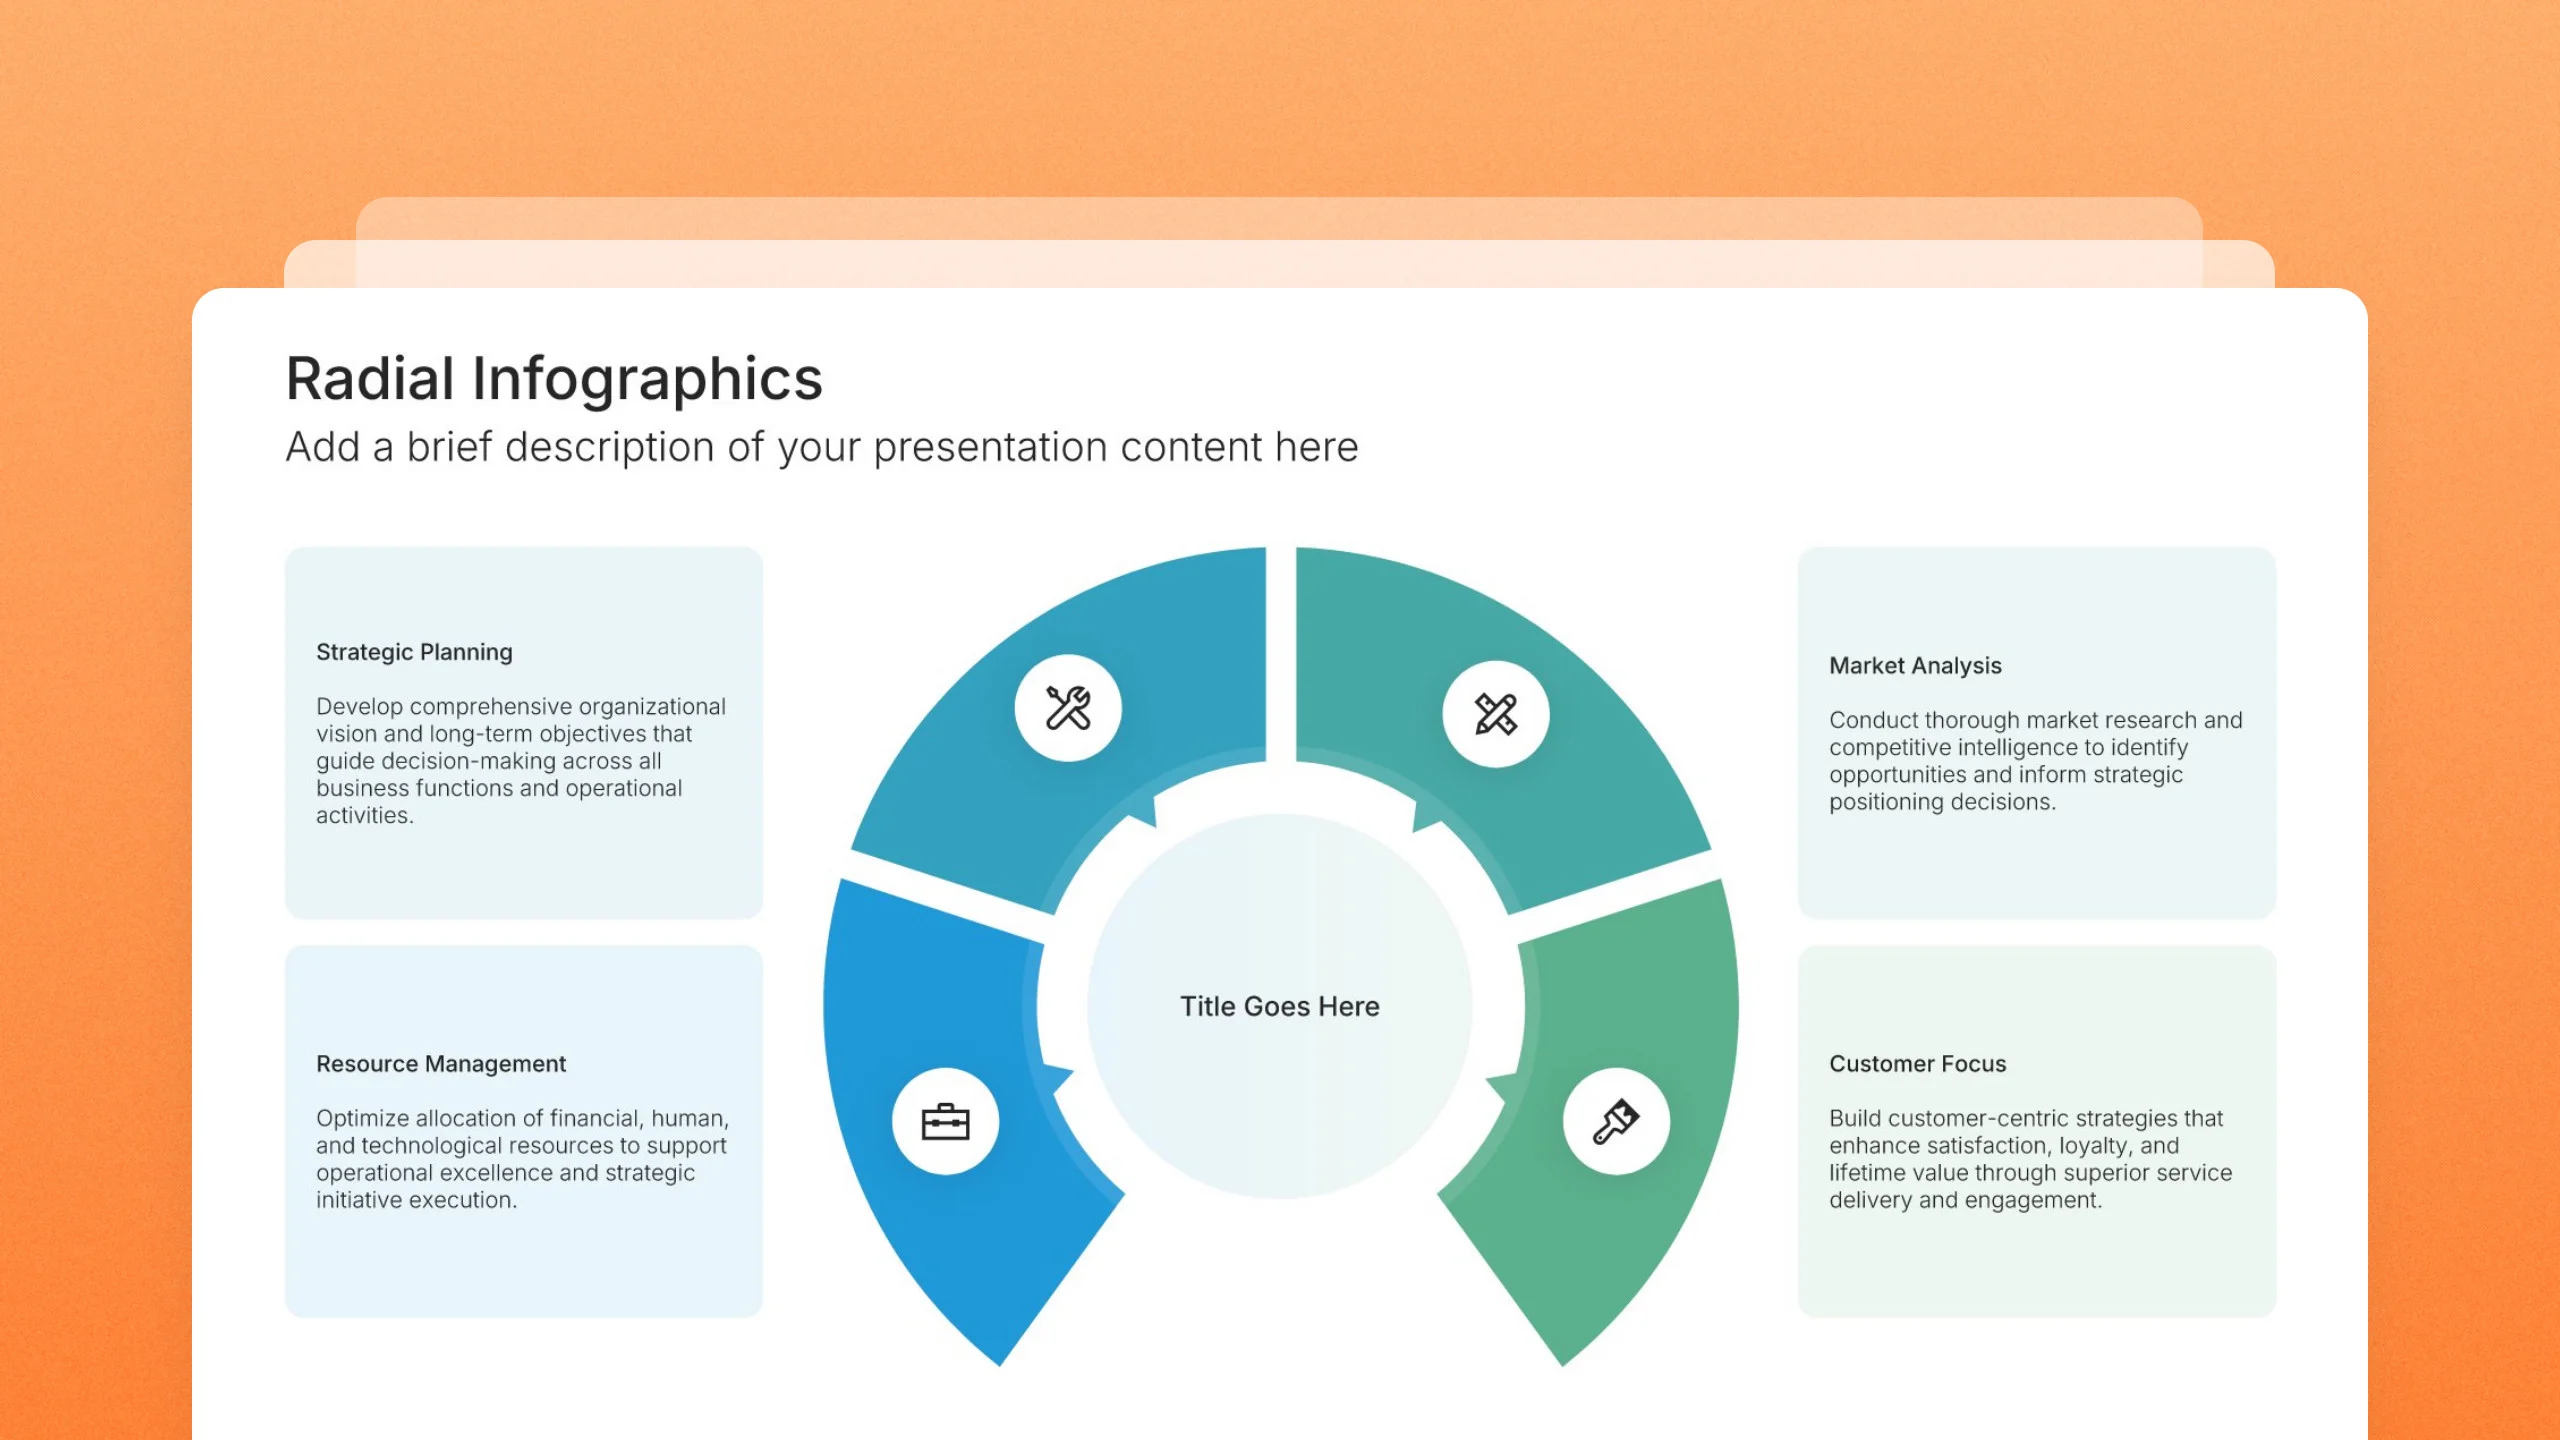
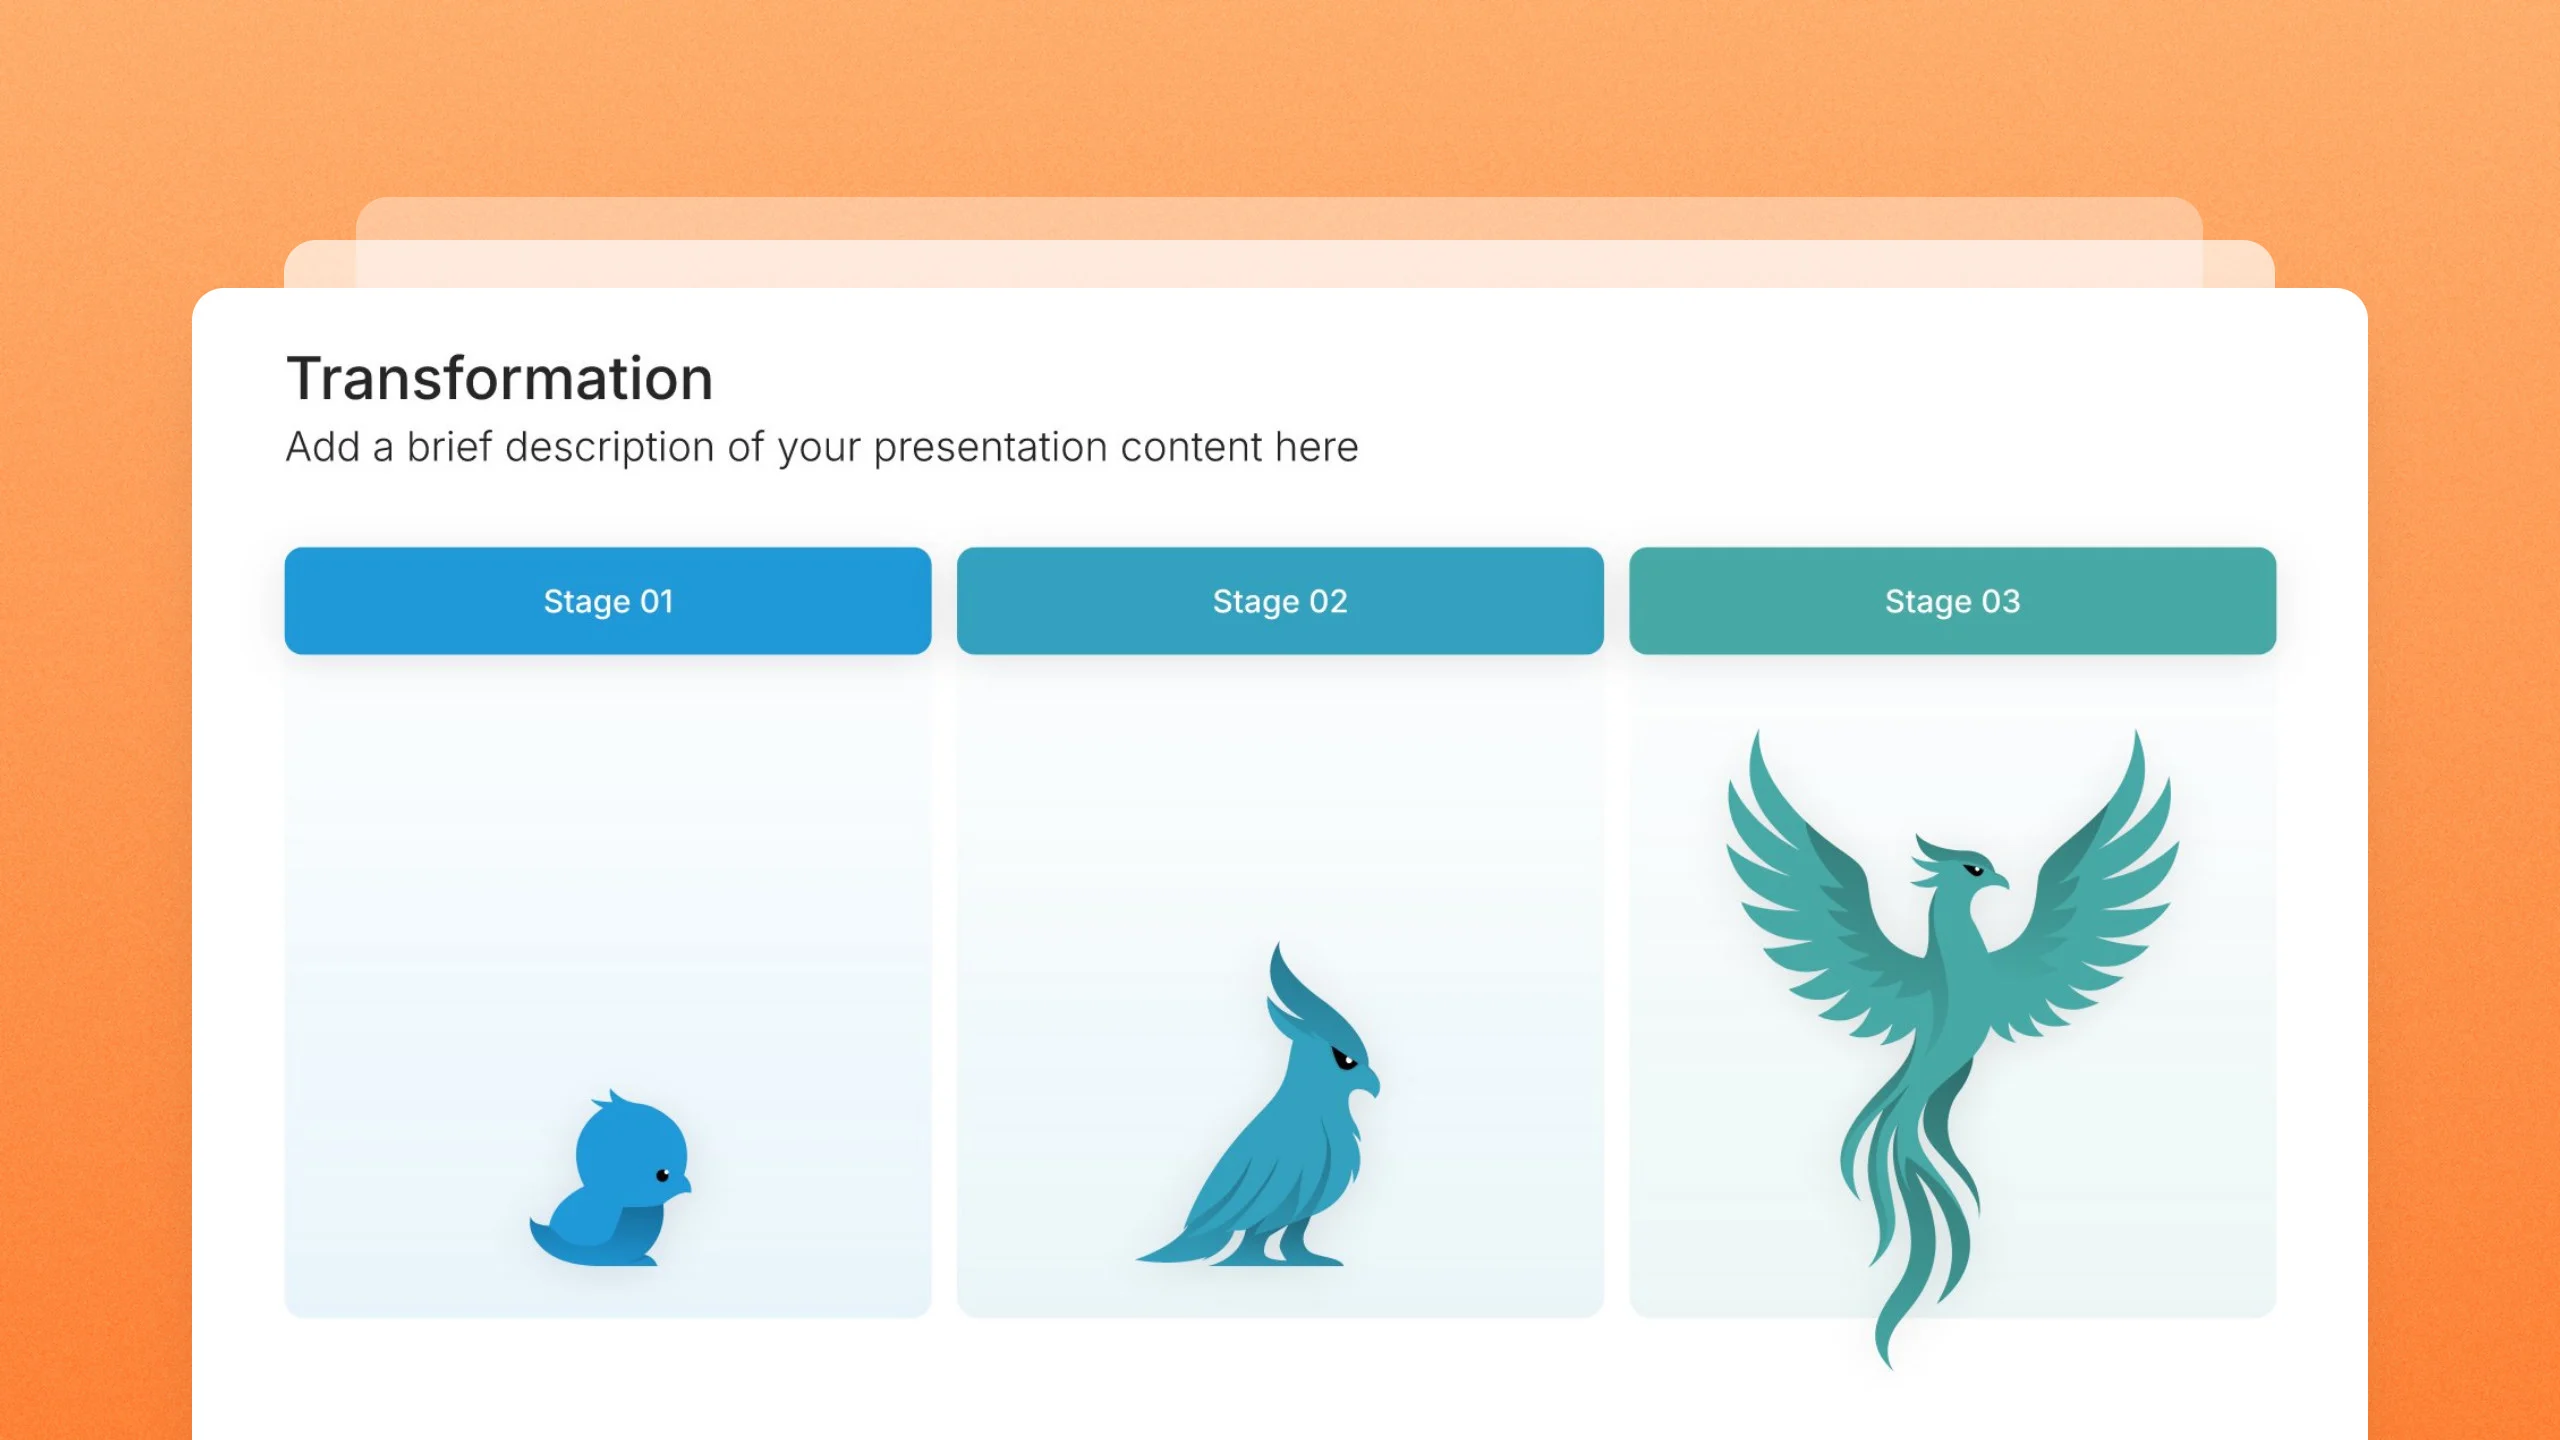
Infographic templates turn a list of points into a shape the audience reads at a glance: a funnel for a pipeline, a cycle for a process that repeats, a pyramid for a hierarchy. Pick from 31 types and 477 layouts, brand them to your company in one click, add your content, and export to PowerPoint, Google Slides, or Keynote.

Free to start. No credit card required.
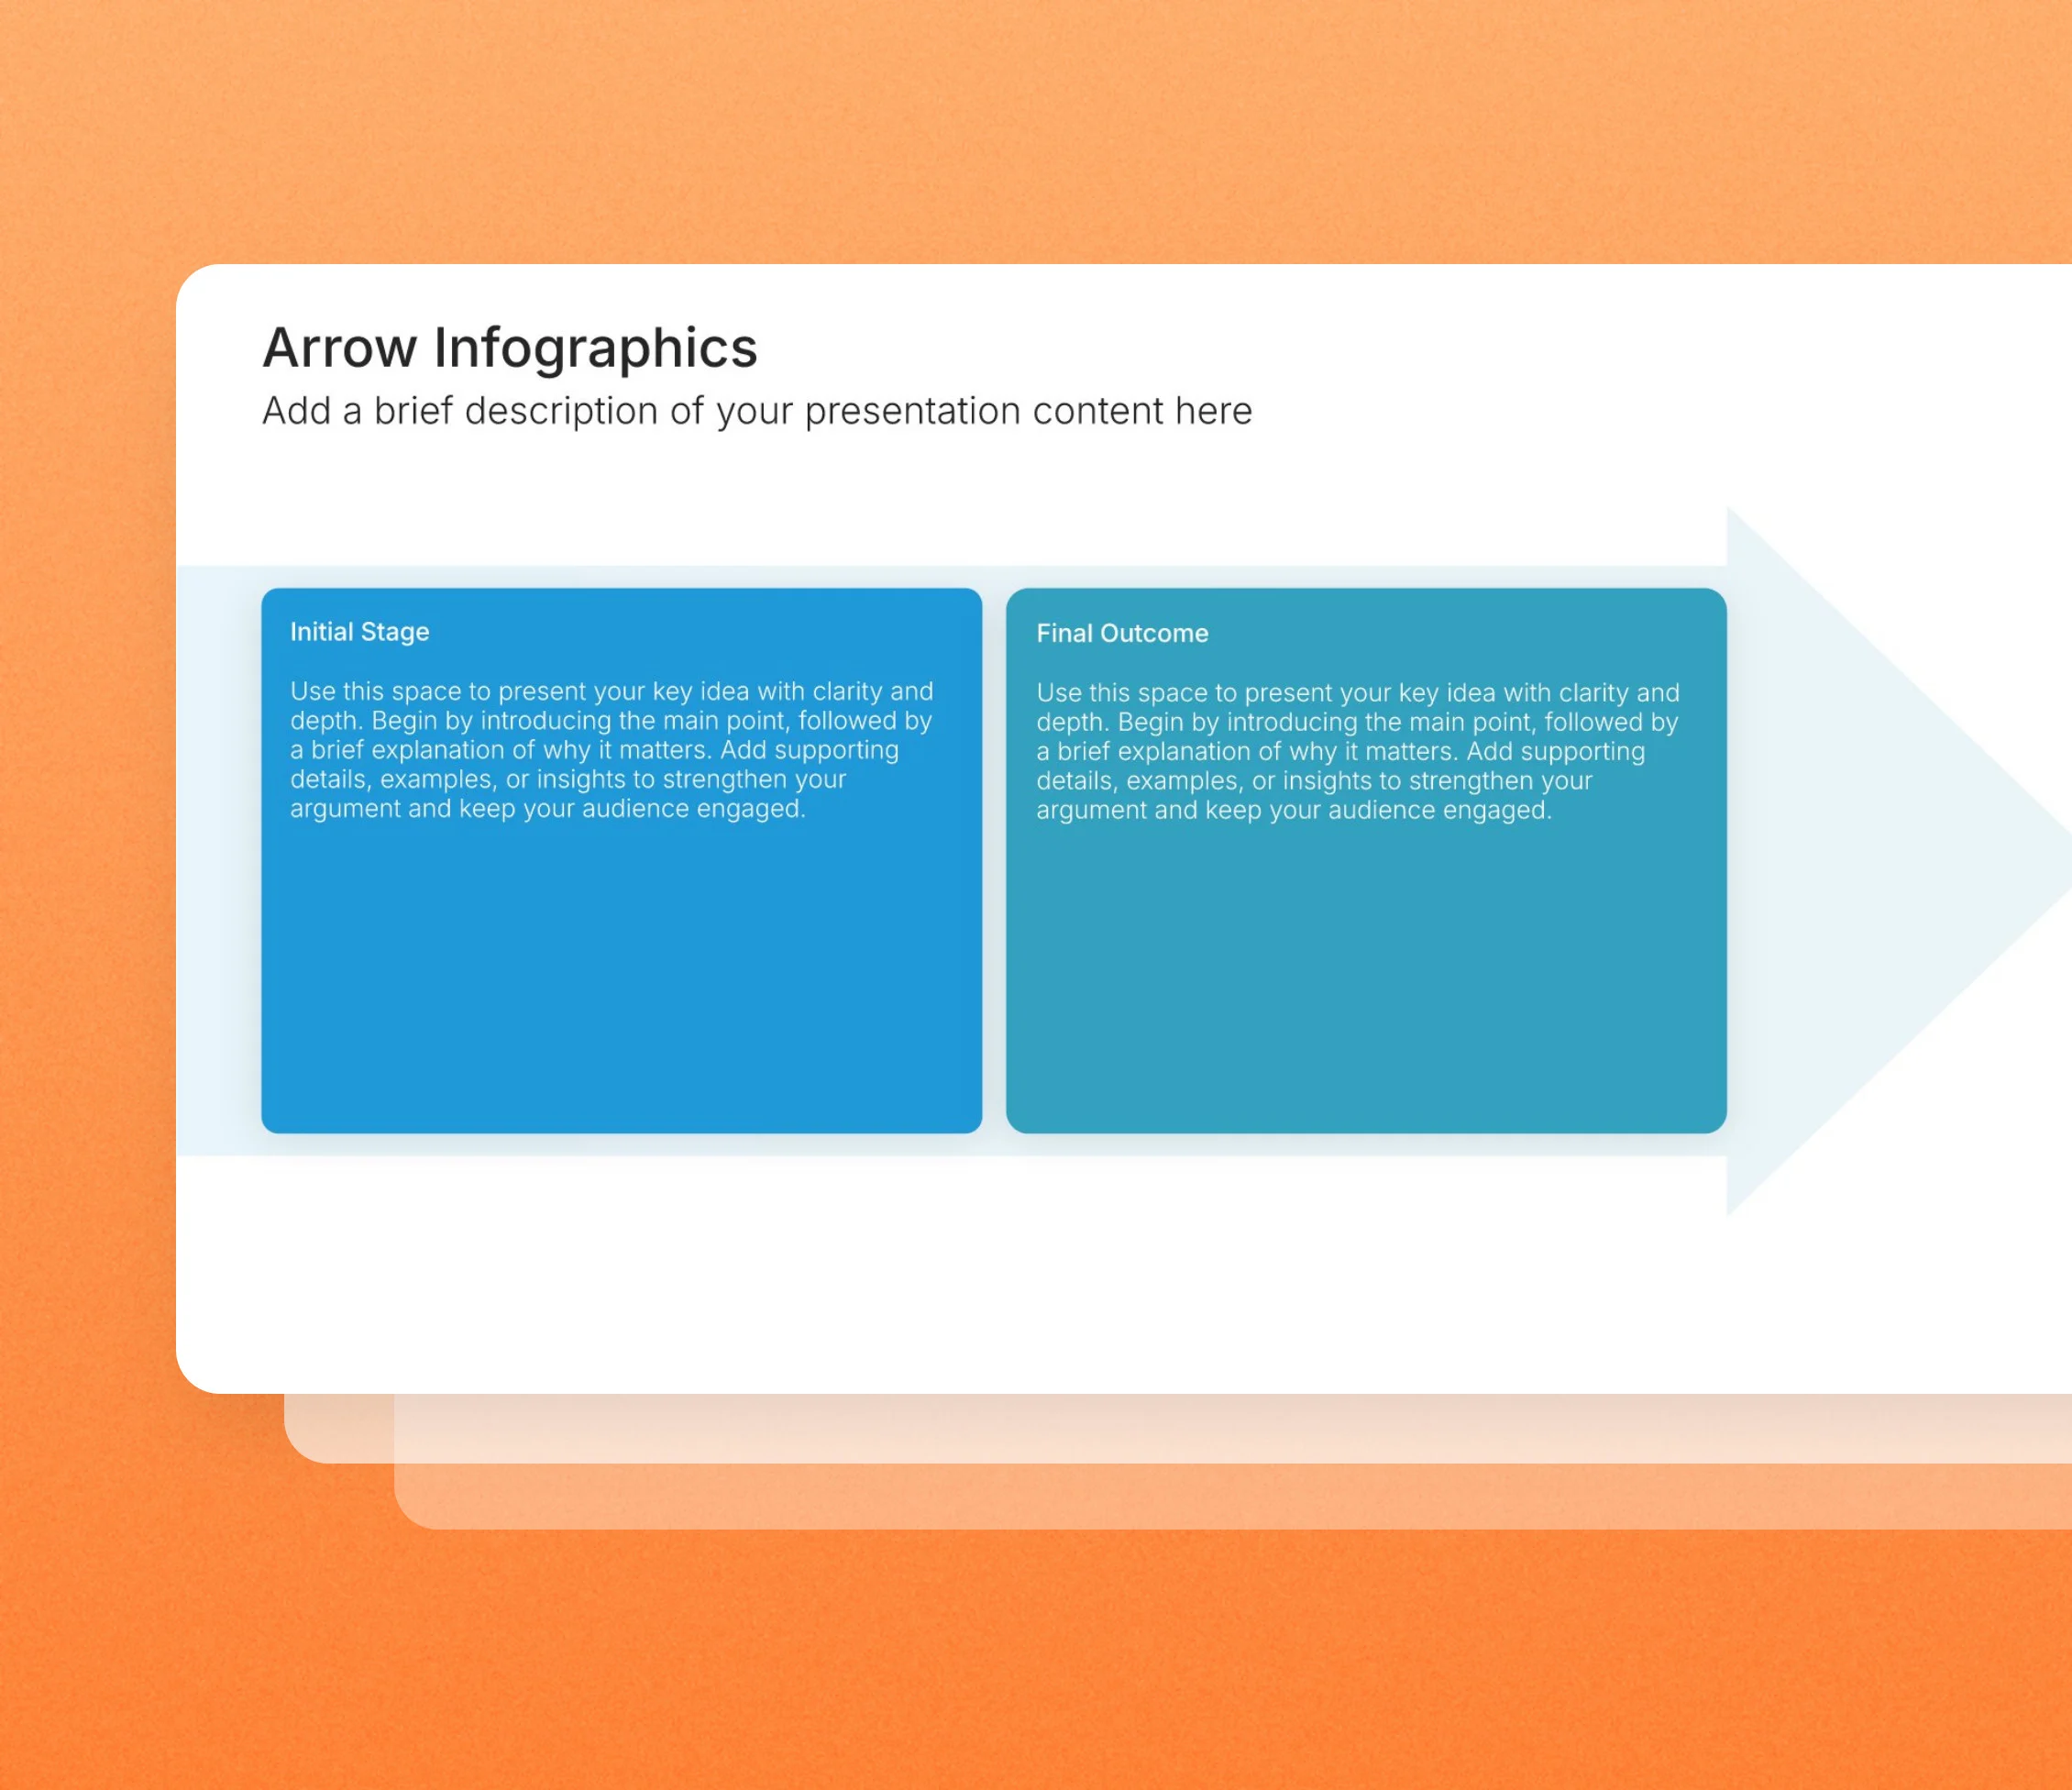
Infographic templates in the Choladeck slide library

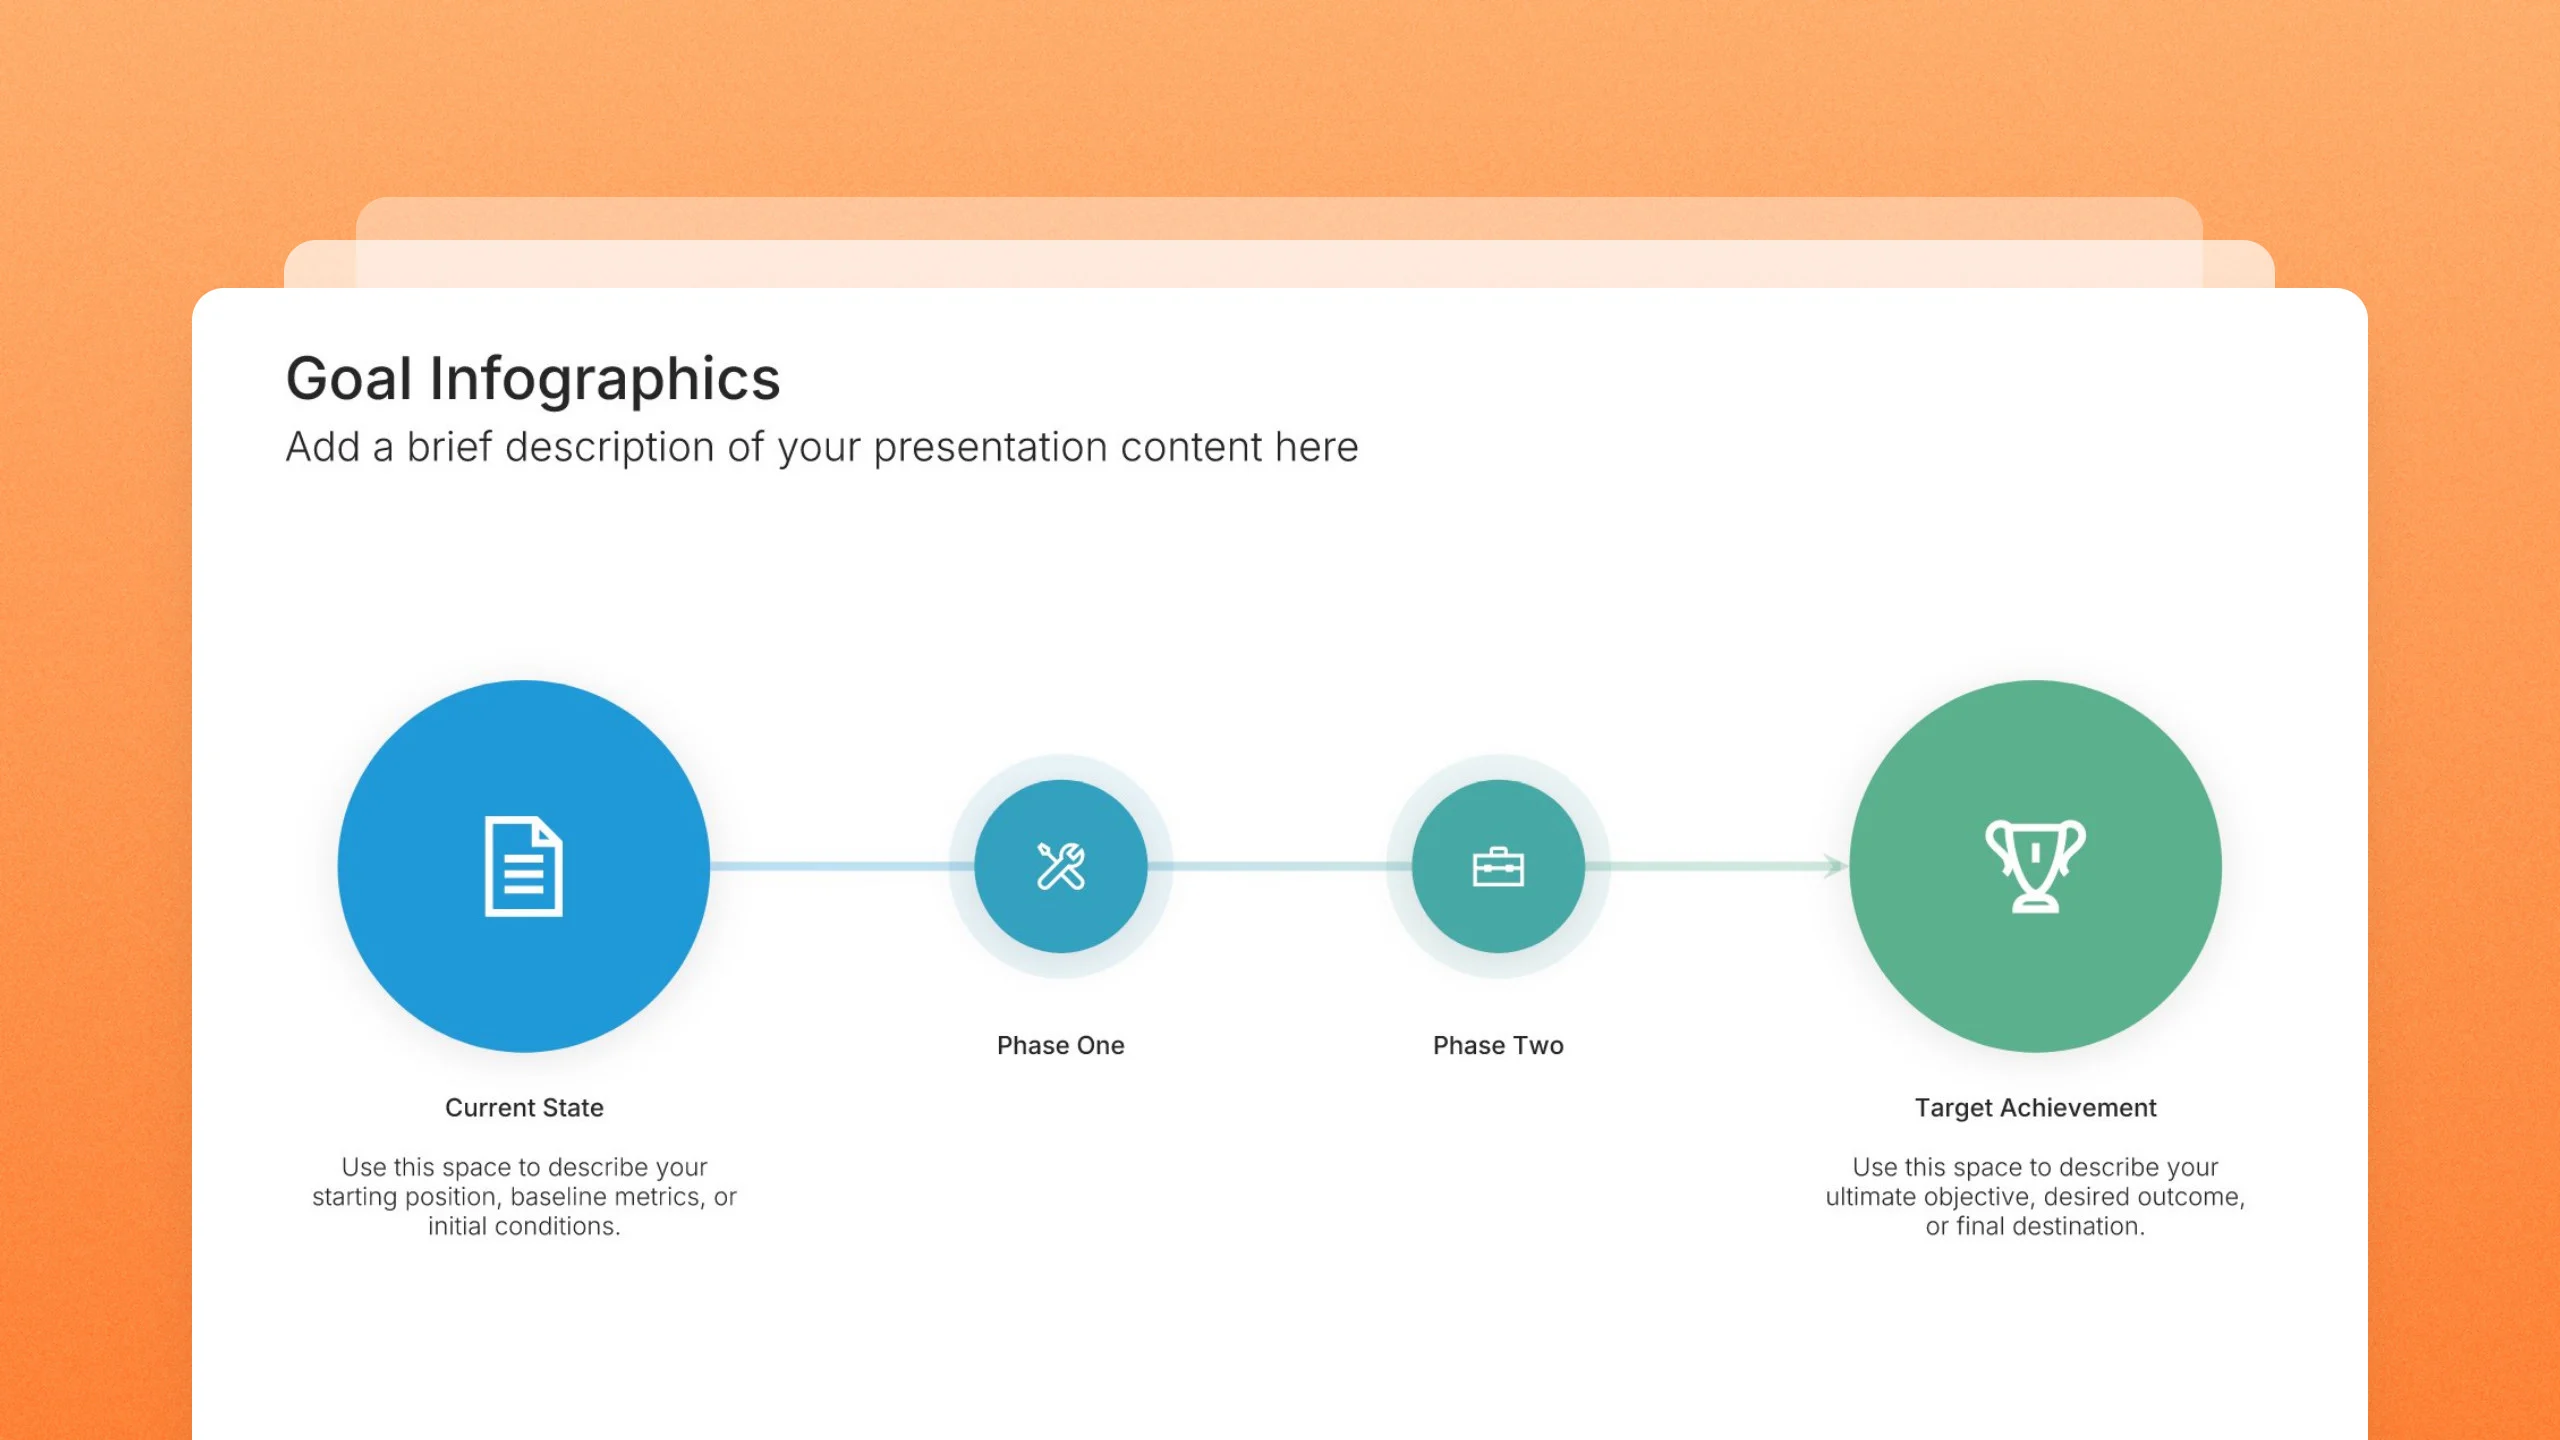
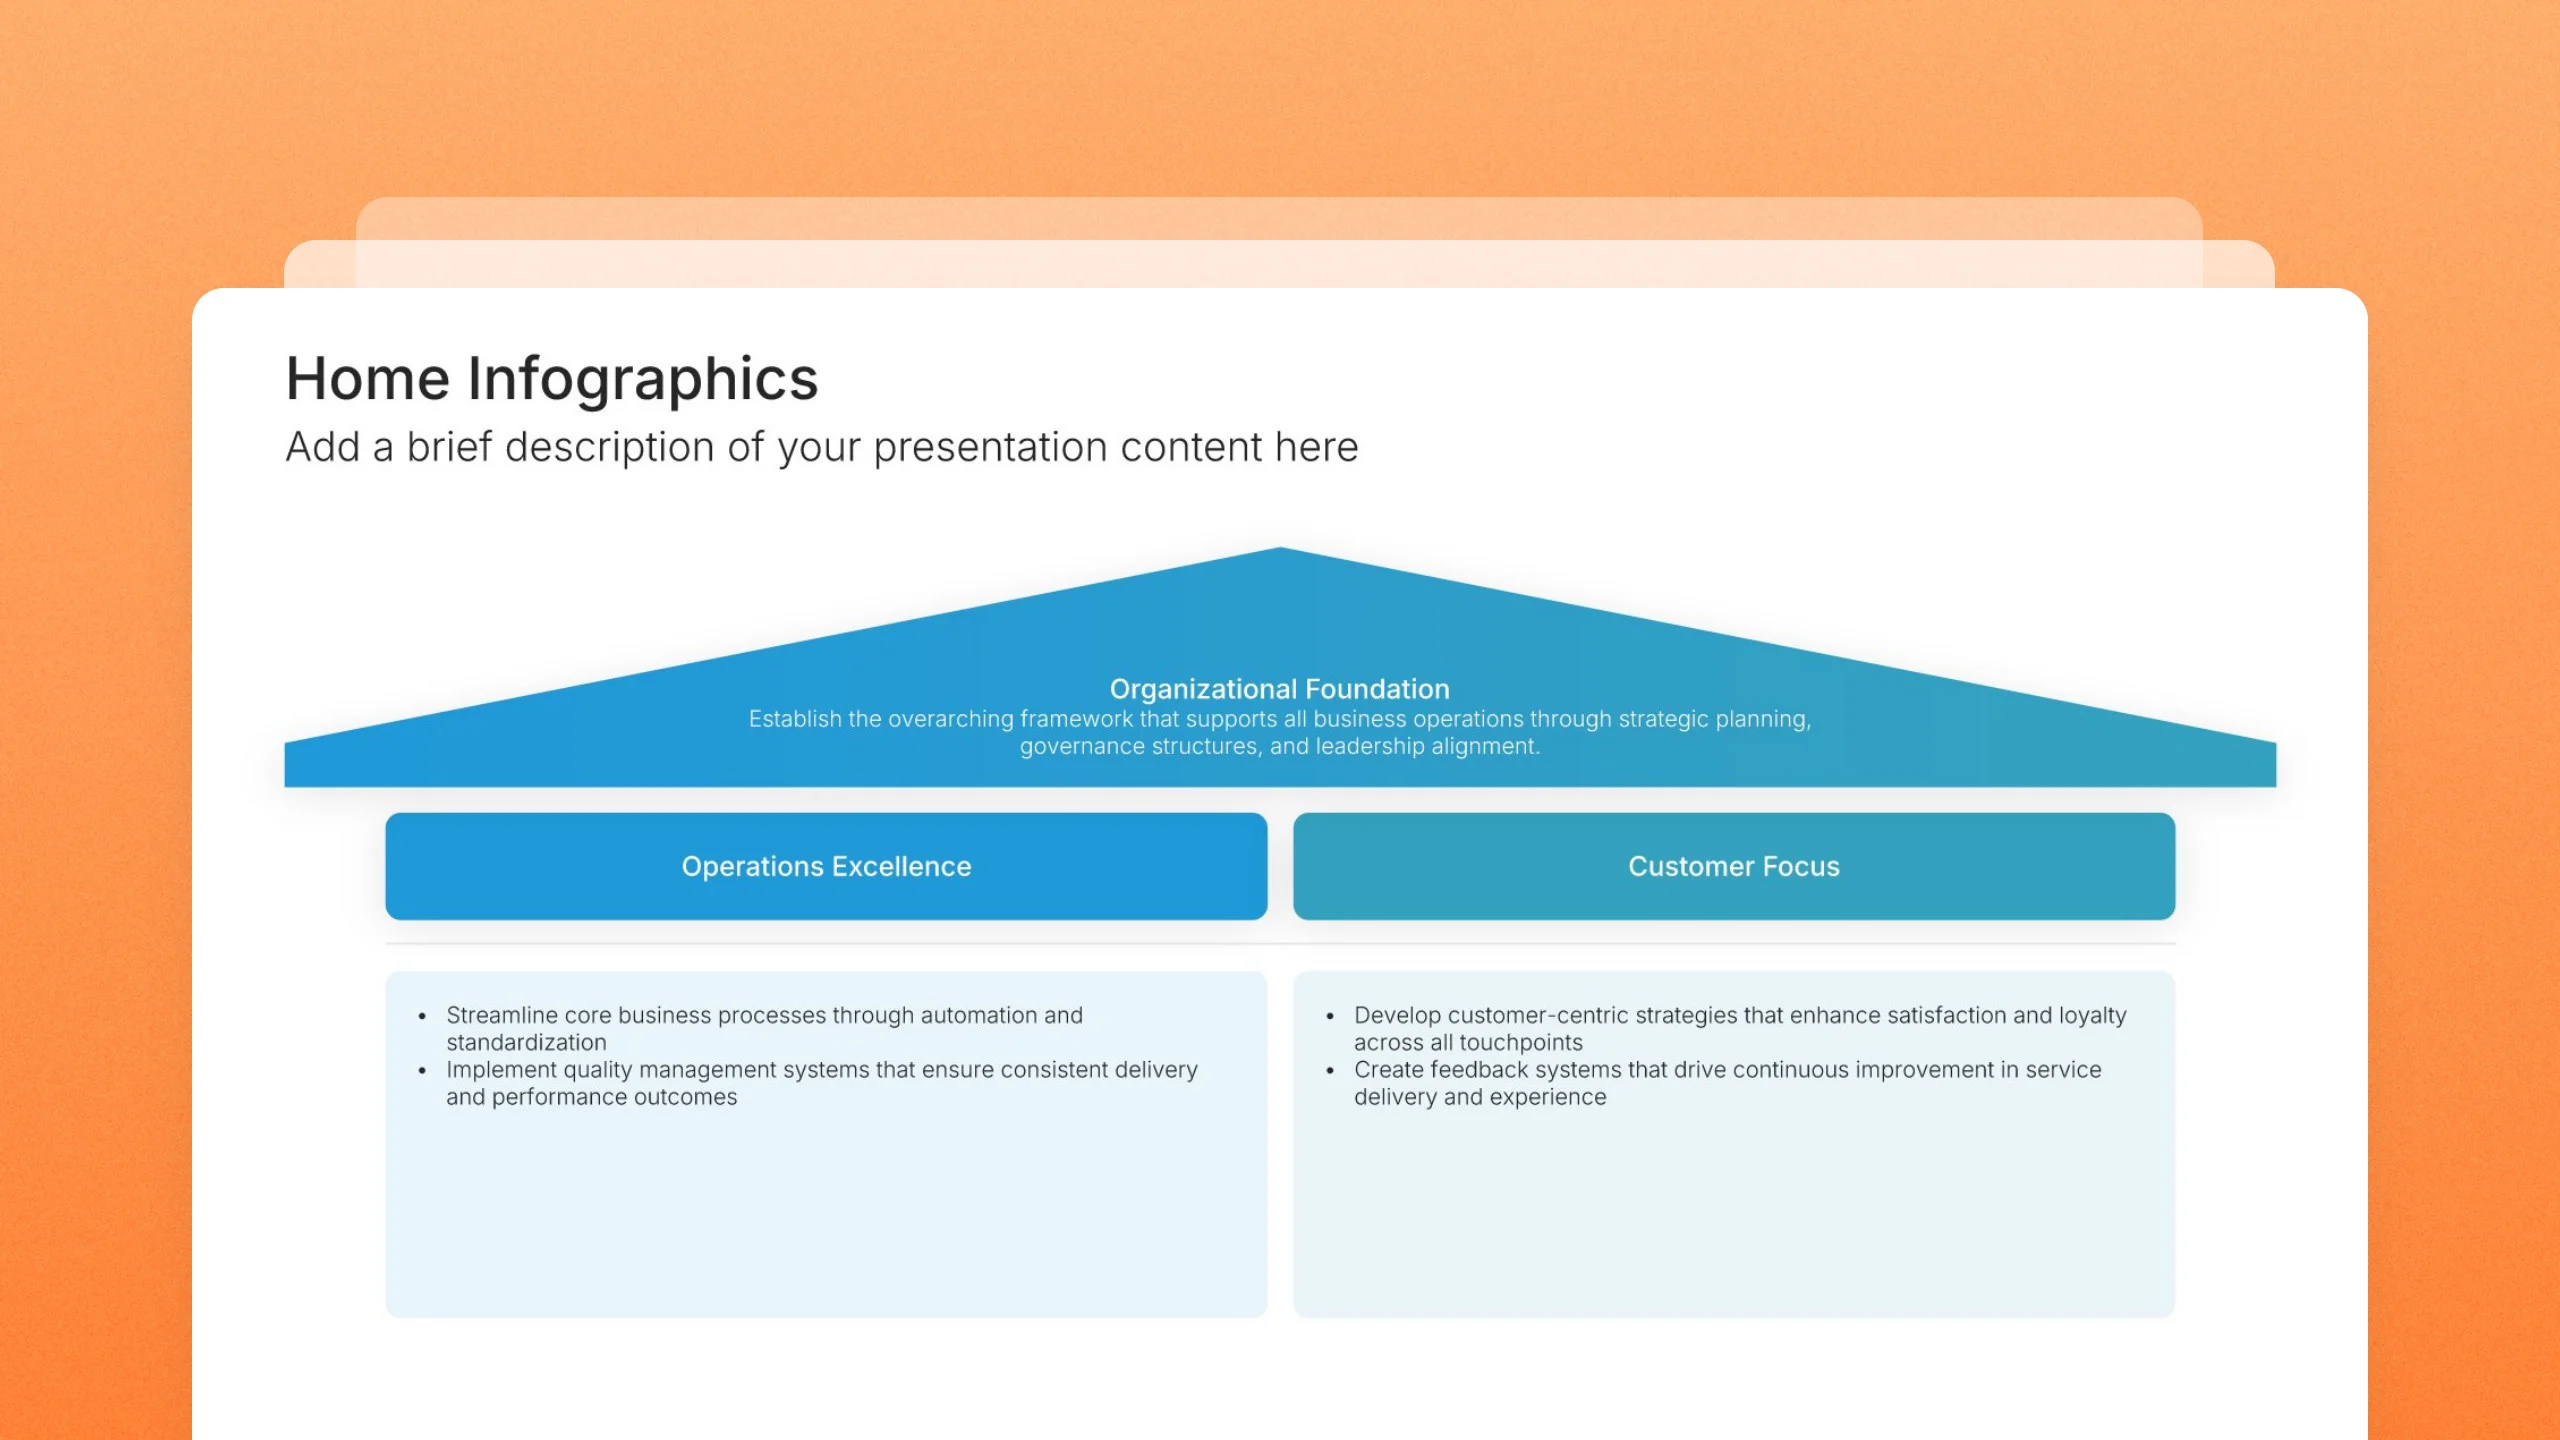
Browse infographic slides by type

31 types of infographic and 477 layouts, all fully editable.
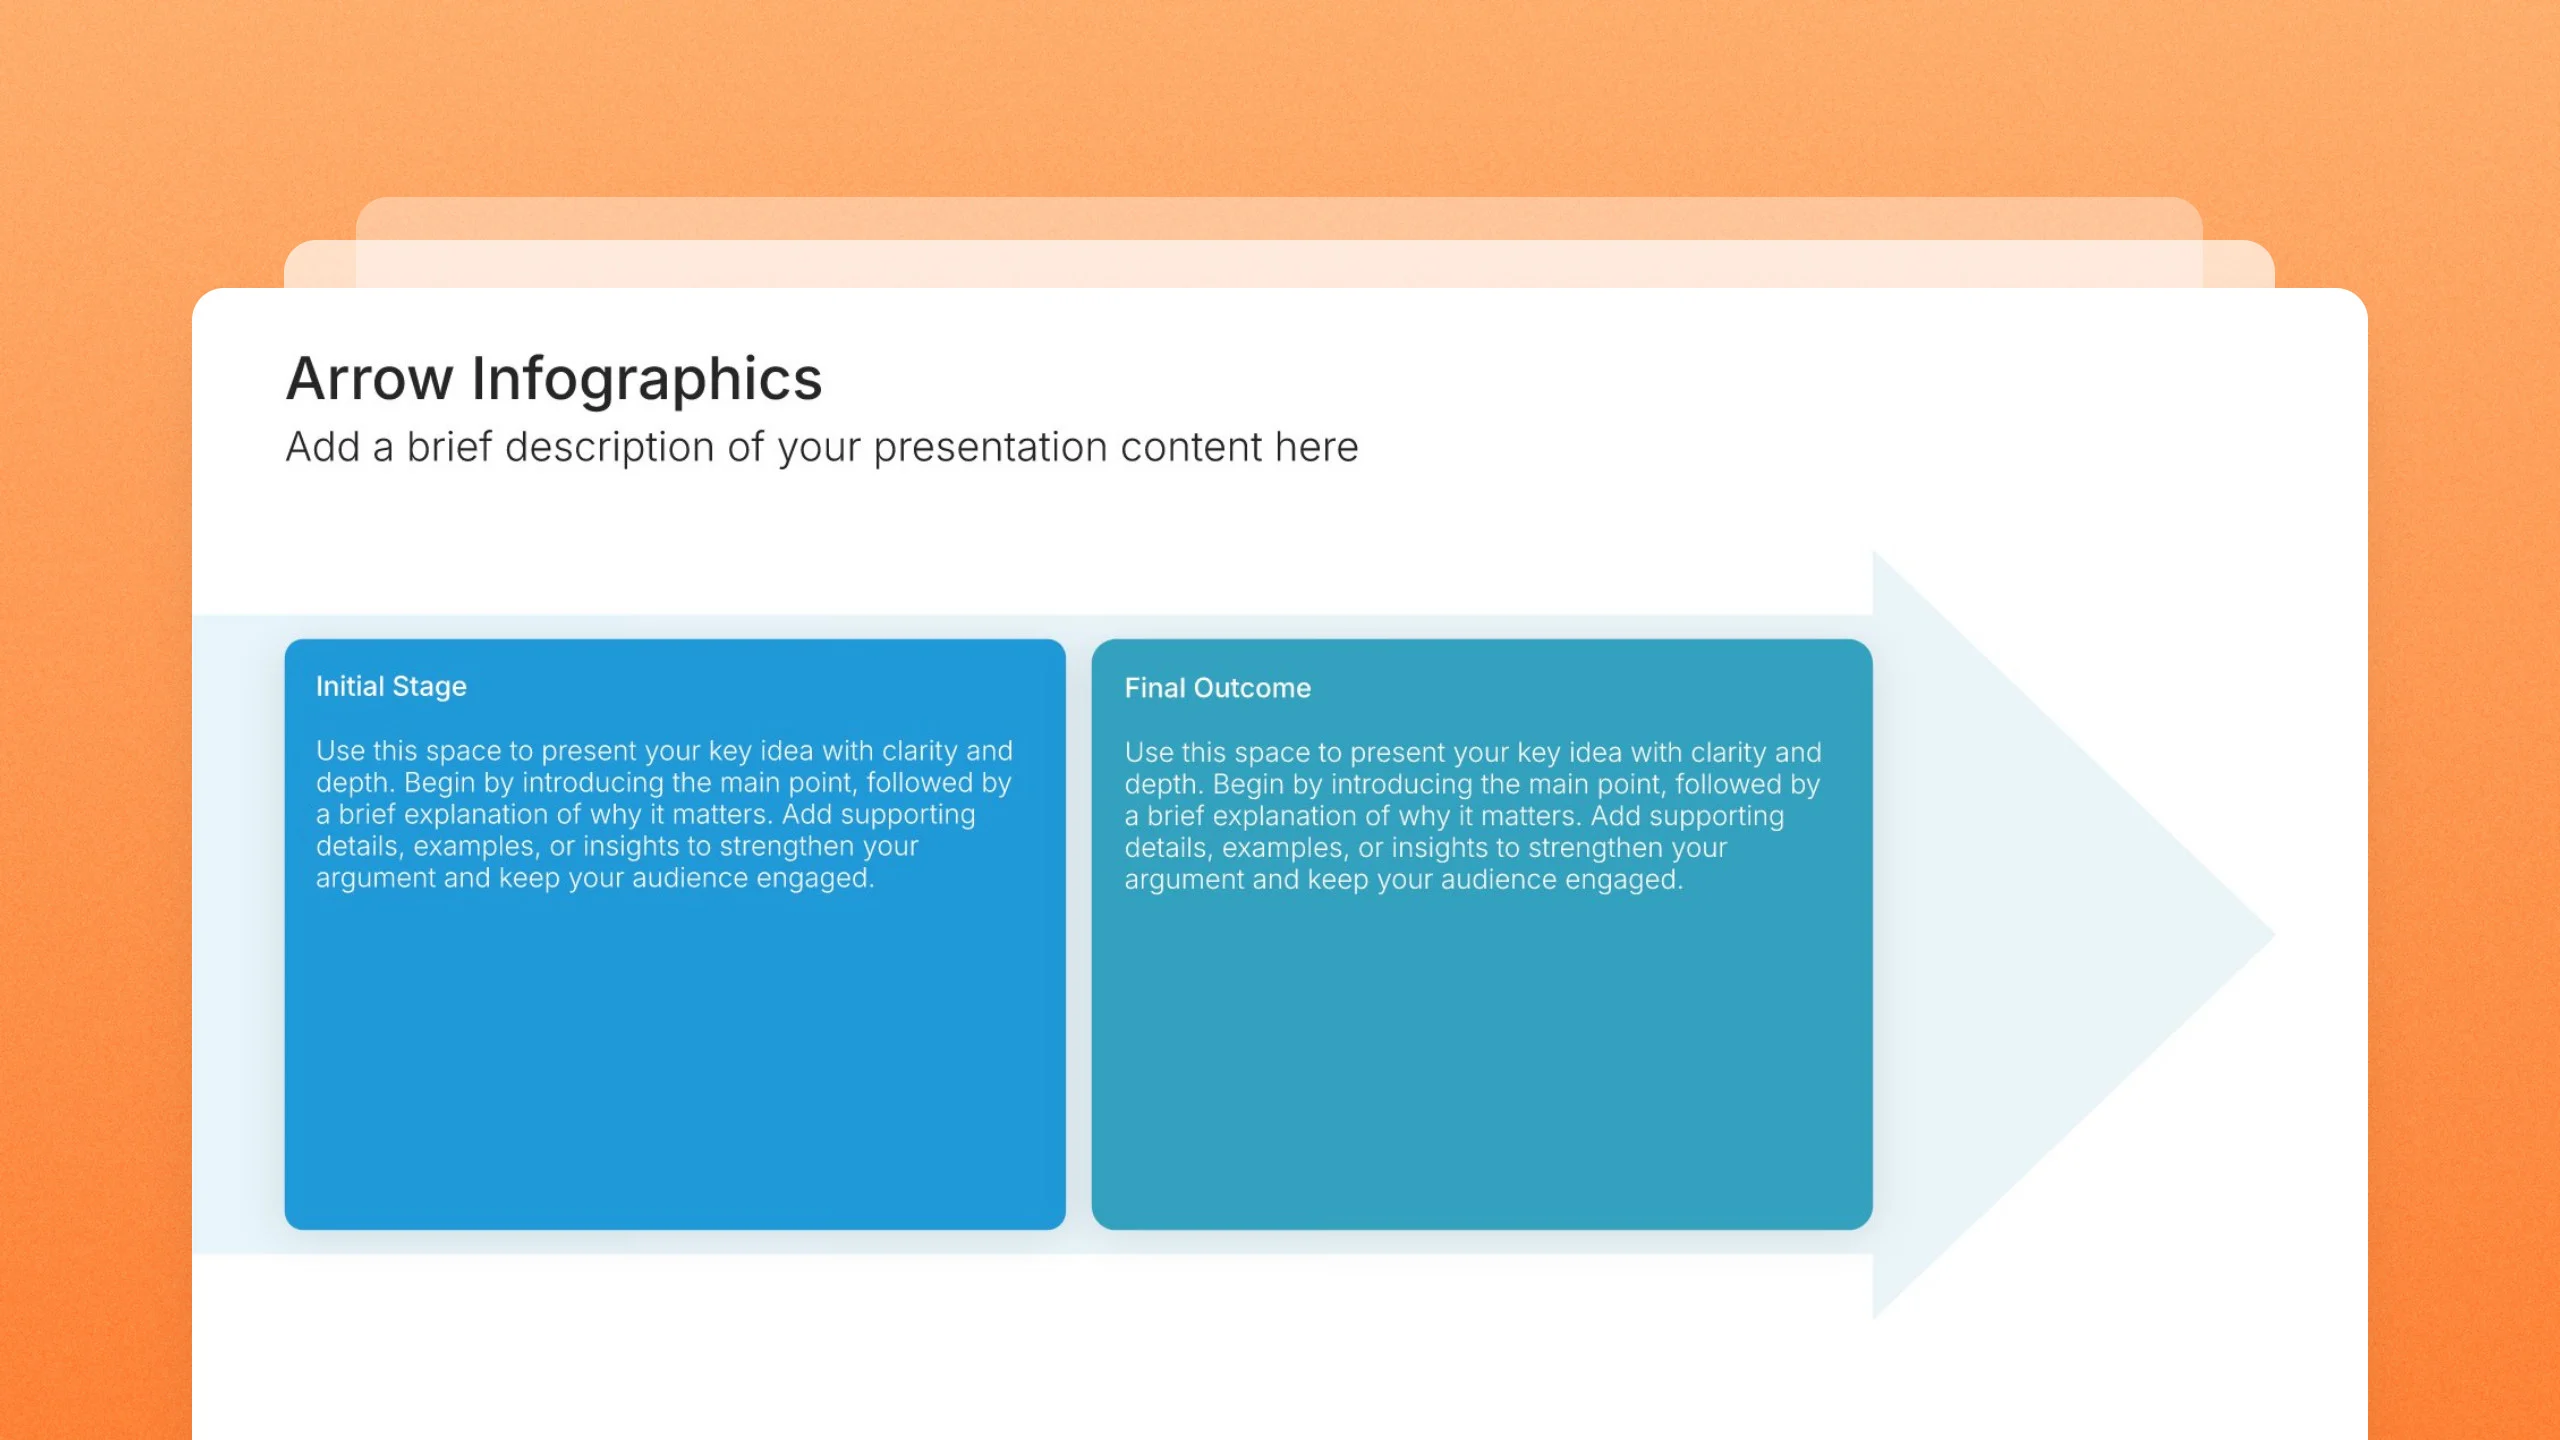
What you get with our infographic templates

What the slides do, how to mix them, your brand, and a file you can edit anywhere.

Built to show how ideas connect, not just list them

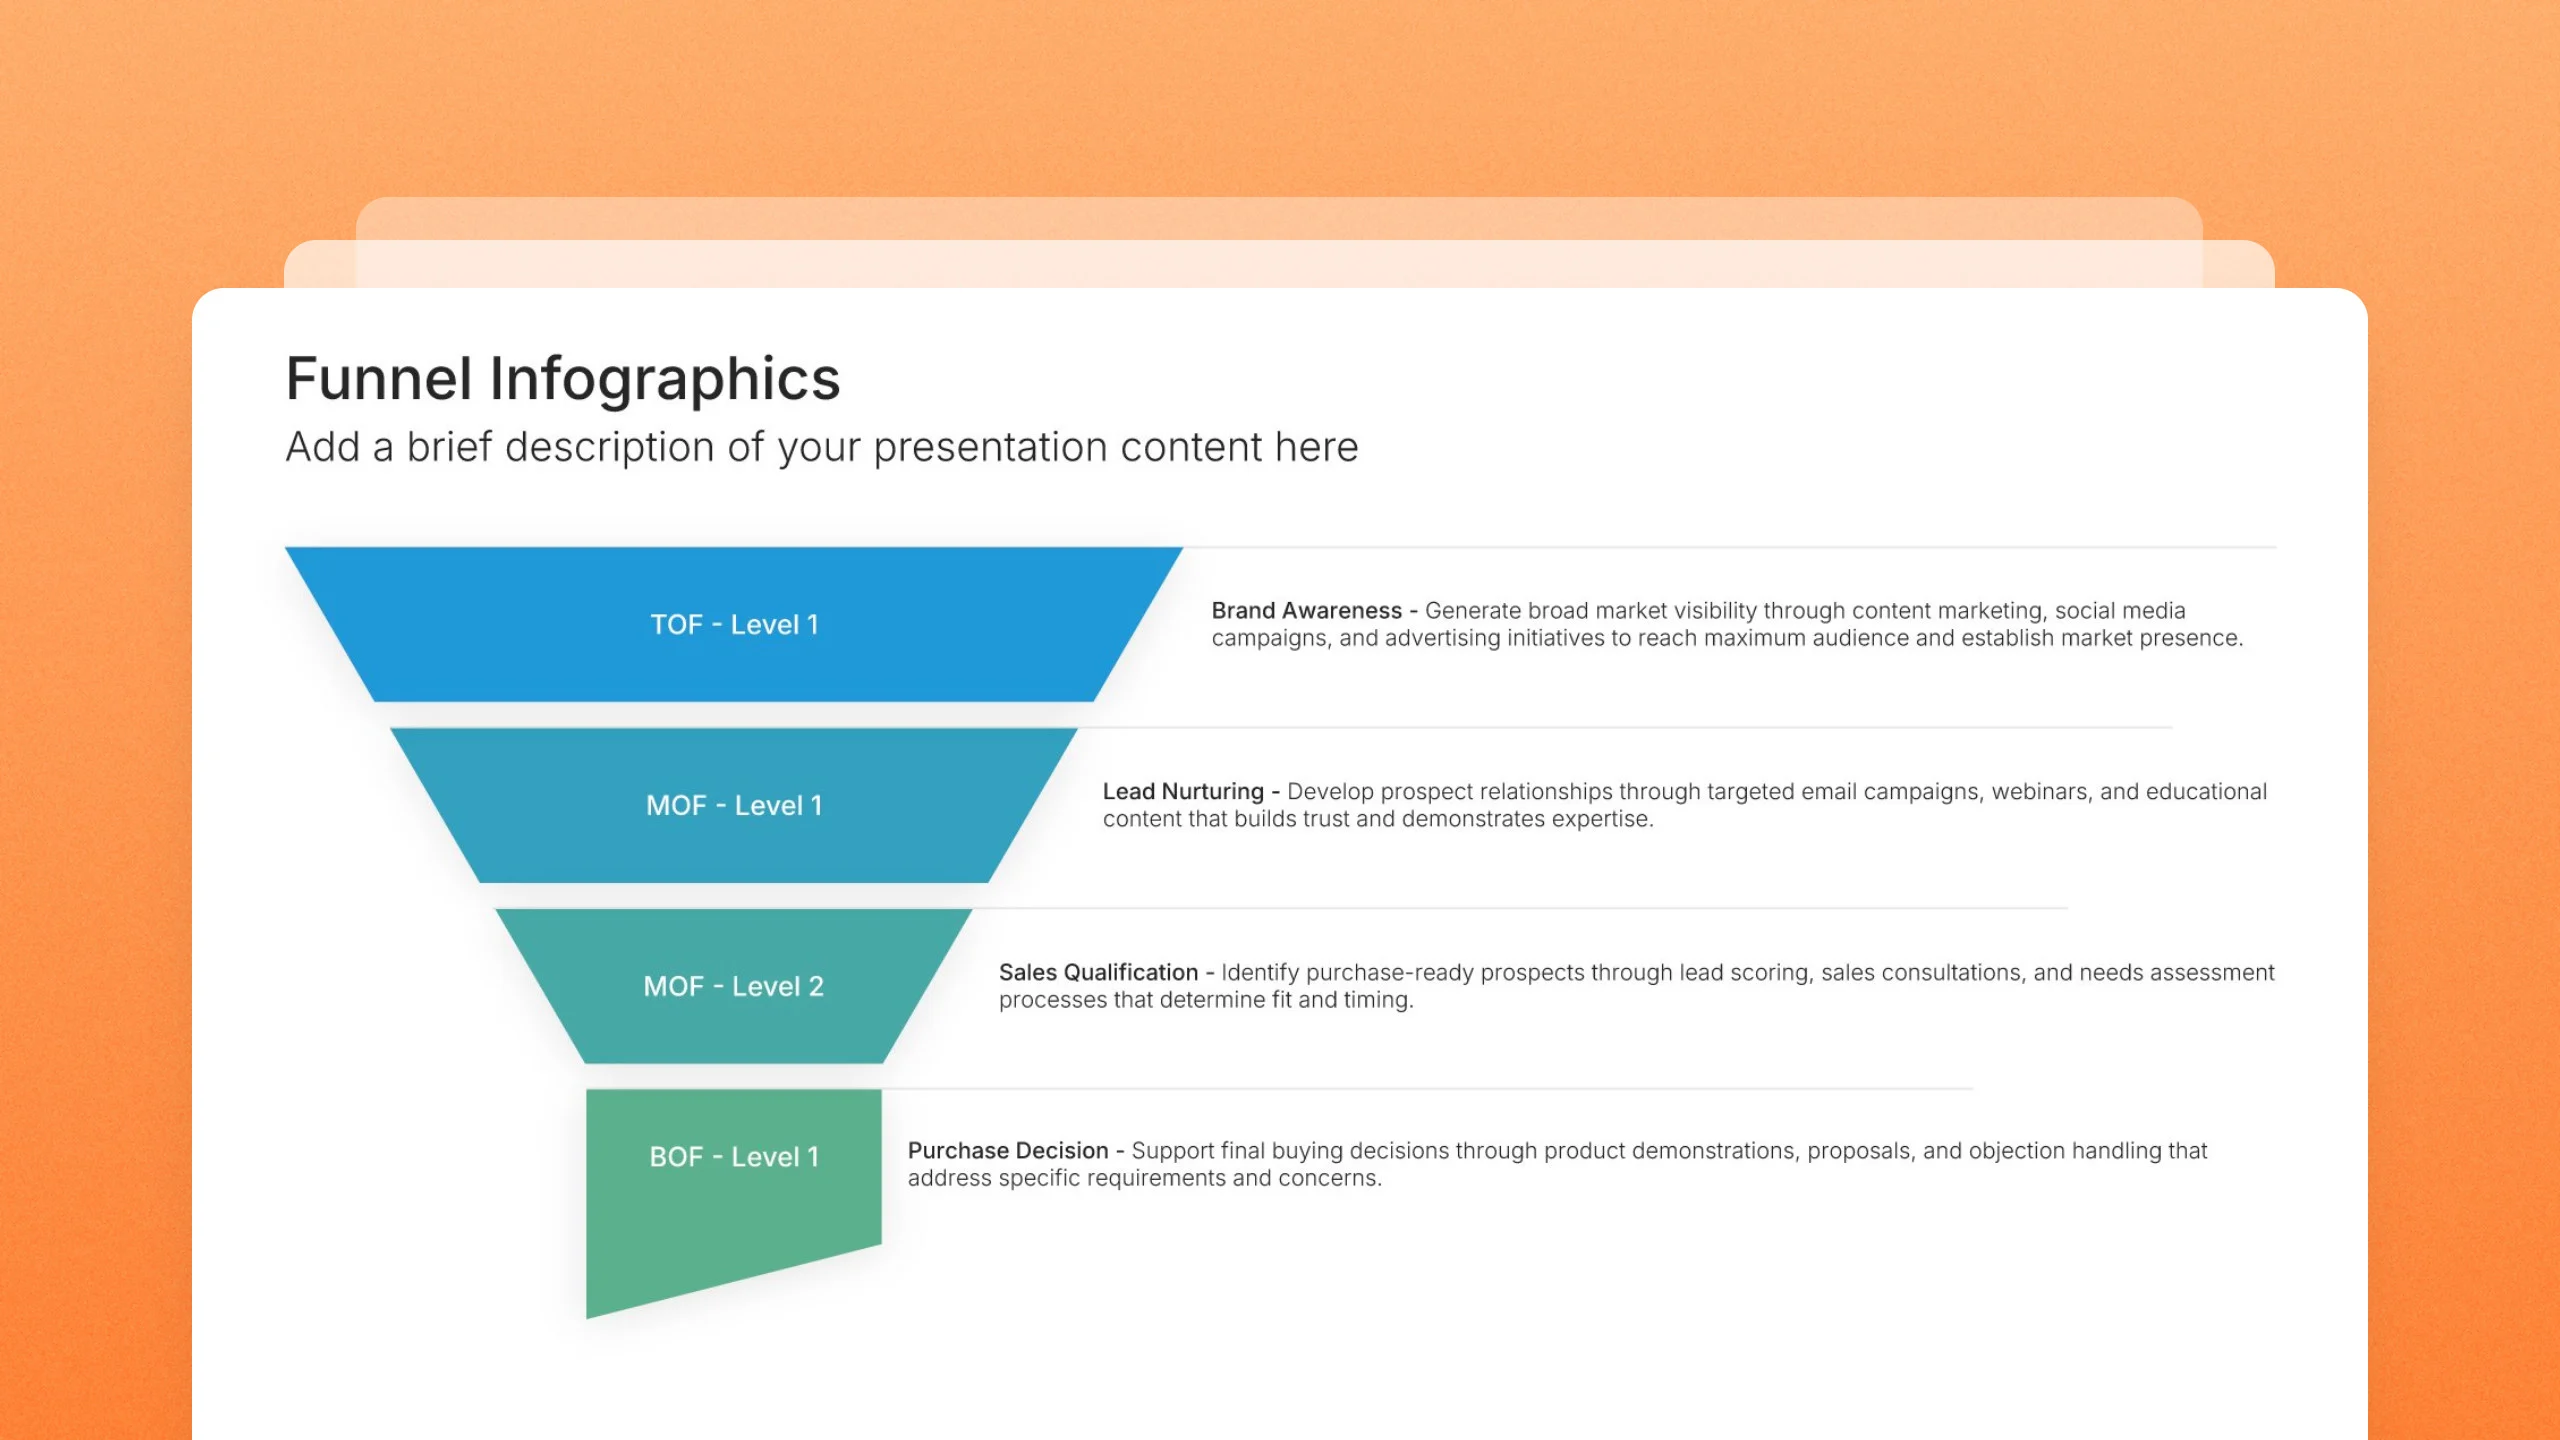
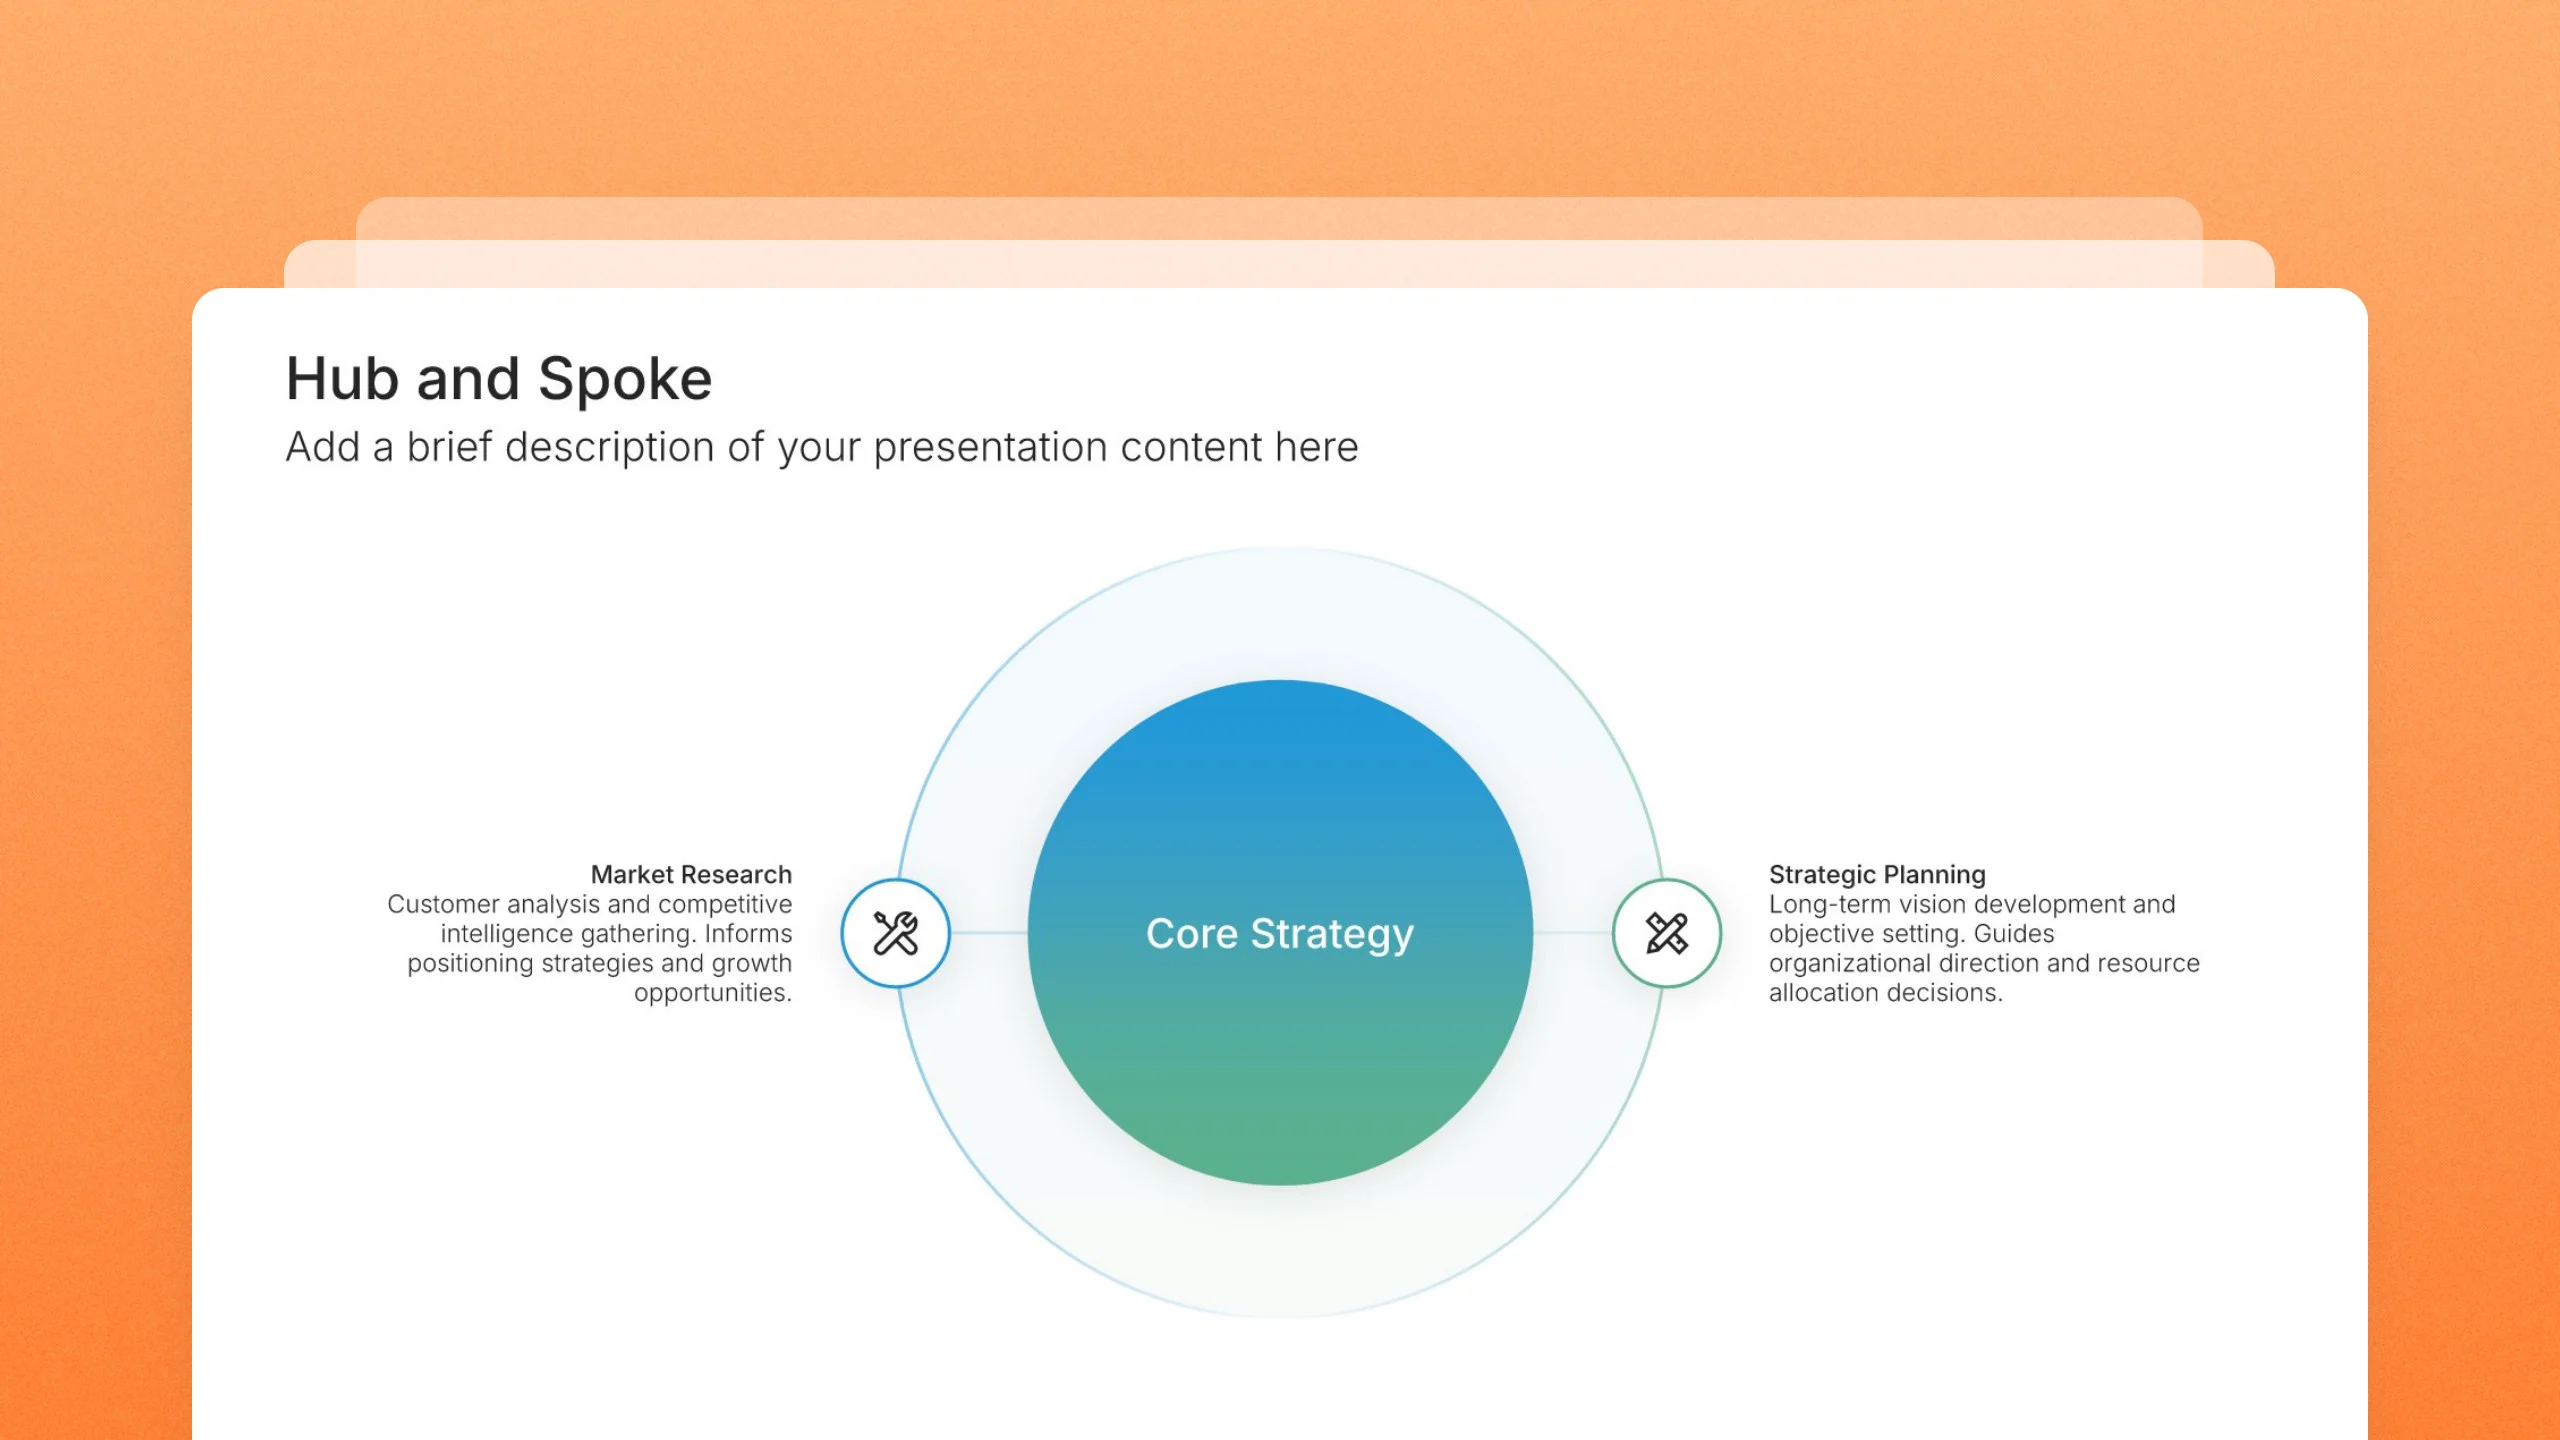
A list asks the audience to work out how your points relate. An infographic template shows it. A funnel says the group narrows, a cycle says the process repeats, a pyramid says each level rests on the one below, and a hub and spoke says everything connects to one center. Pick the shape that matches the idea, and the slide explains itself before you say a word.

Built from 9,000+ slides across 134+ categories

Every infographic sits in the same library as our charts, tables, timelines, and frameworks, so you can drop one into any presentation or swap one shape for another when the idea changes. Each type has its own page, so you can compare layouts before you pick one.

Brand the whole presentation in one click

Add your logo, colors, fonts, and background once. It applies to the whole presentation and the entire slide library at the same time. Infographics carry more color than most slides, so they’re where your brand shows most.

Export to PowerPoint, Google Slides, or Keynote

You get a real file, not a locked link. Export it and keep editing in the tool you already use. Shapes, labels, and icons stay editable, so you can change the wording, colors, and icons without redrawing anything.

Start from a template

Need a complete presentation instead?

If you're starting from nothing rather than fixing a few slides, open one of 74+ premade presentations instead. Each one is complete and built for one purpose, from pitch decks to business plans and company profiles.

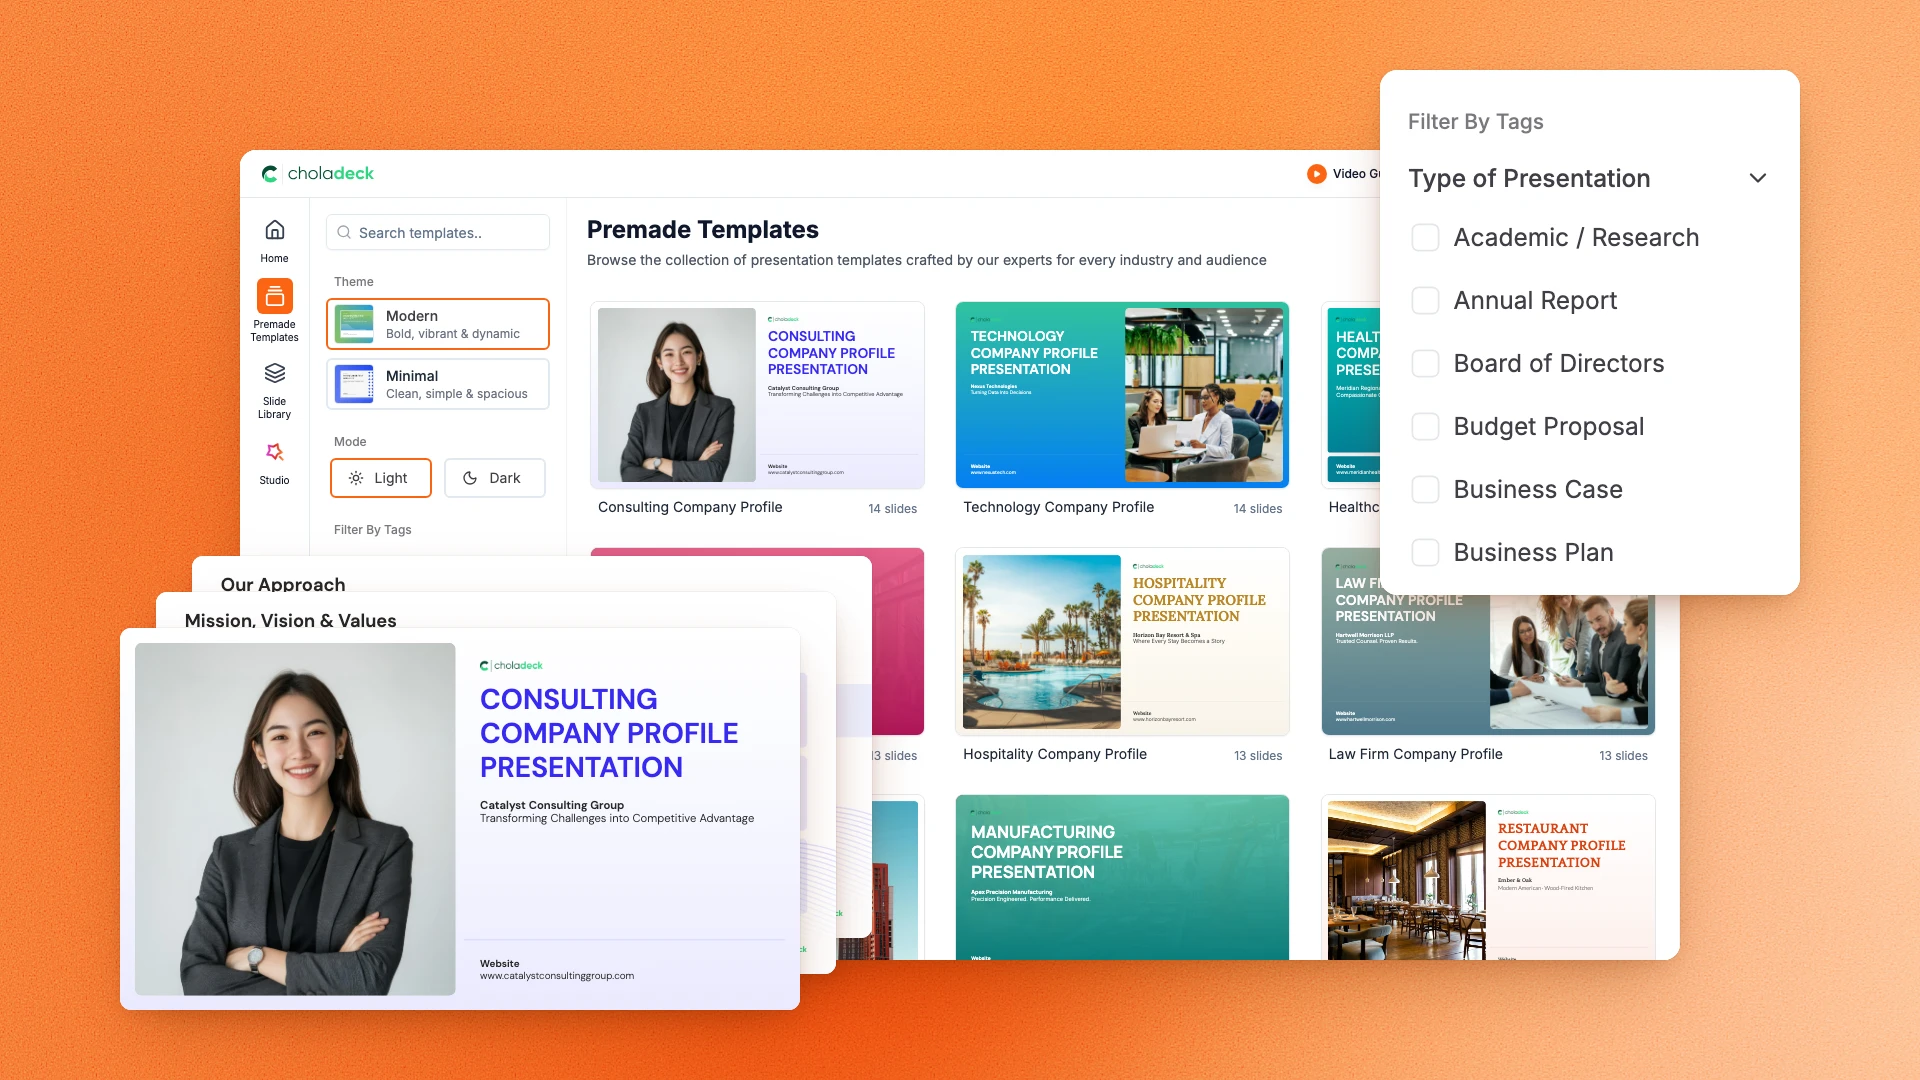
Choladeck premade templates with the Type of Presentation filter and the Consulting Company Profile deck shown larger

Questions about our infographic templates

How the slides work, and how far you can change them.

Using the infographics

Can I edit these infographics in PowerPoint?

+

Yes. Export to PowerPoint, Google Slides, or Keynote, and every shape, label, and icon stays editable. Nothing is locked and nothing is a flat image.
How do I brand them to my company?

+

Add your logo, colors, fonts, and background once. It applies to the whole presentation and the entire slide library at the same time.

Can I mix infographic types in one presentation?

+

Yes. Use a funnel for your pipeline, a cycle for your process, and a pyramid for your priorities in the same file. Branding applies across all of them, so they look like one set.

About infographics

What is an infographic presentation?

+

A presentation that uses shapes and icons to show how information fits together, instead of relying on bullet points. Infographic slides make the structure visible: steps, levels, parts of a whole, or cause and effect.

Which infographic should I use?

+

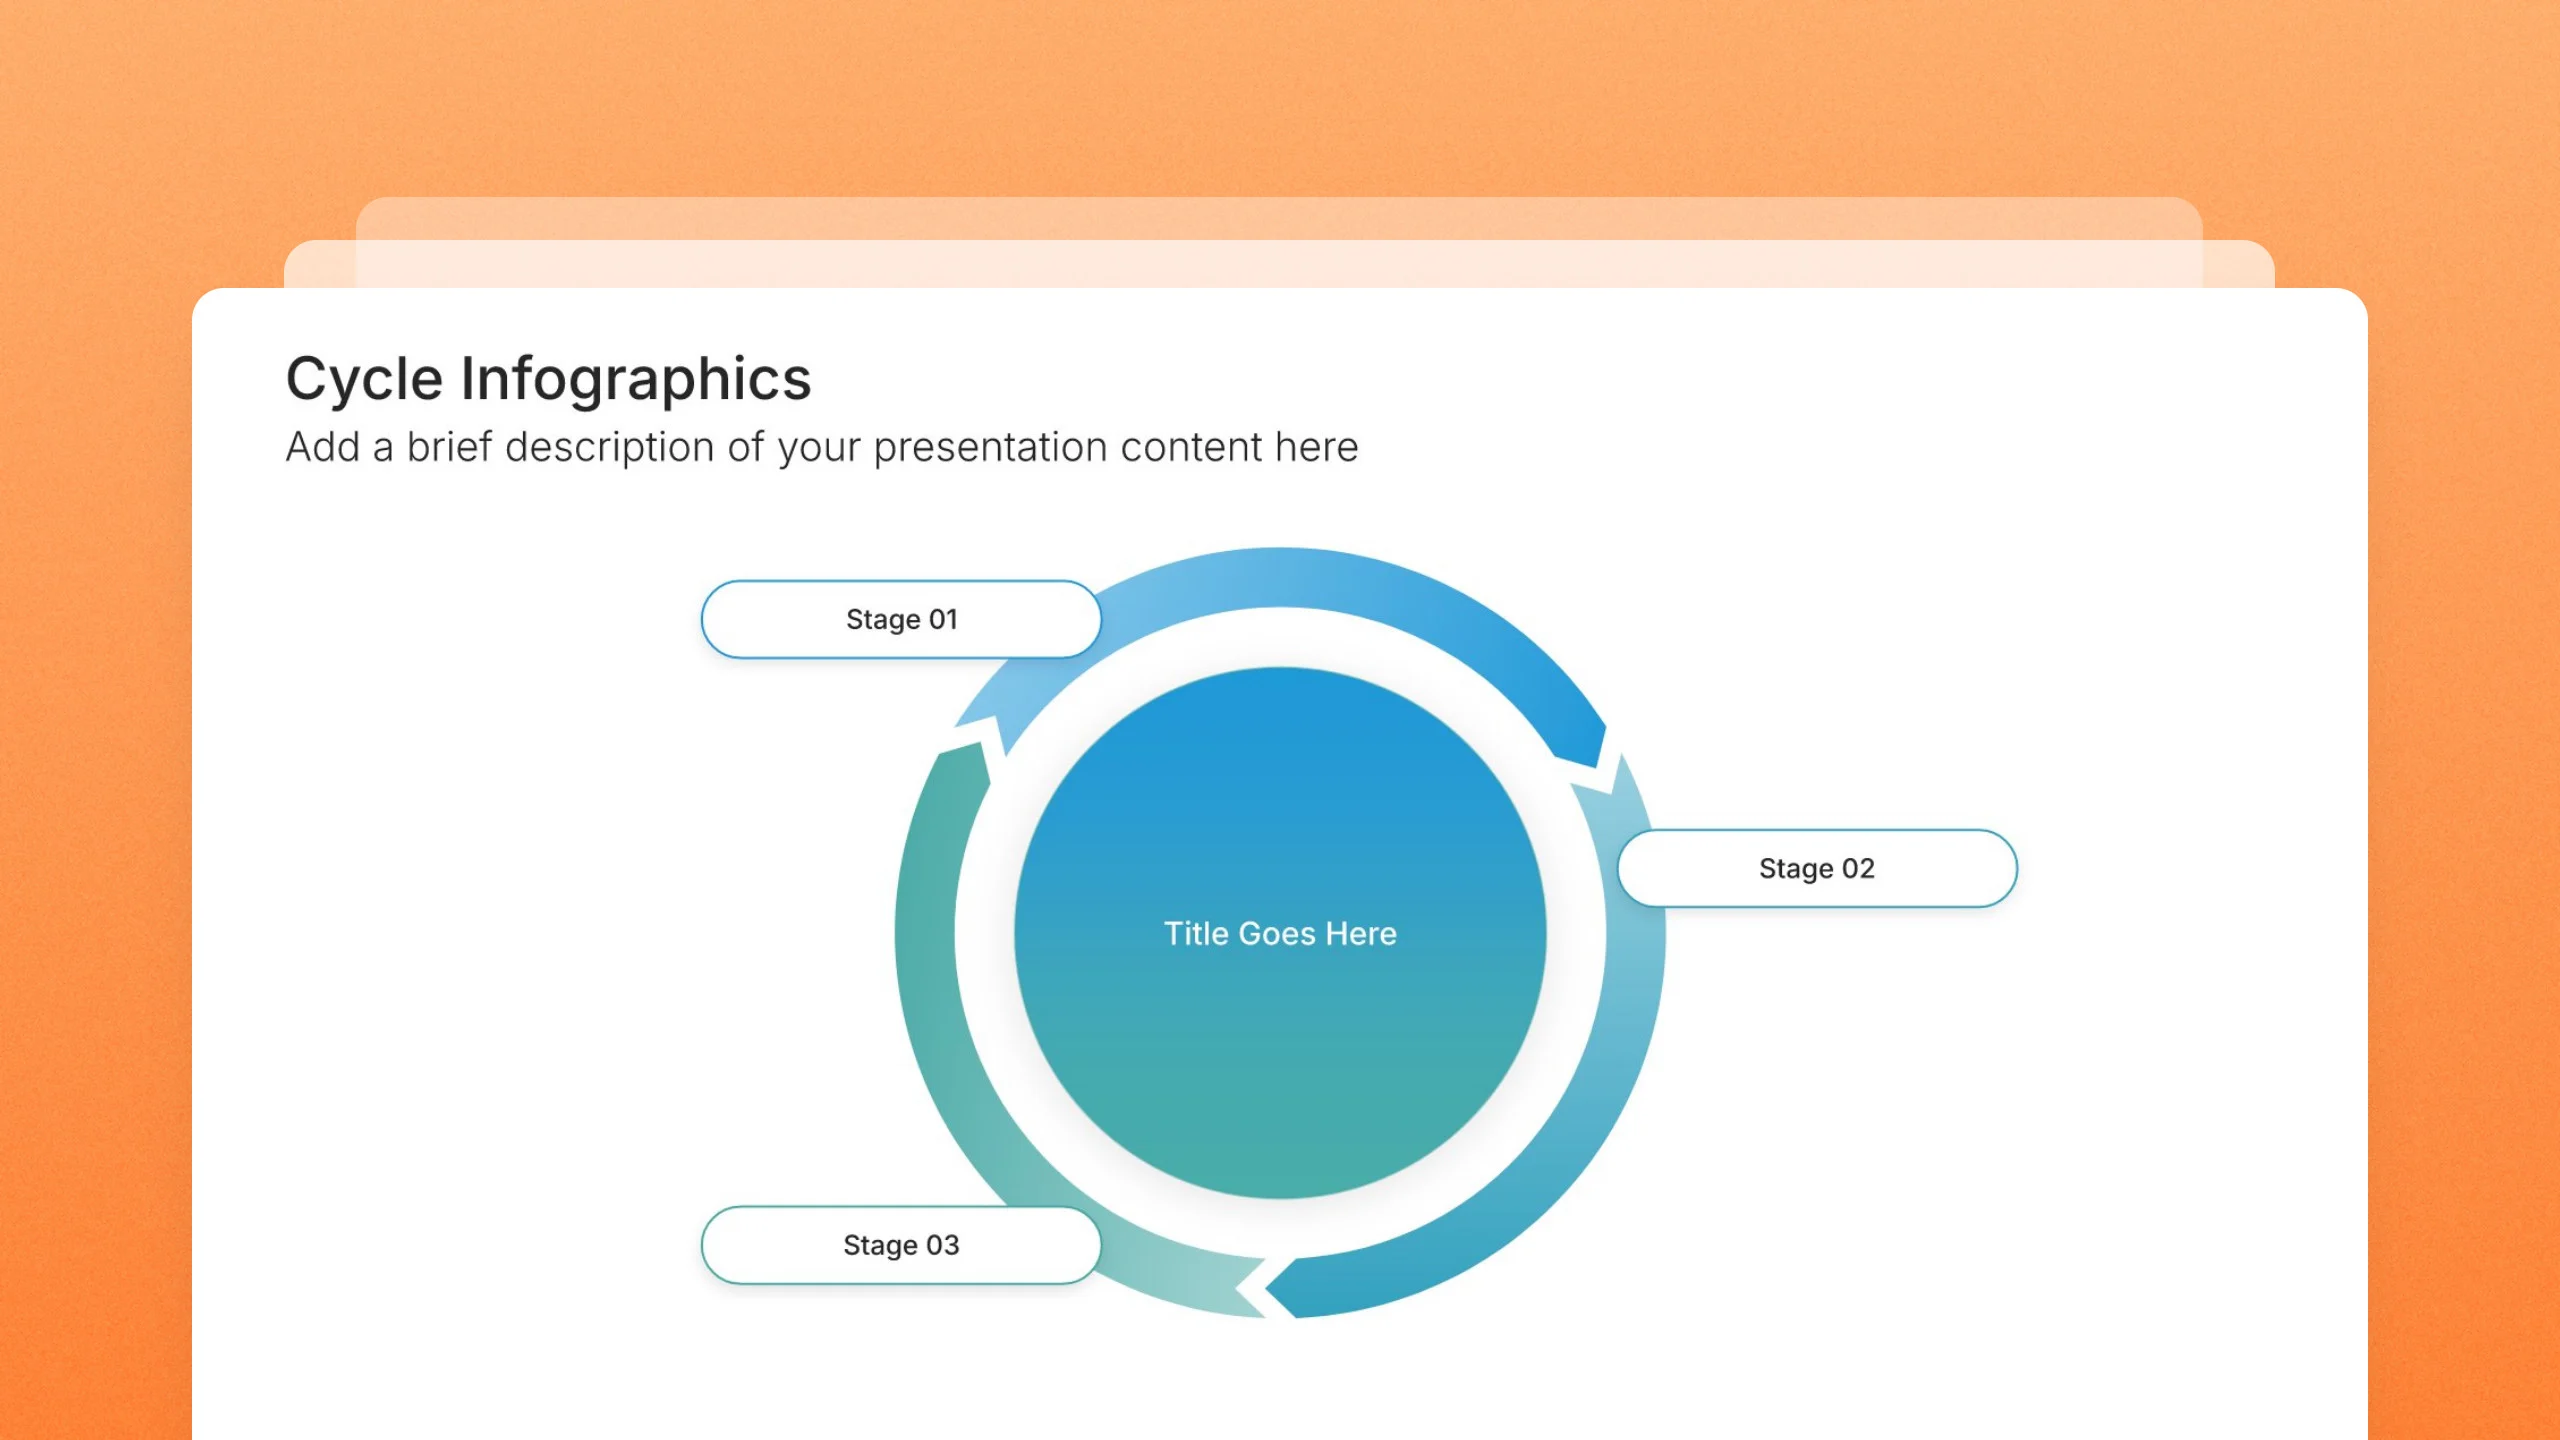
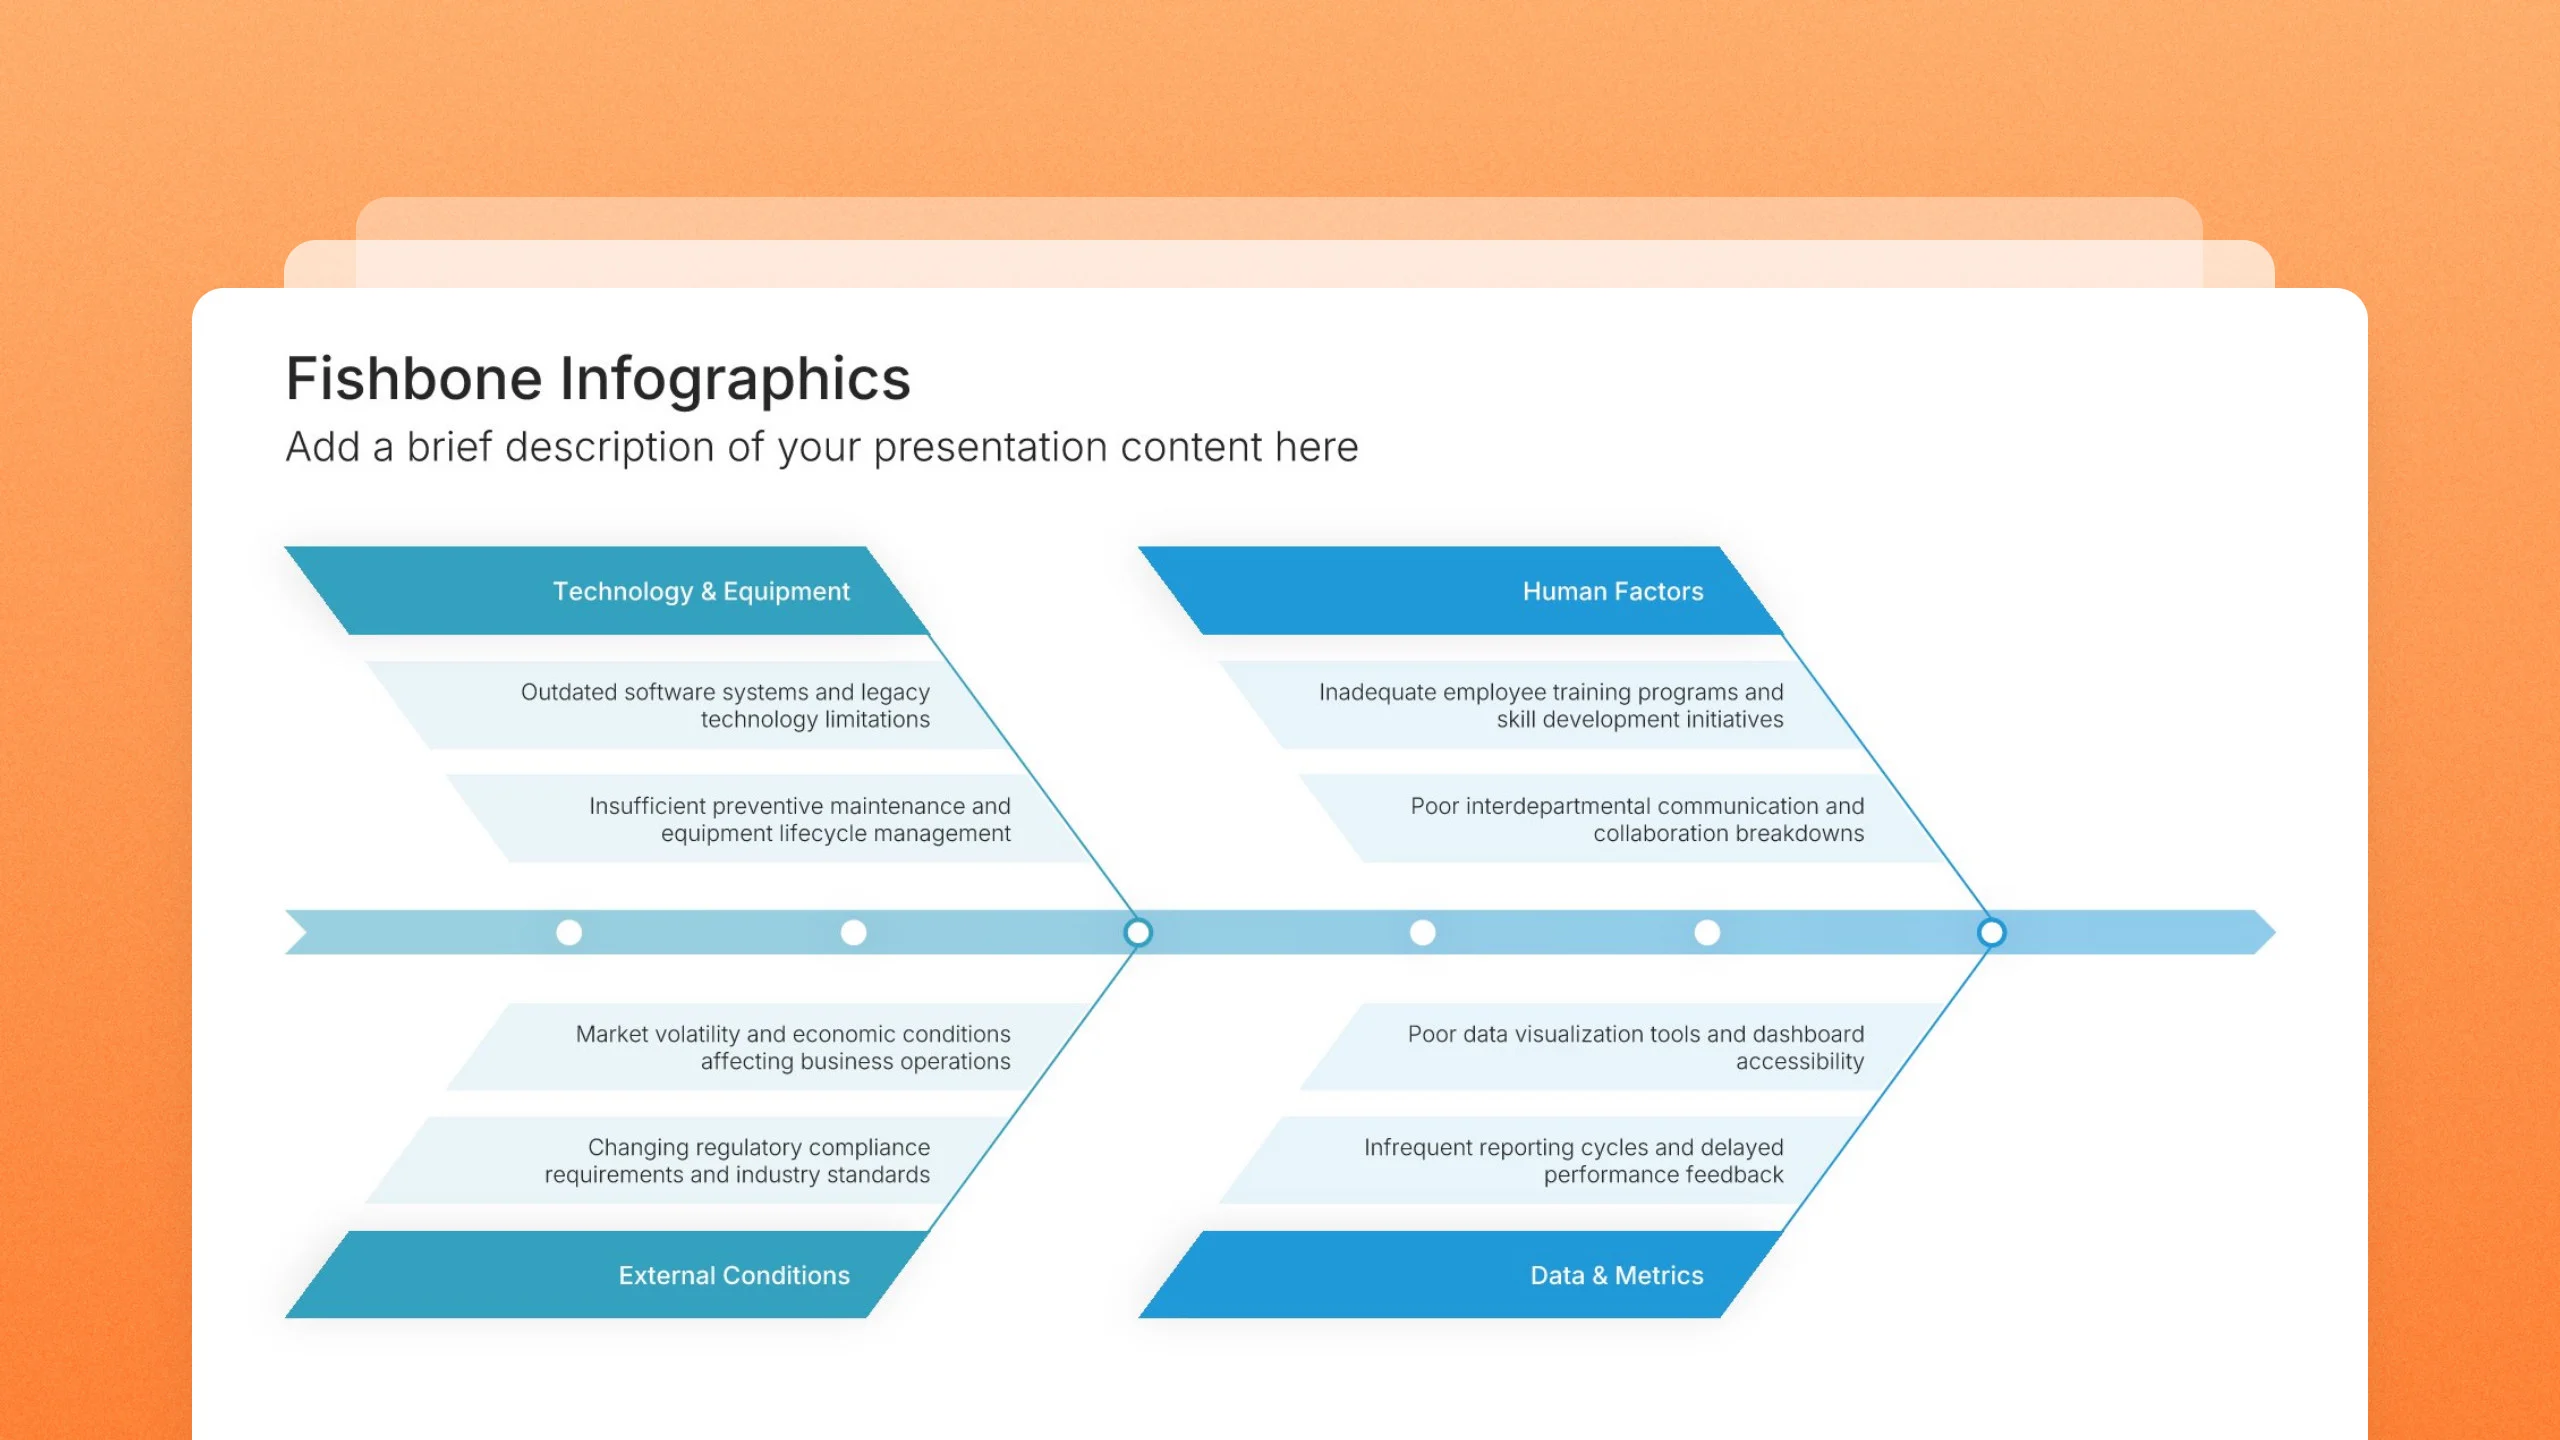
Match the shape to the idea. Use a funnel for something that narrows, a cycle for something that repeats, a pyramid for a hierarchy, a hub and spoke for one center with many parts, and a fishbone for the causes behind a problem.

What's the difference between an infographic and a chart?

+

A chart plots numbers. An infographic shows how ideas relate. Use a chart when the numbers are the point, and an infographic when the structure is.

Your next infographic slide is already designed

Pick a layout, brand it in one click, add your content, and export.

Free to start. No credit card required.