Pricing

Quarterly financial report template

Twelve slides covering what happened in the quarter, what it means, how it tracked against plan, and what the next quarter looks like. Select it, brand it to your company in one click, add your figures, and export to PowerPoint, Google Slides, or Keynote.

Free to start. No credit card required.
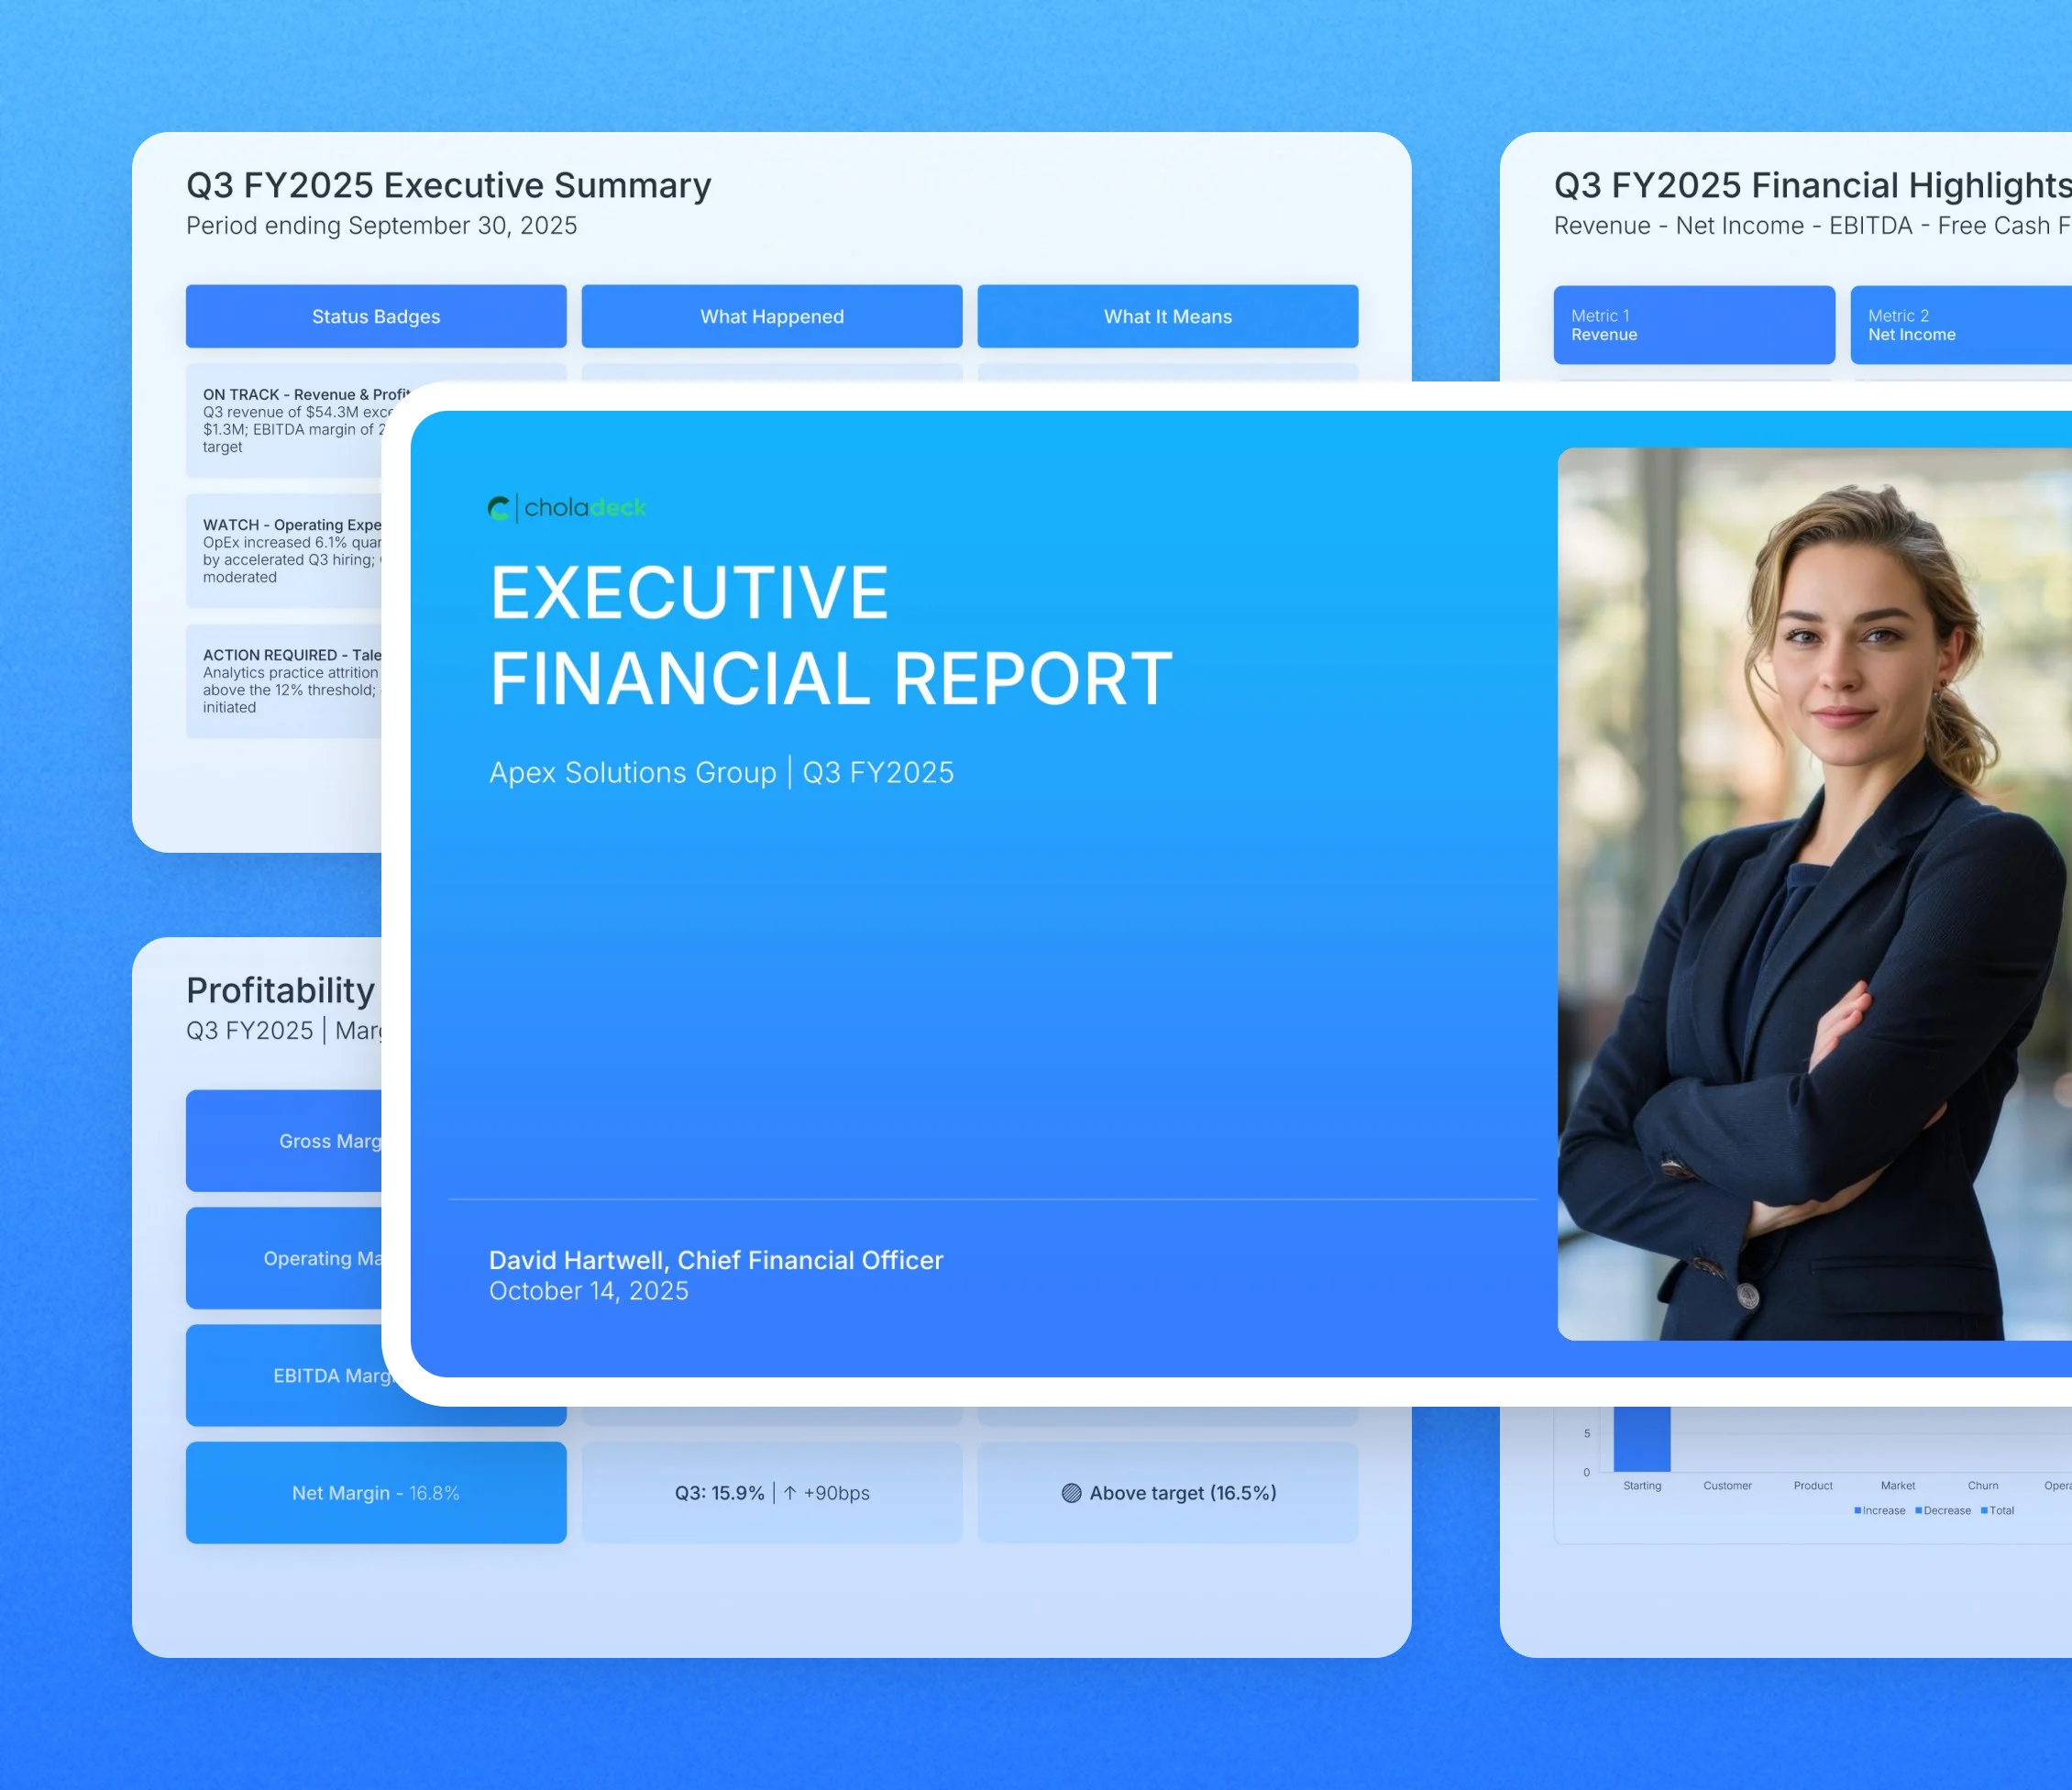
Quarterly financial report template: the title slide in front of other slides from the 12-slide deck

Every slide in the quarterly financial report template

Twelve slides, in the order you present them.

Title slide, quarterly financial report template, company name and period ending date

Slide 01

Title

Company name, the quarter, and the period ending date.

Built using “Title” slide
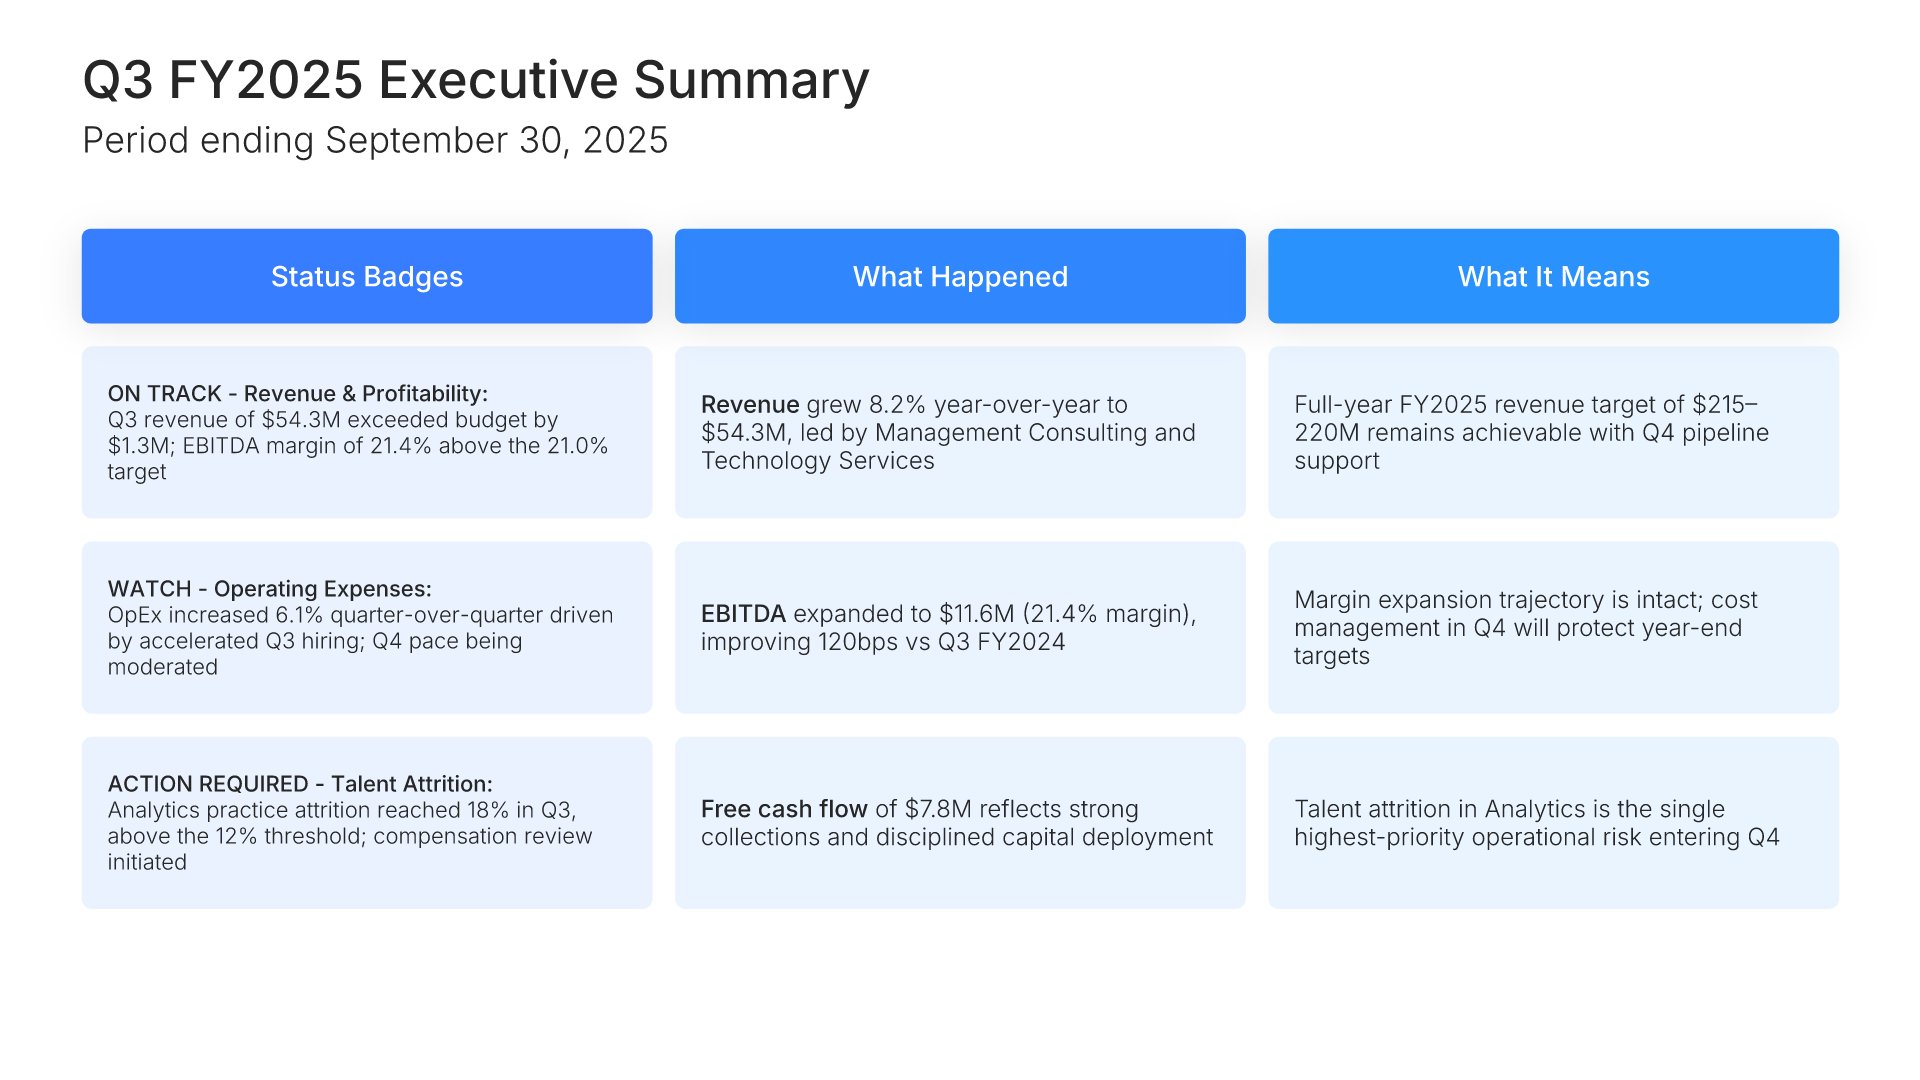
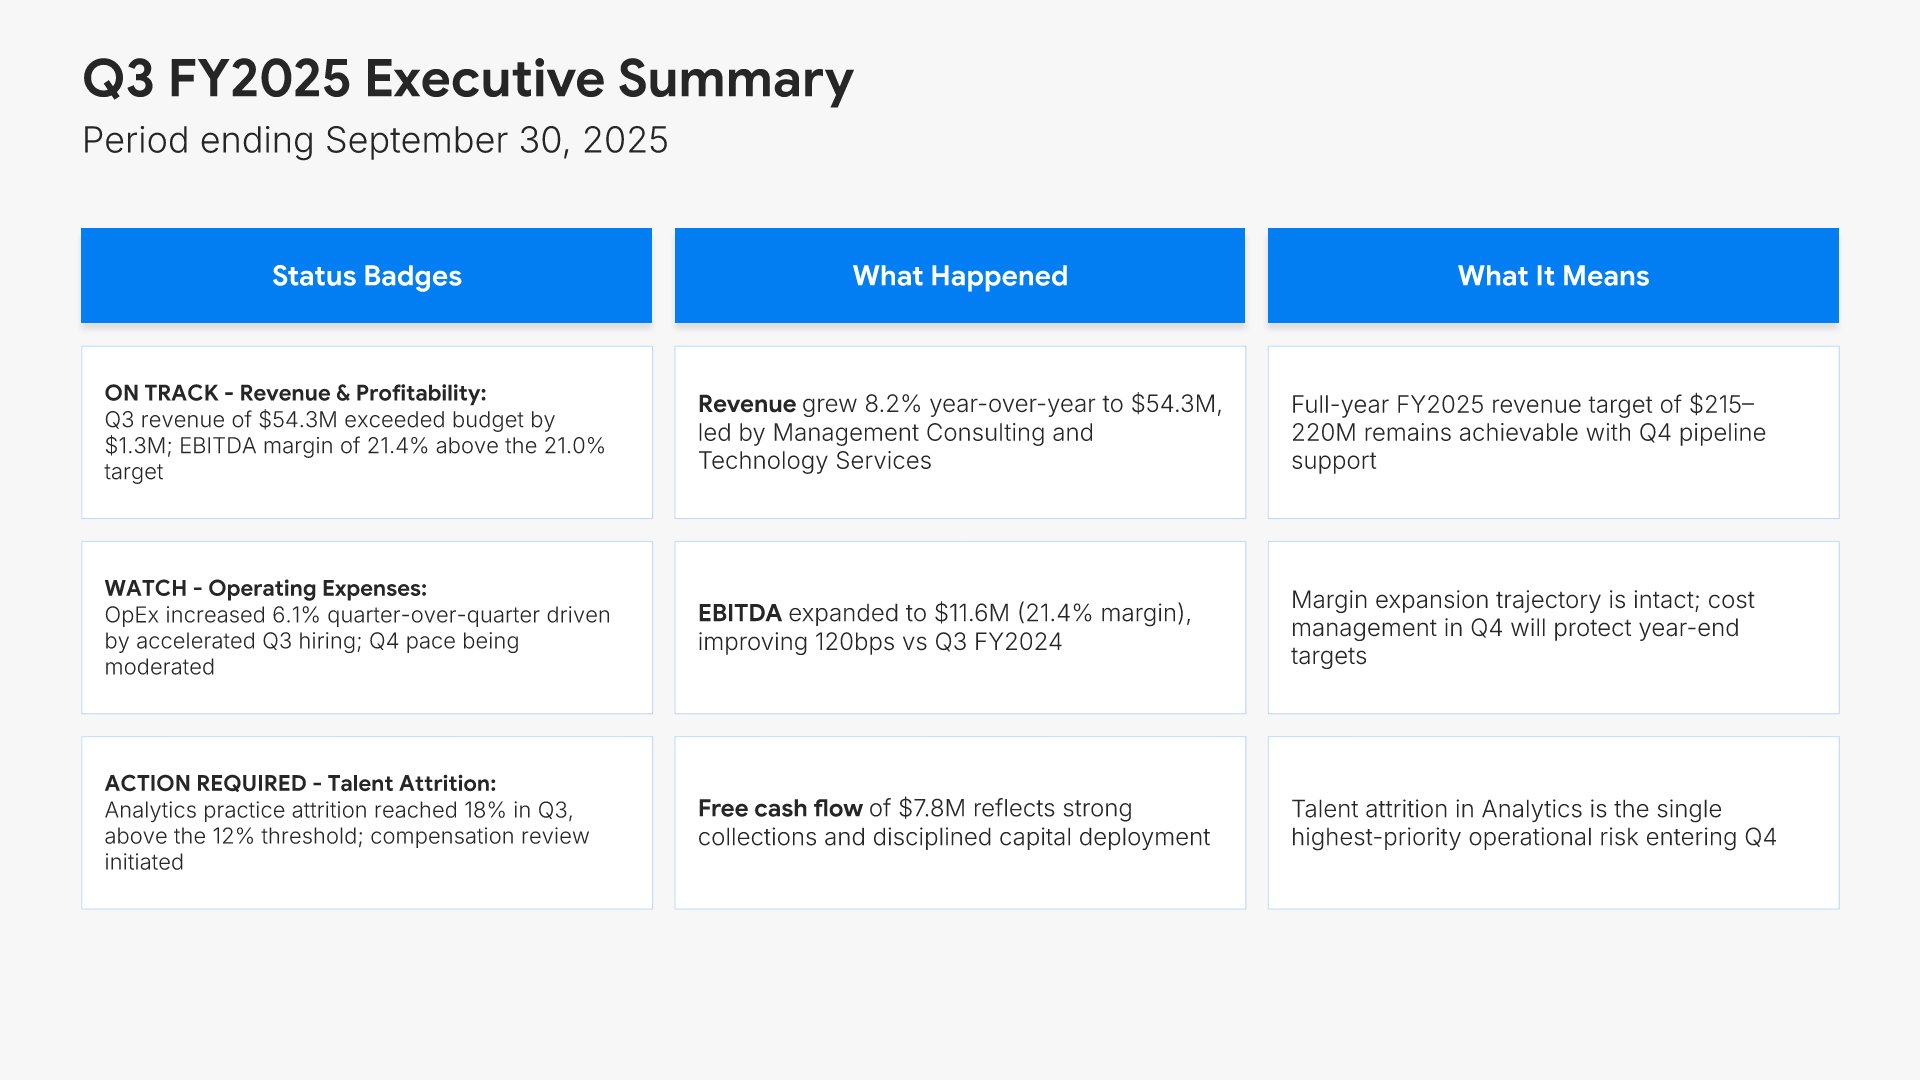
Executive summary slide, quarterly financial report template, the quarter in three columns

Slide 02

Executive Summary

The quarter in three columns: sales and margin, what happened, and what it means.

Built using “One Pager / Snapshot” slide
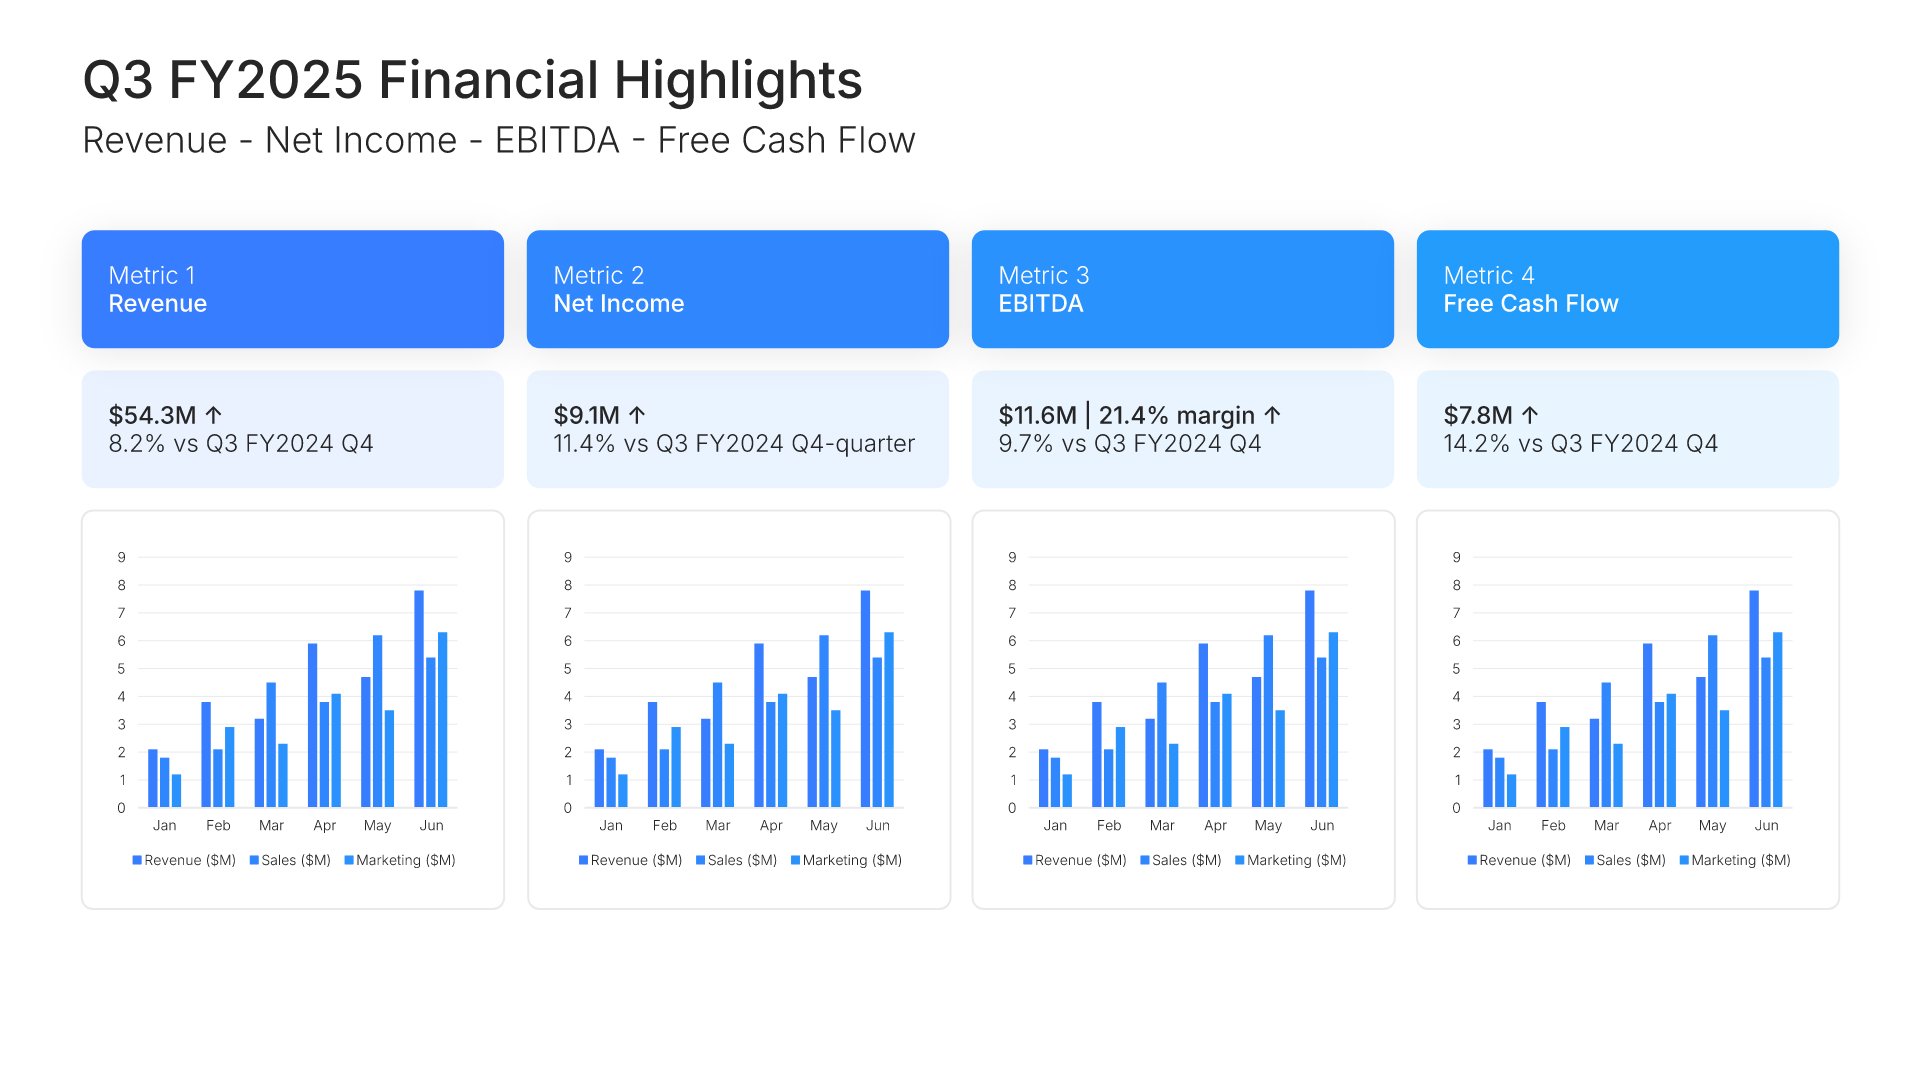
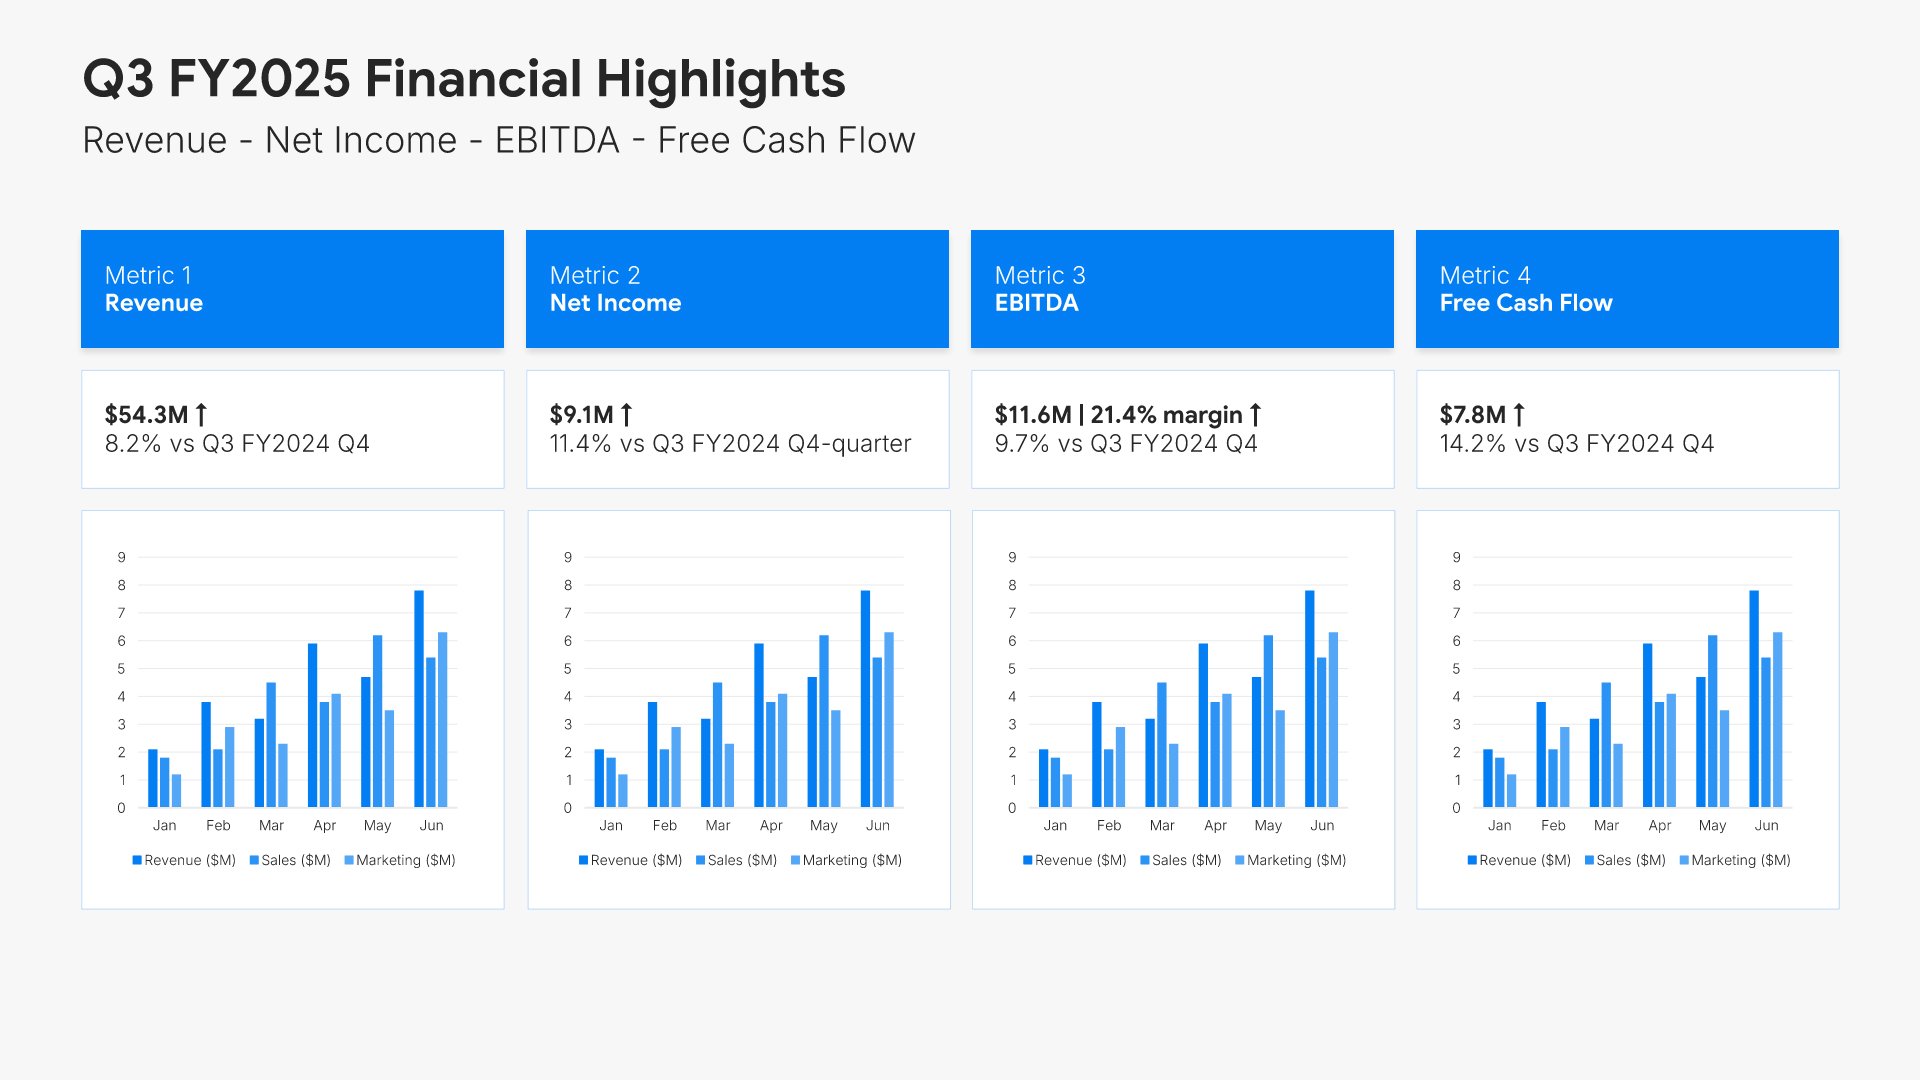
Financial highlights slide, quarterly financial report template, revenue, net income, and free cash flow

Slide 03

Financial Highlights

Revenue, net income, and free cash flow, each charted against prior quarters.

Built using “KPI Dashboard” slide
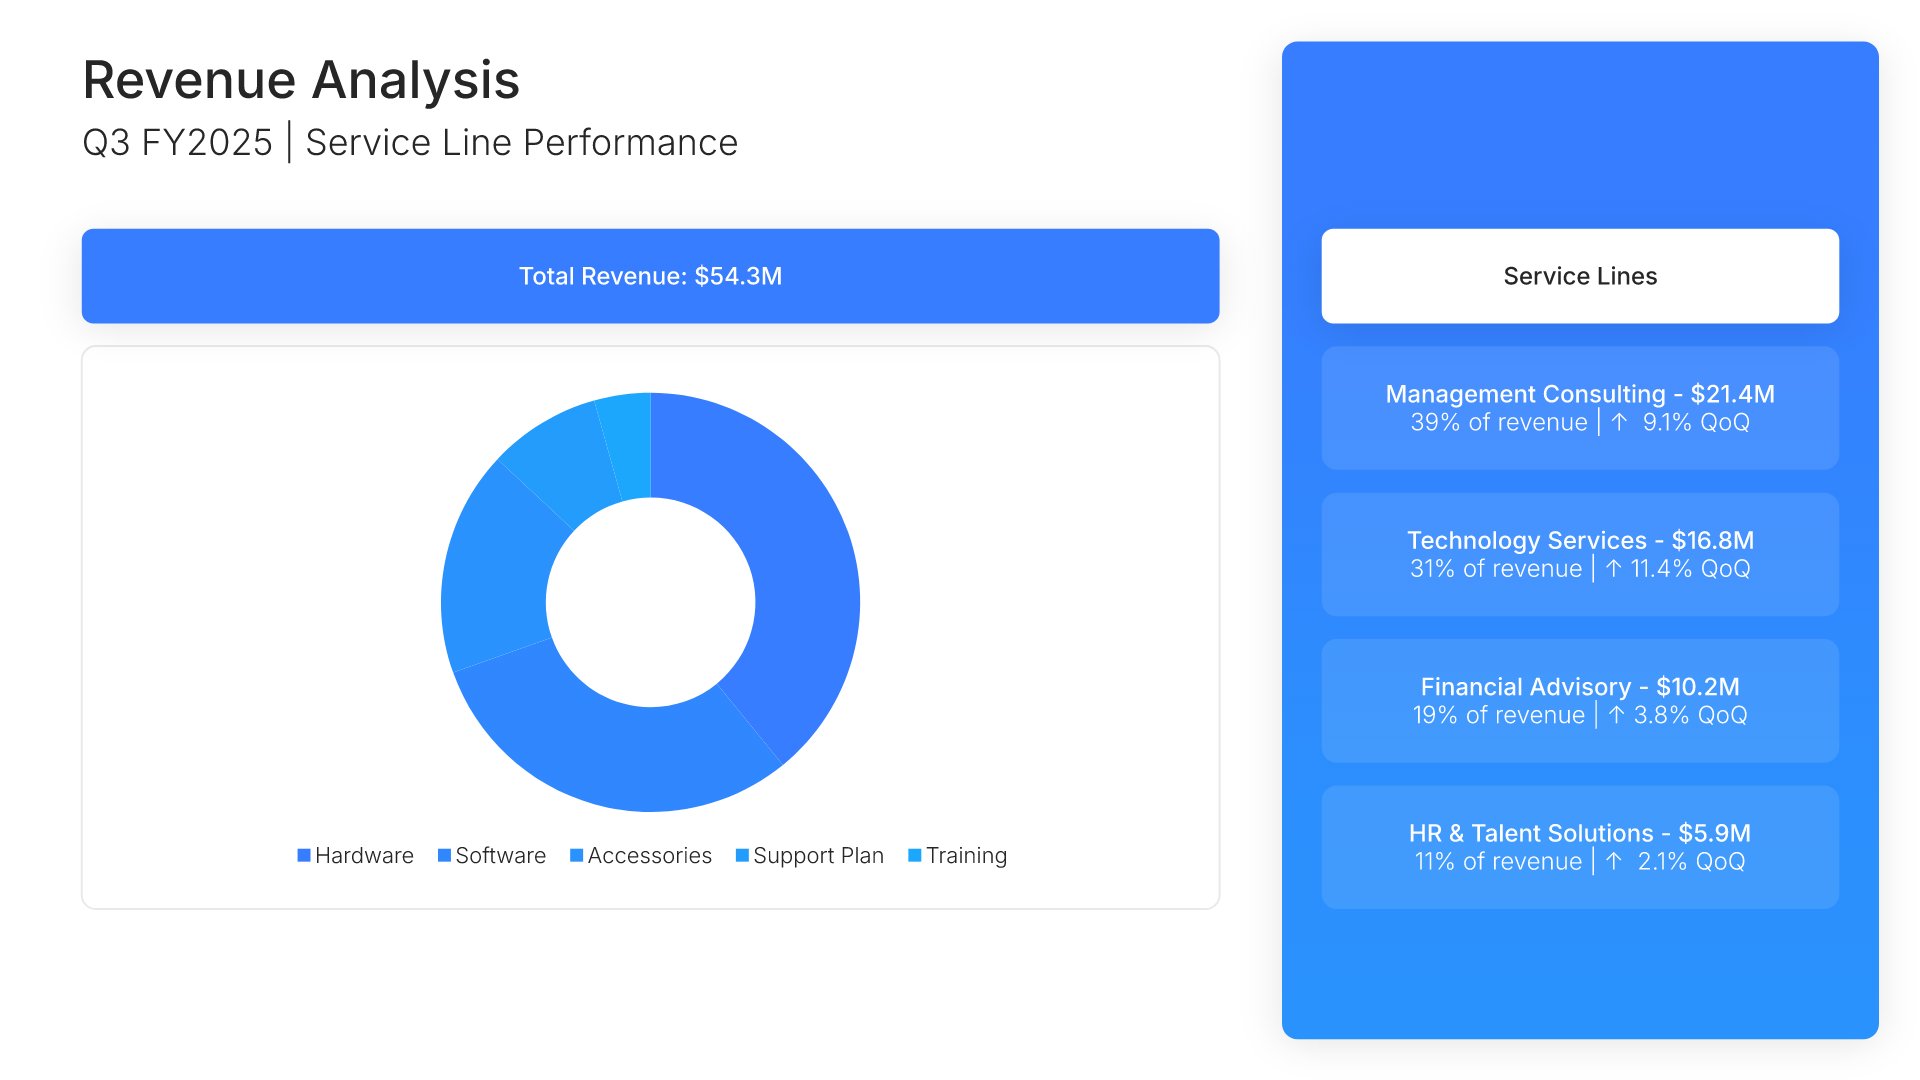
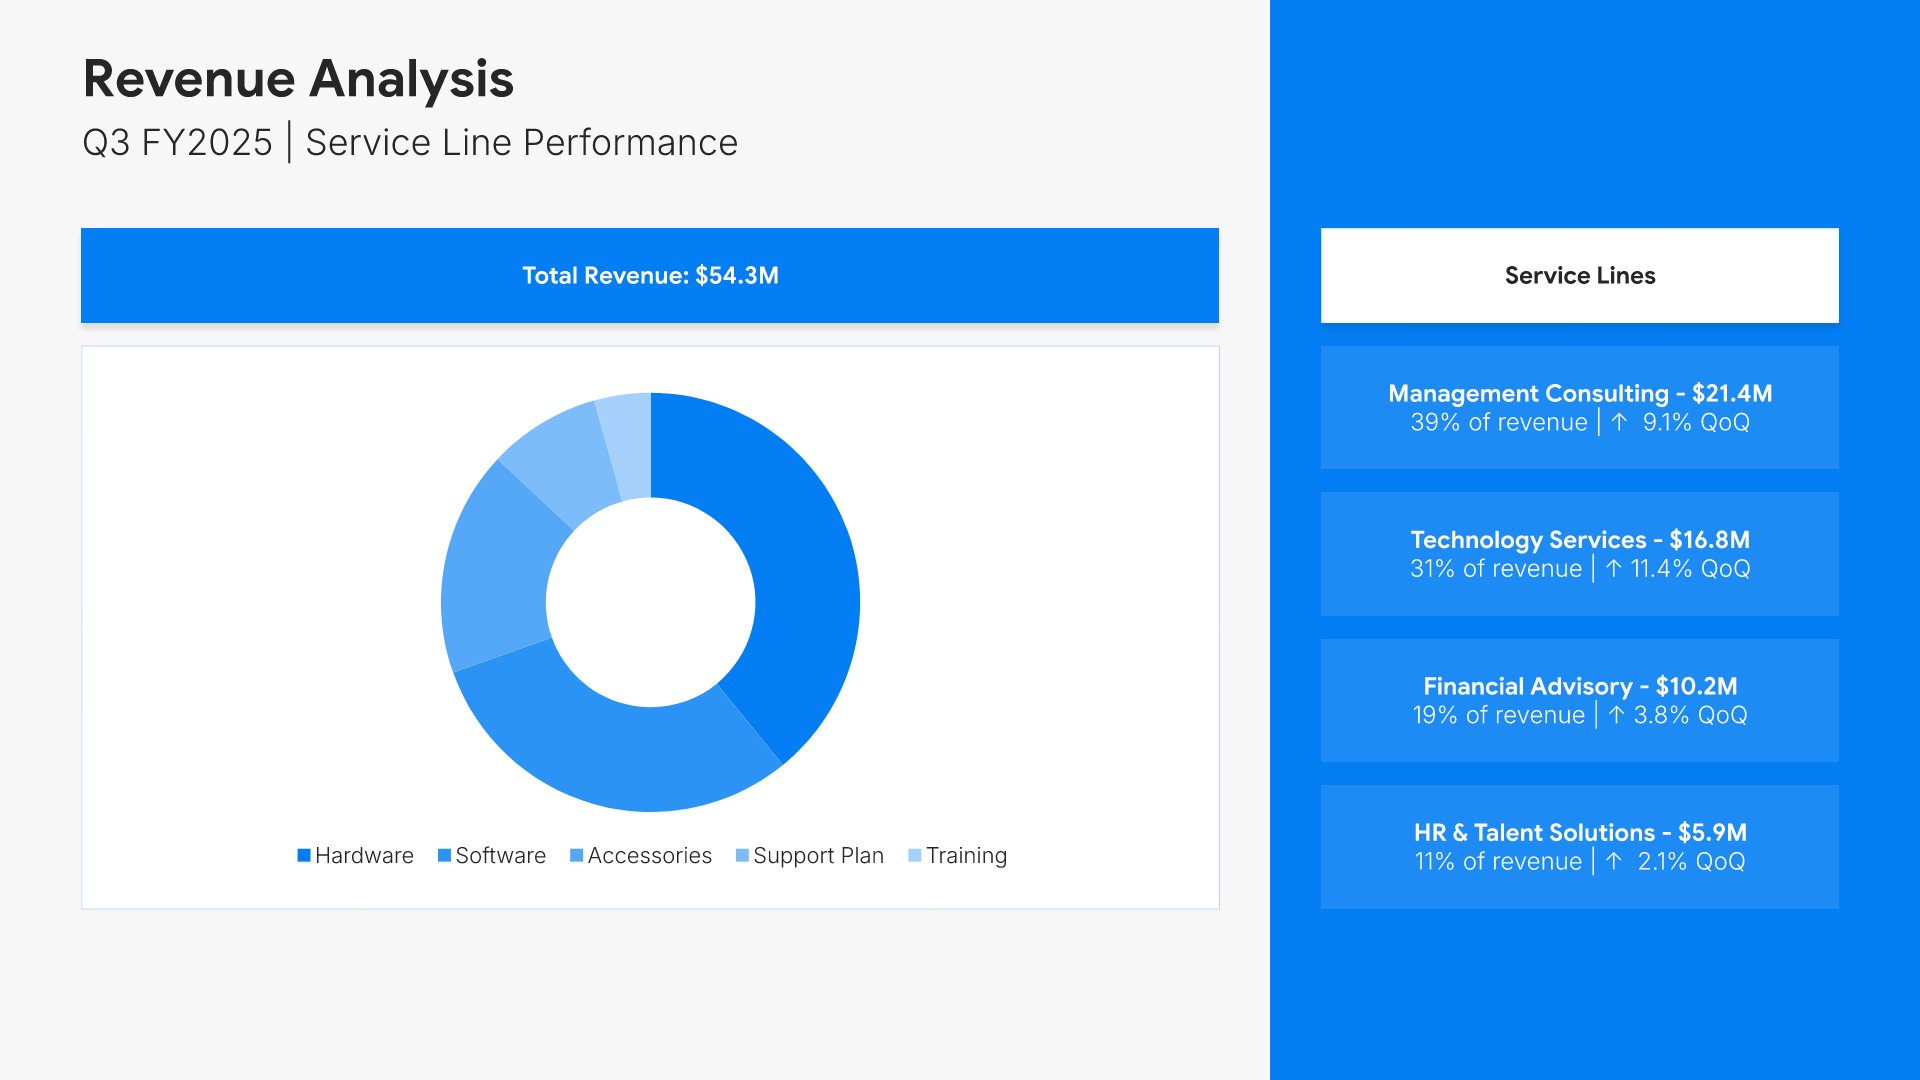
Revenue analysis slide, quarterly financial report template, revenue by service line on a donut

Slide 04

Revenue Analysis

Revenue by service line on a donut, with each line's total beside it.

Built using “Charts” slide
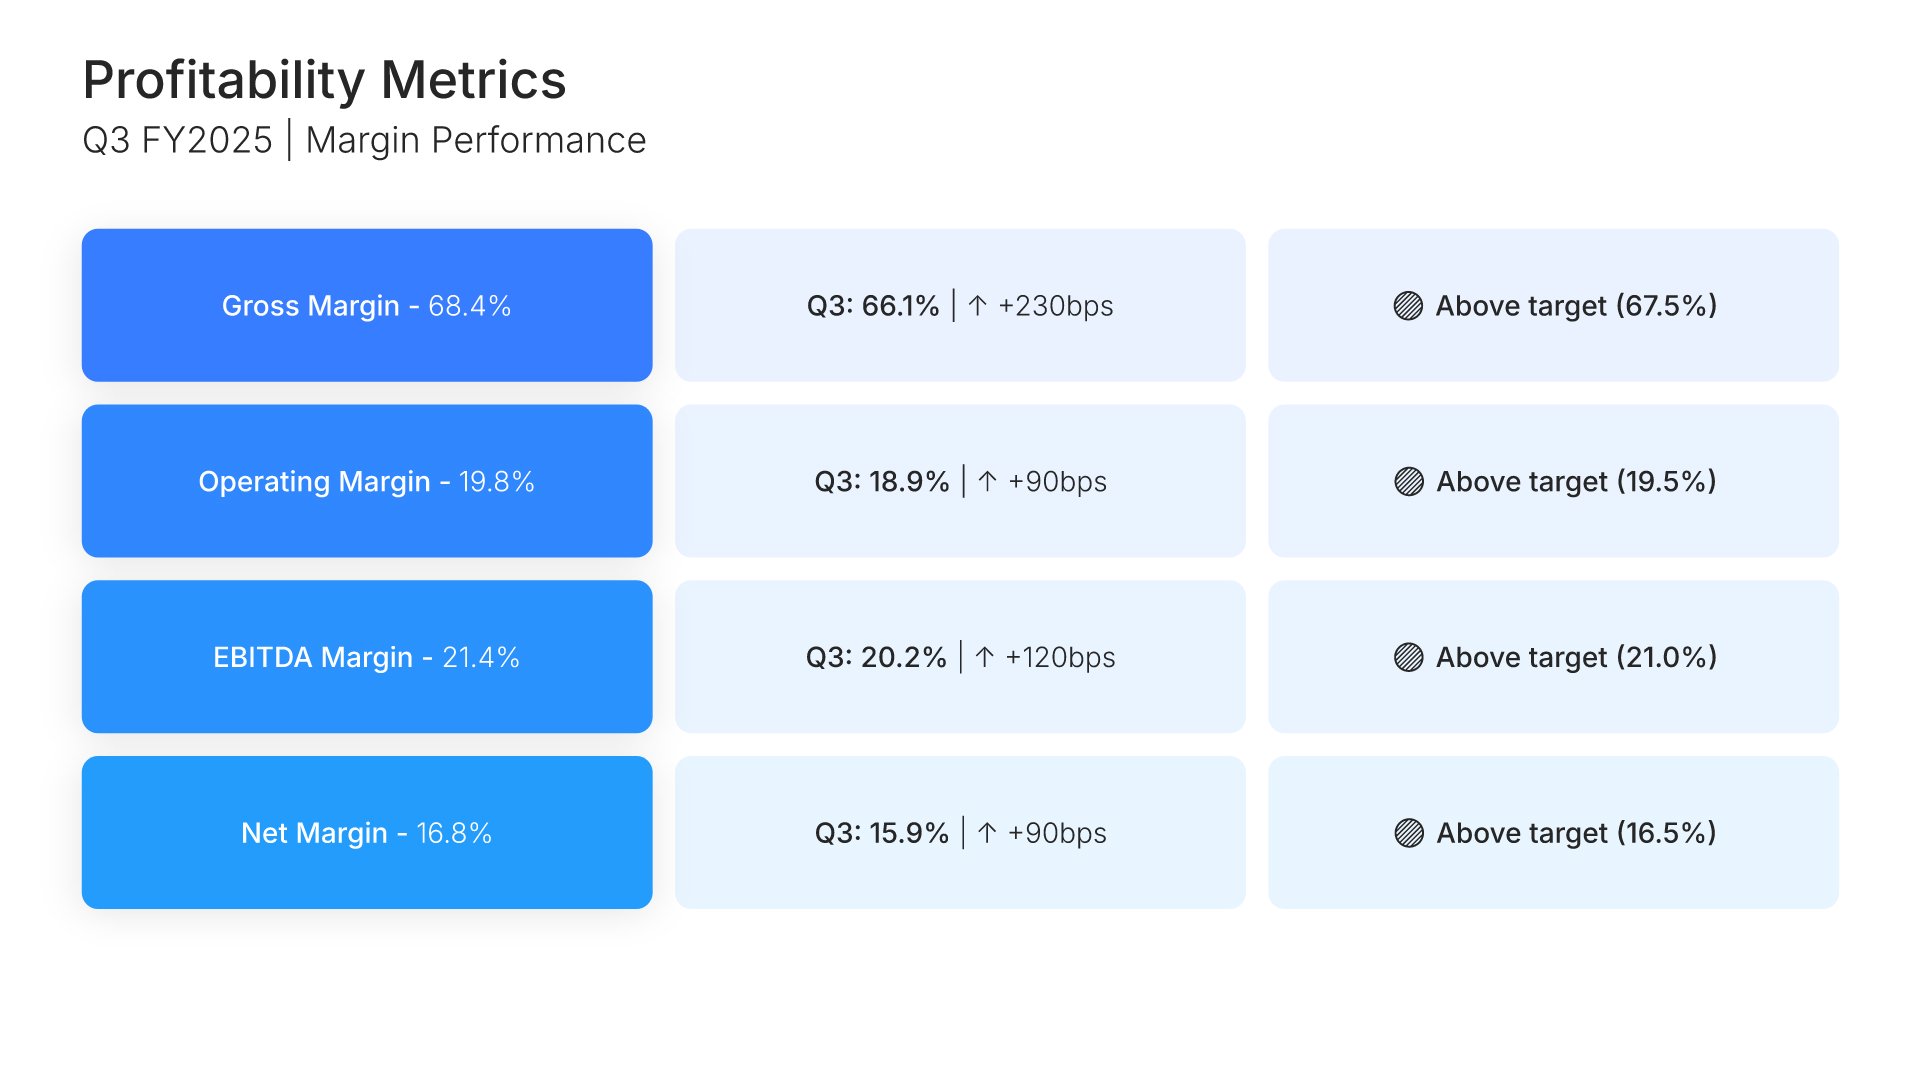
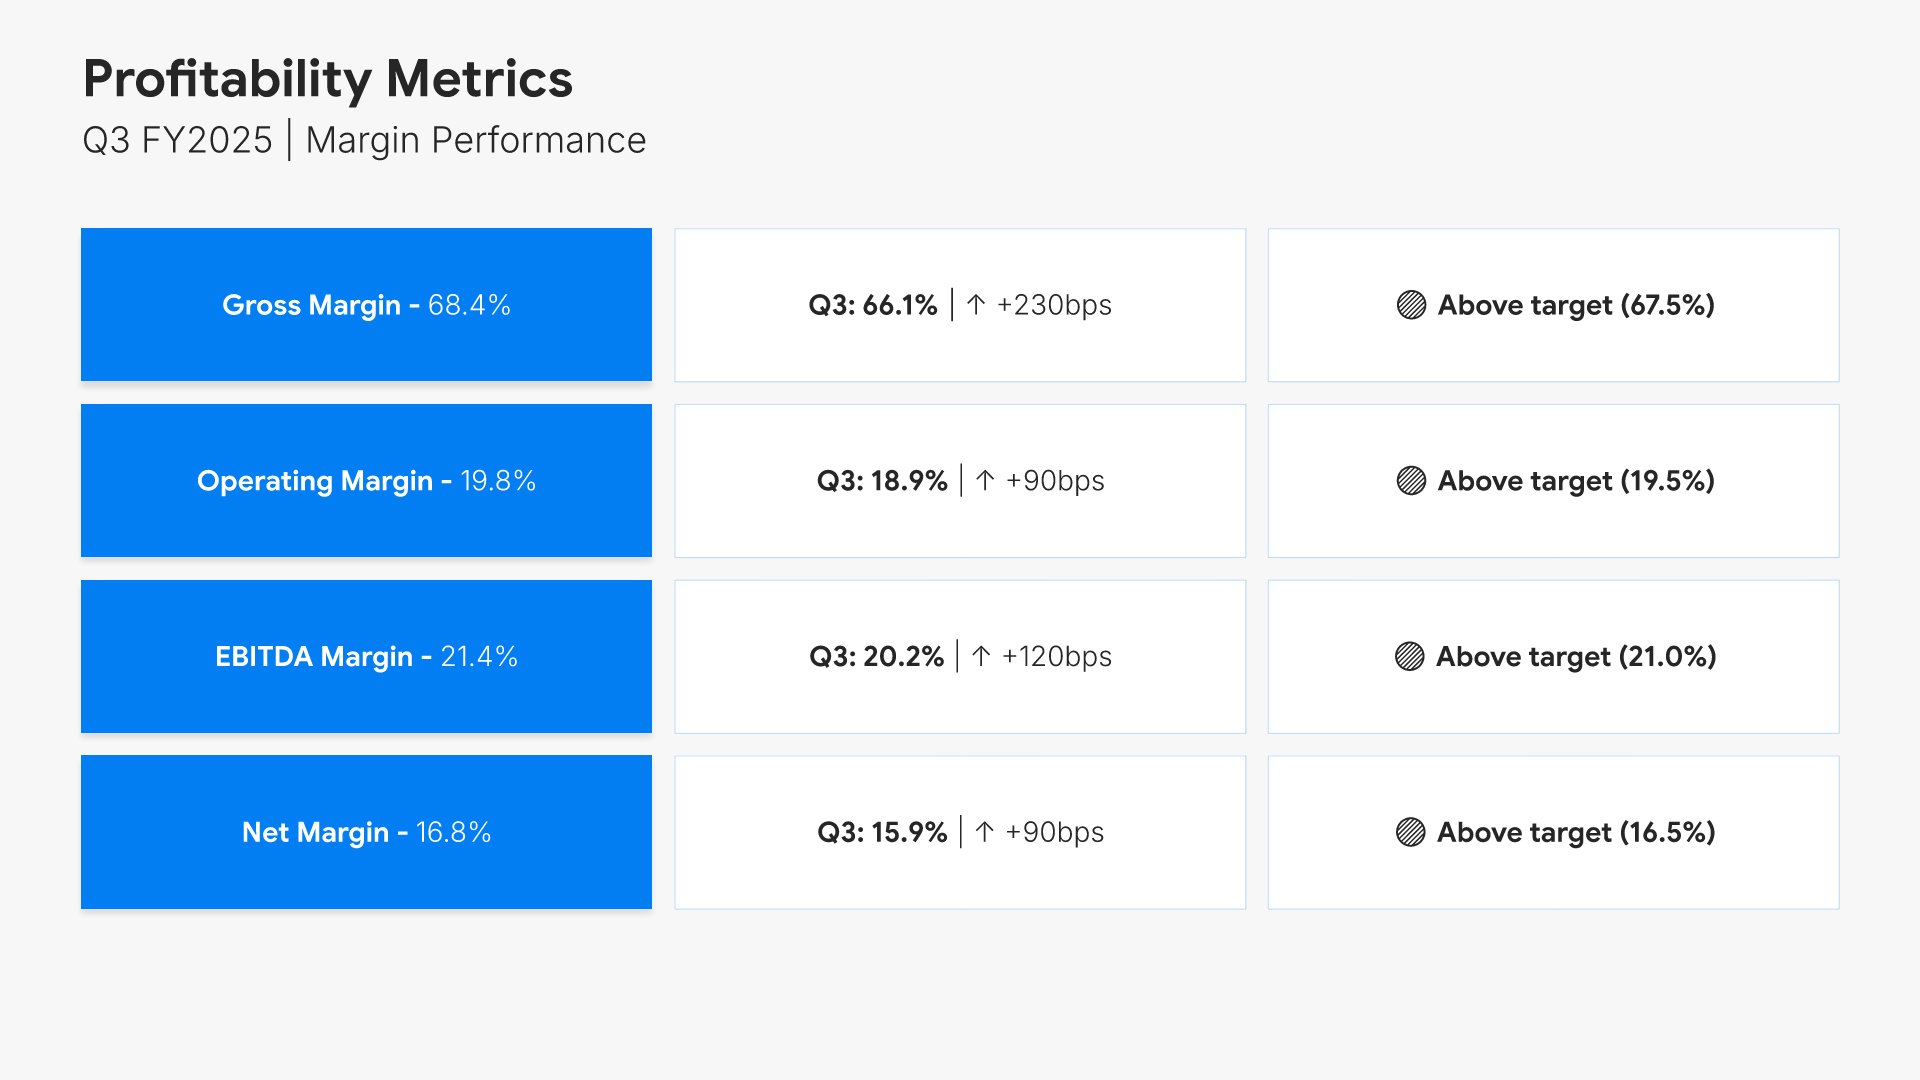
Profitability metrics slide, quarterly financial report template, margins against target with variance

Slide 05

Profitability Metrics

Gross, operating, EBITDA, and net margin, each against target with the variance.

Built using “Table” slide
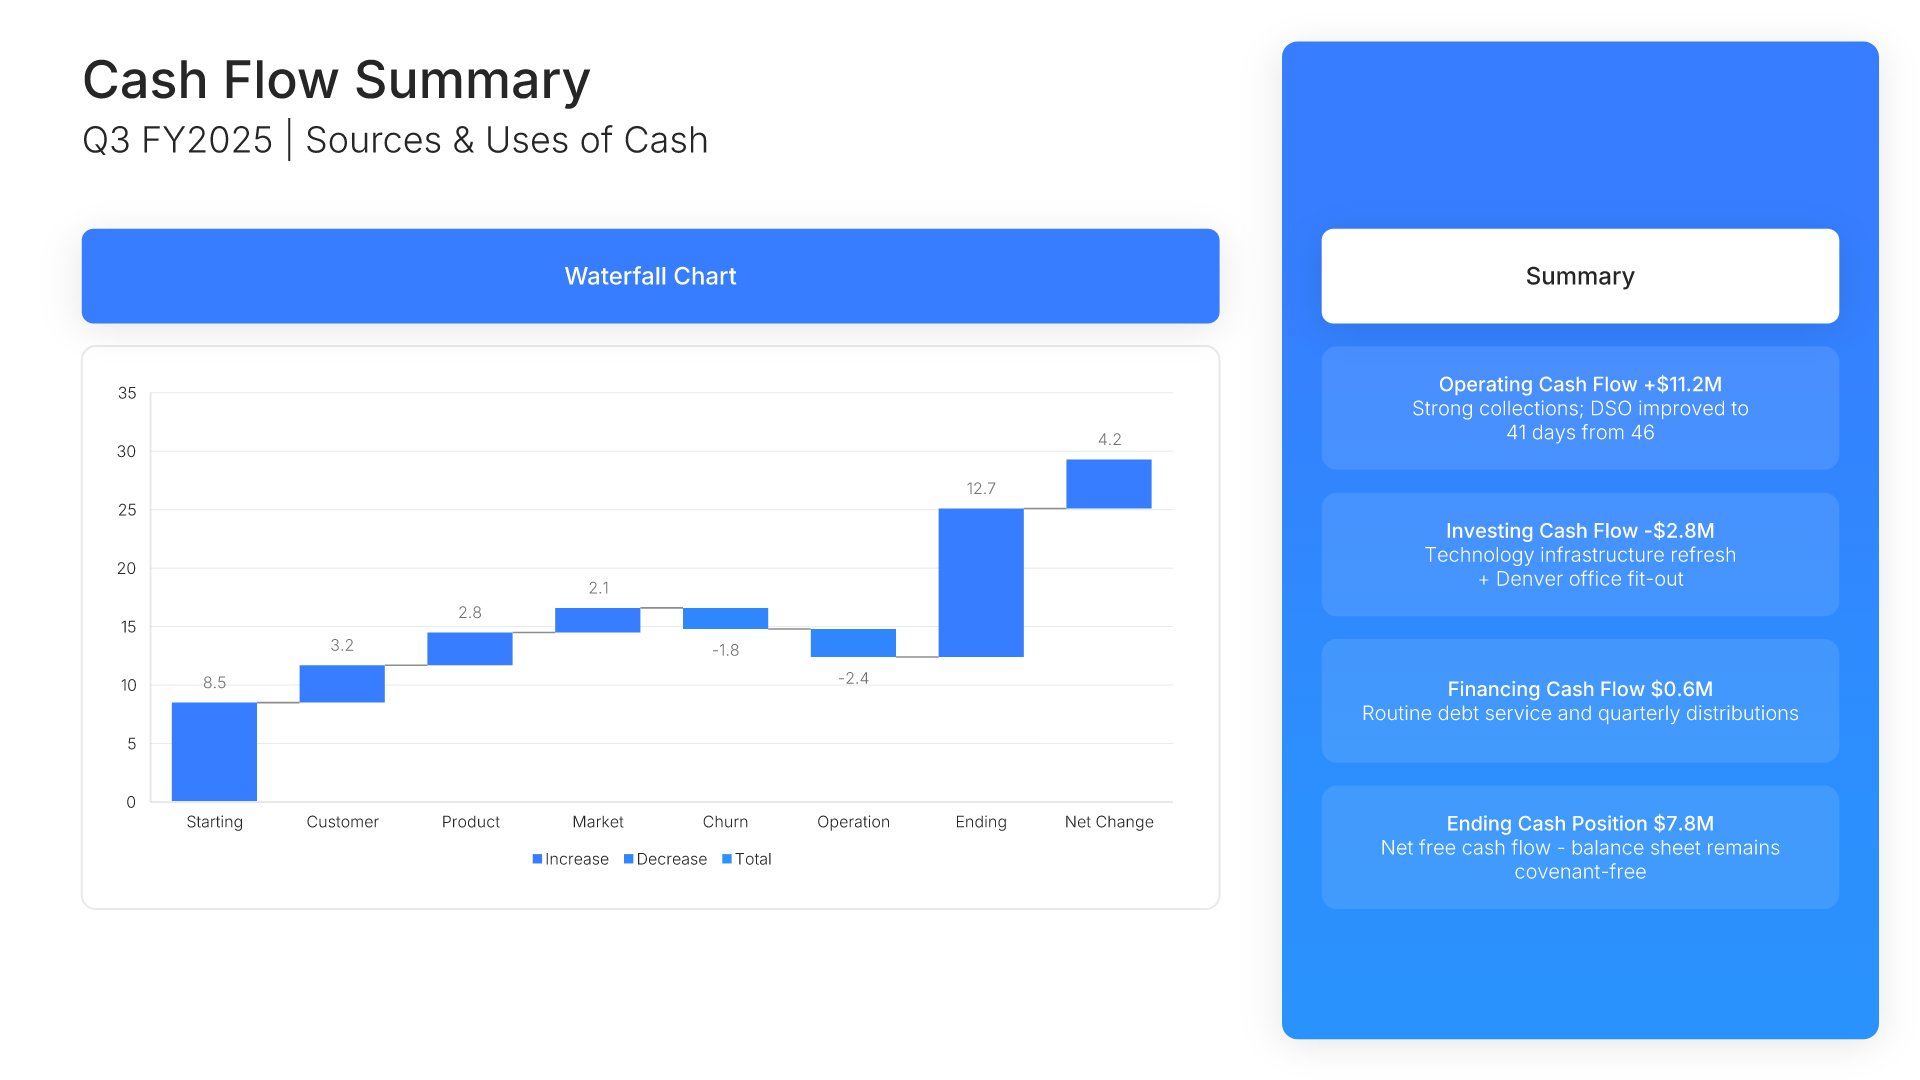
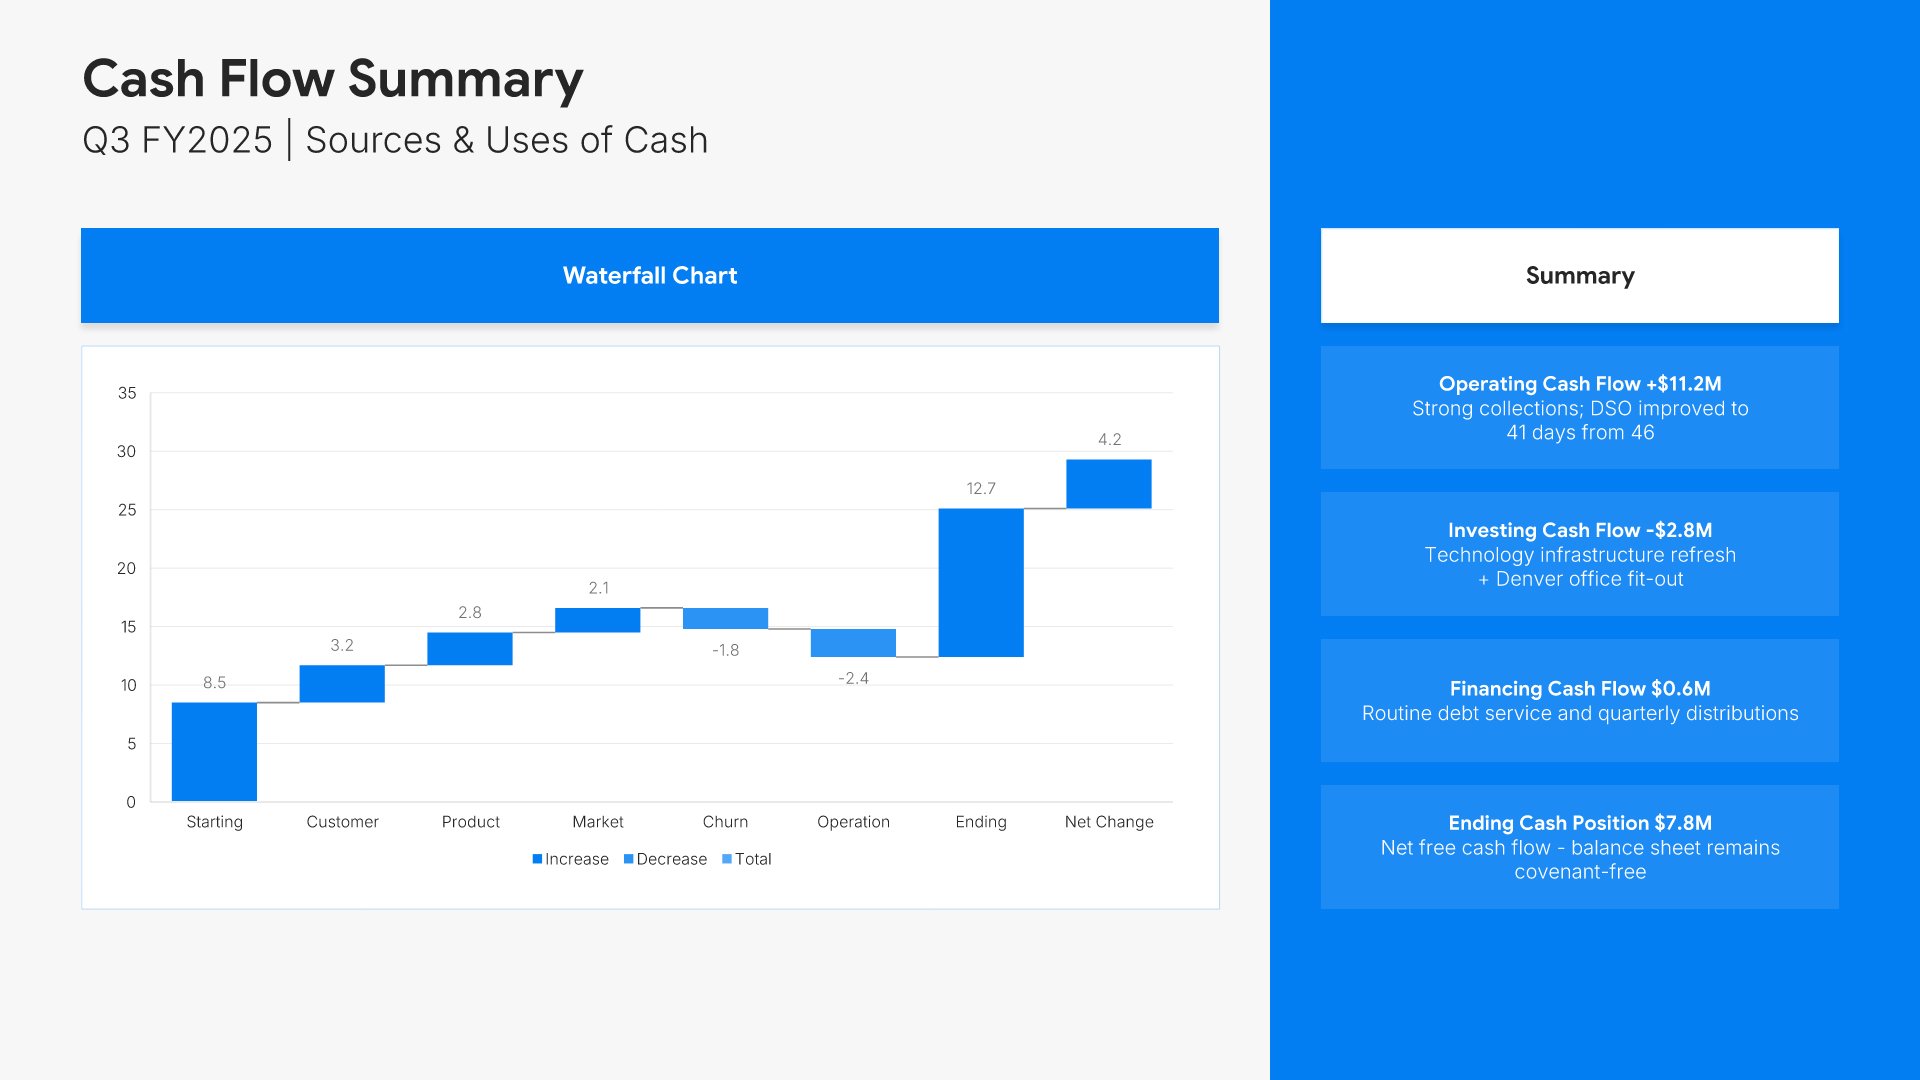
Cash flow statement slide, quarterly financial report template, sources and uses as a waterfall

Slide 06

Cash Flow Statement

Sources and uses as a waterfall, with the summary alongside.

Built using “Charts” slide
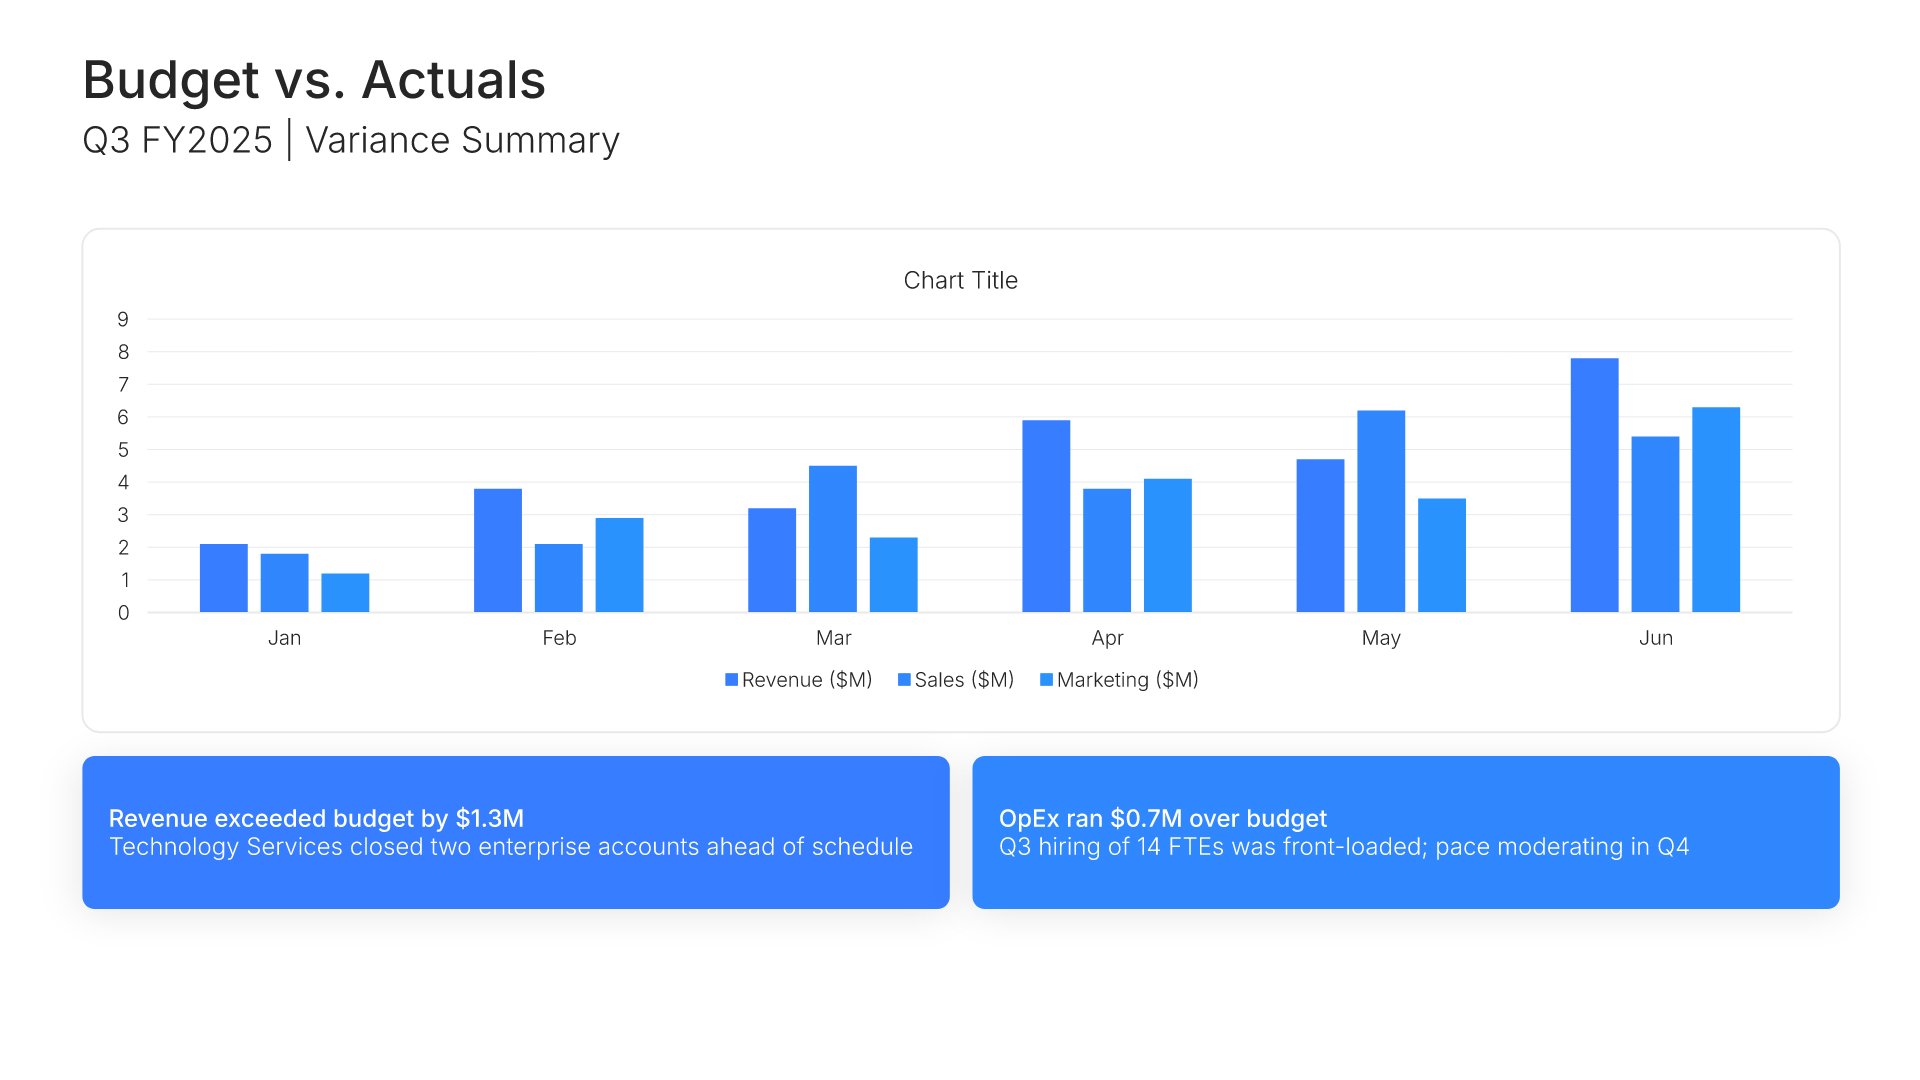
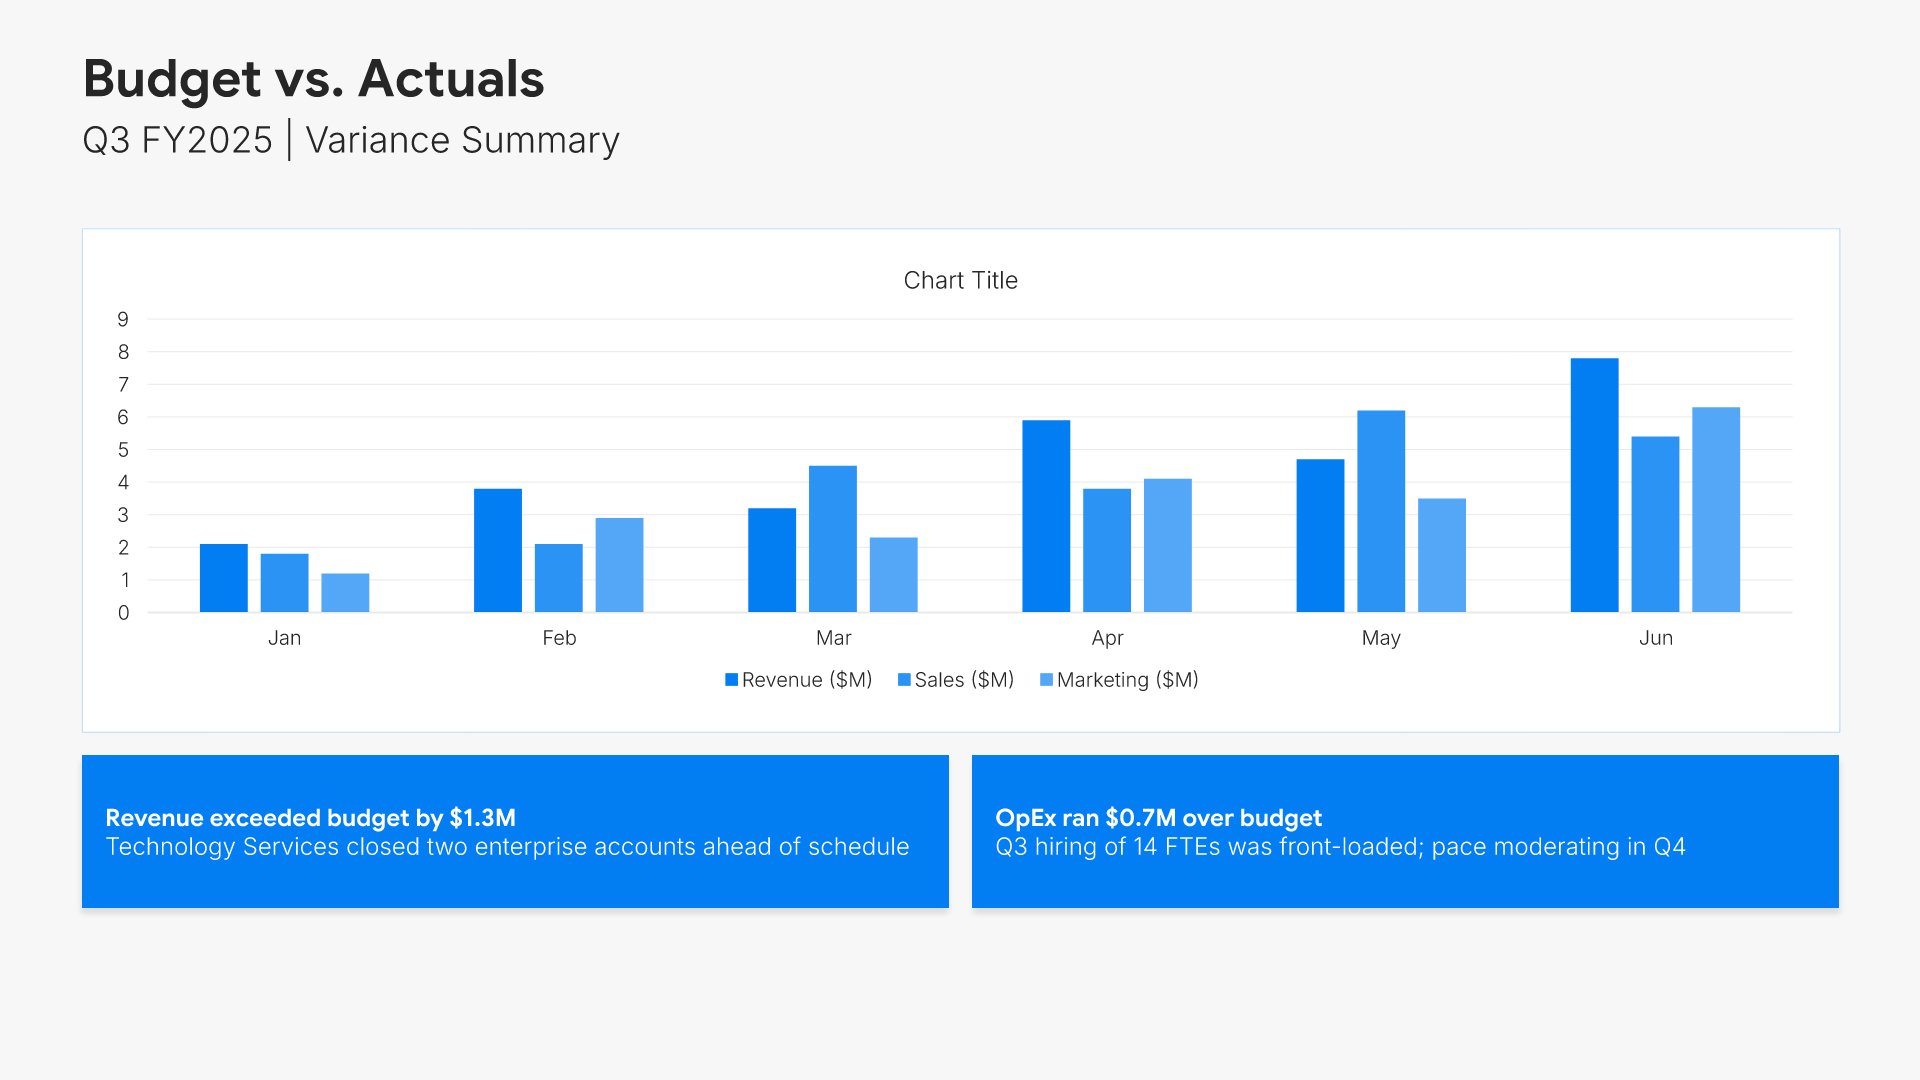
Budget vs. actual analysis slide, quarterly financial report template, every line against plan, charted

Slide 07

Budget vs. Actual Analysis

Every line against plan, charted, with the variance summary underneath.

Built using “Charts” slide
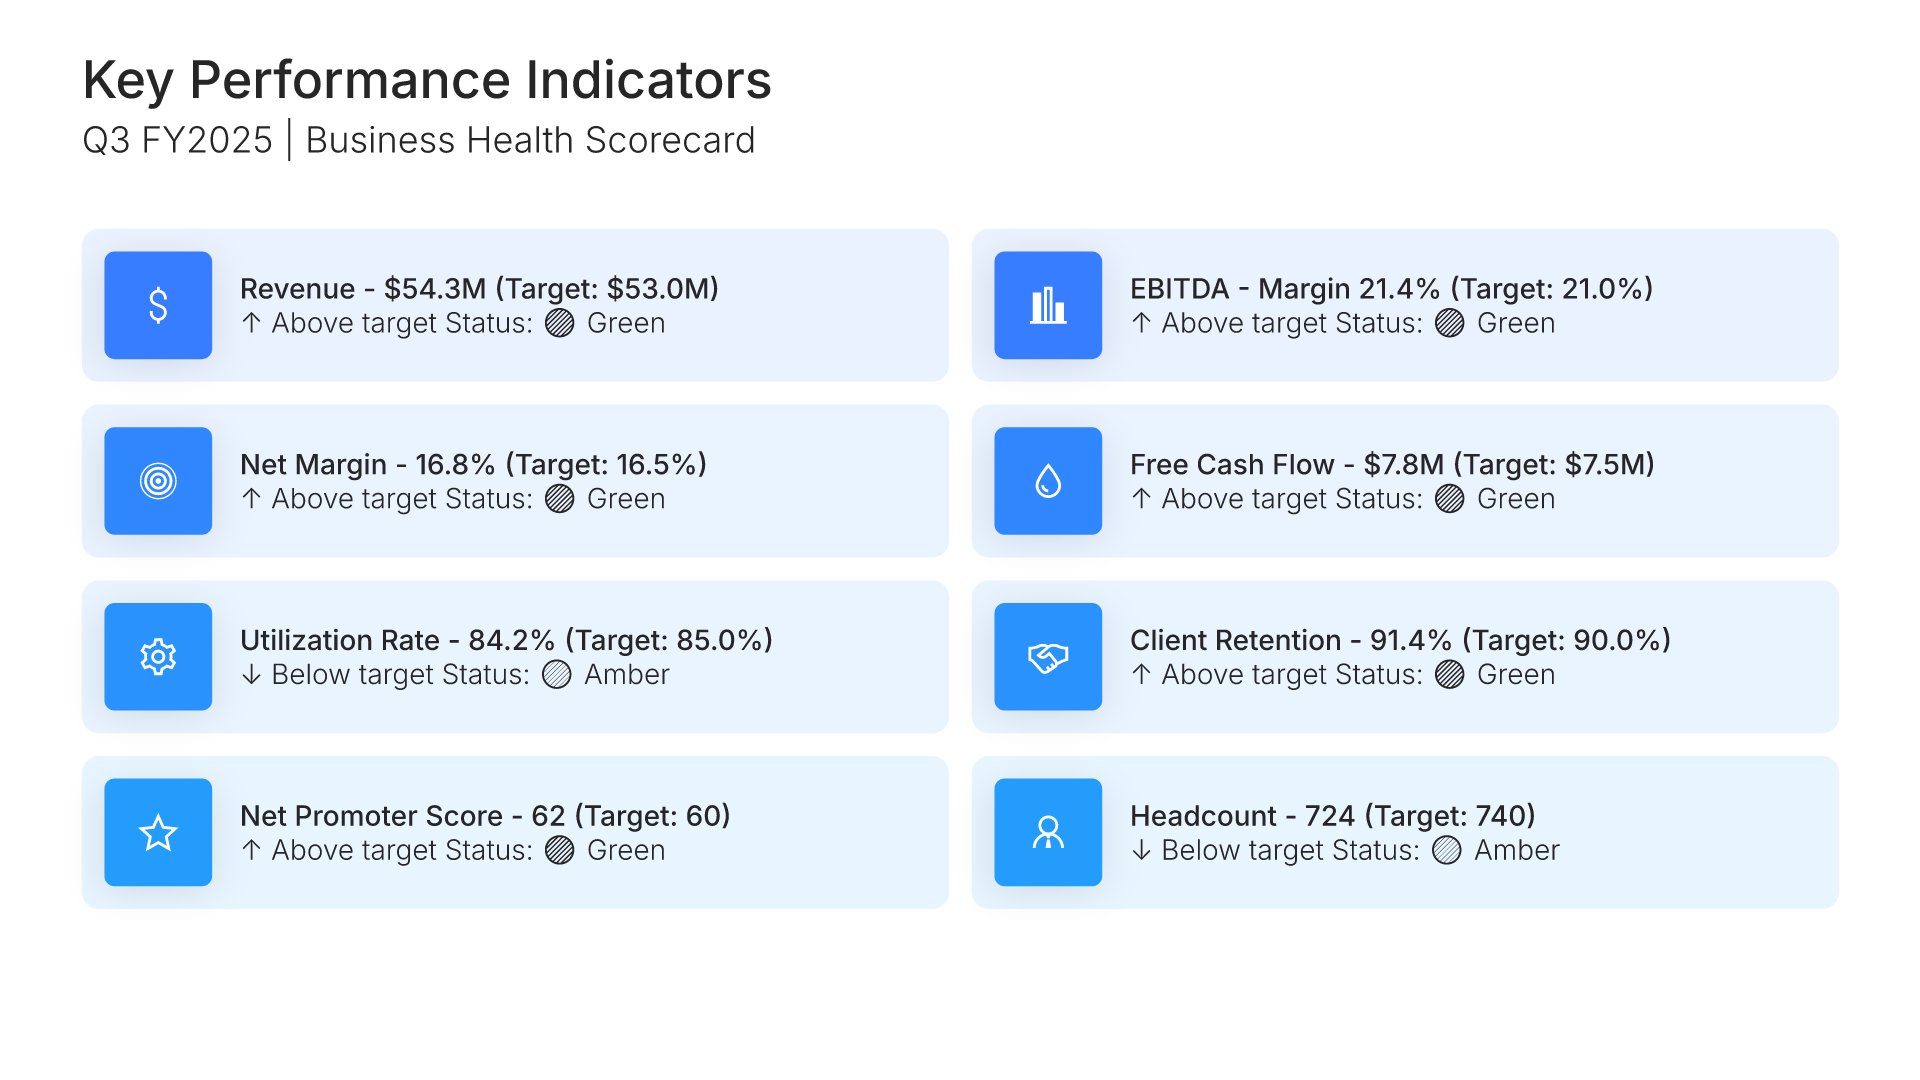
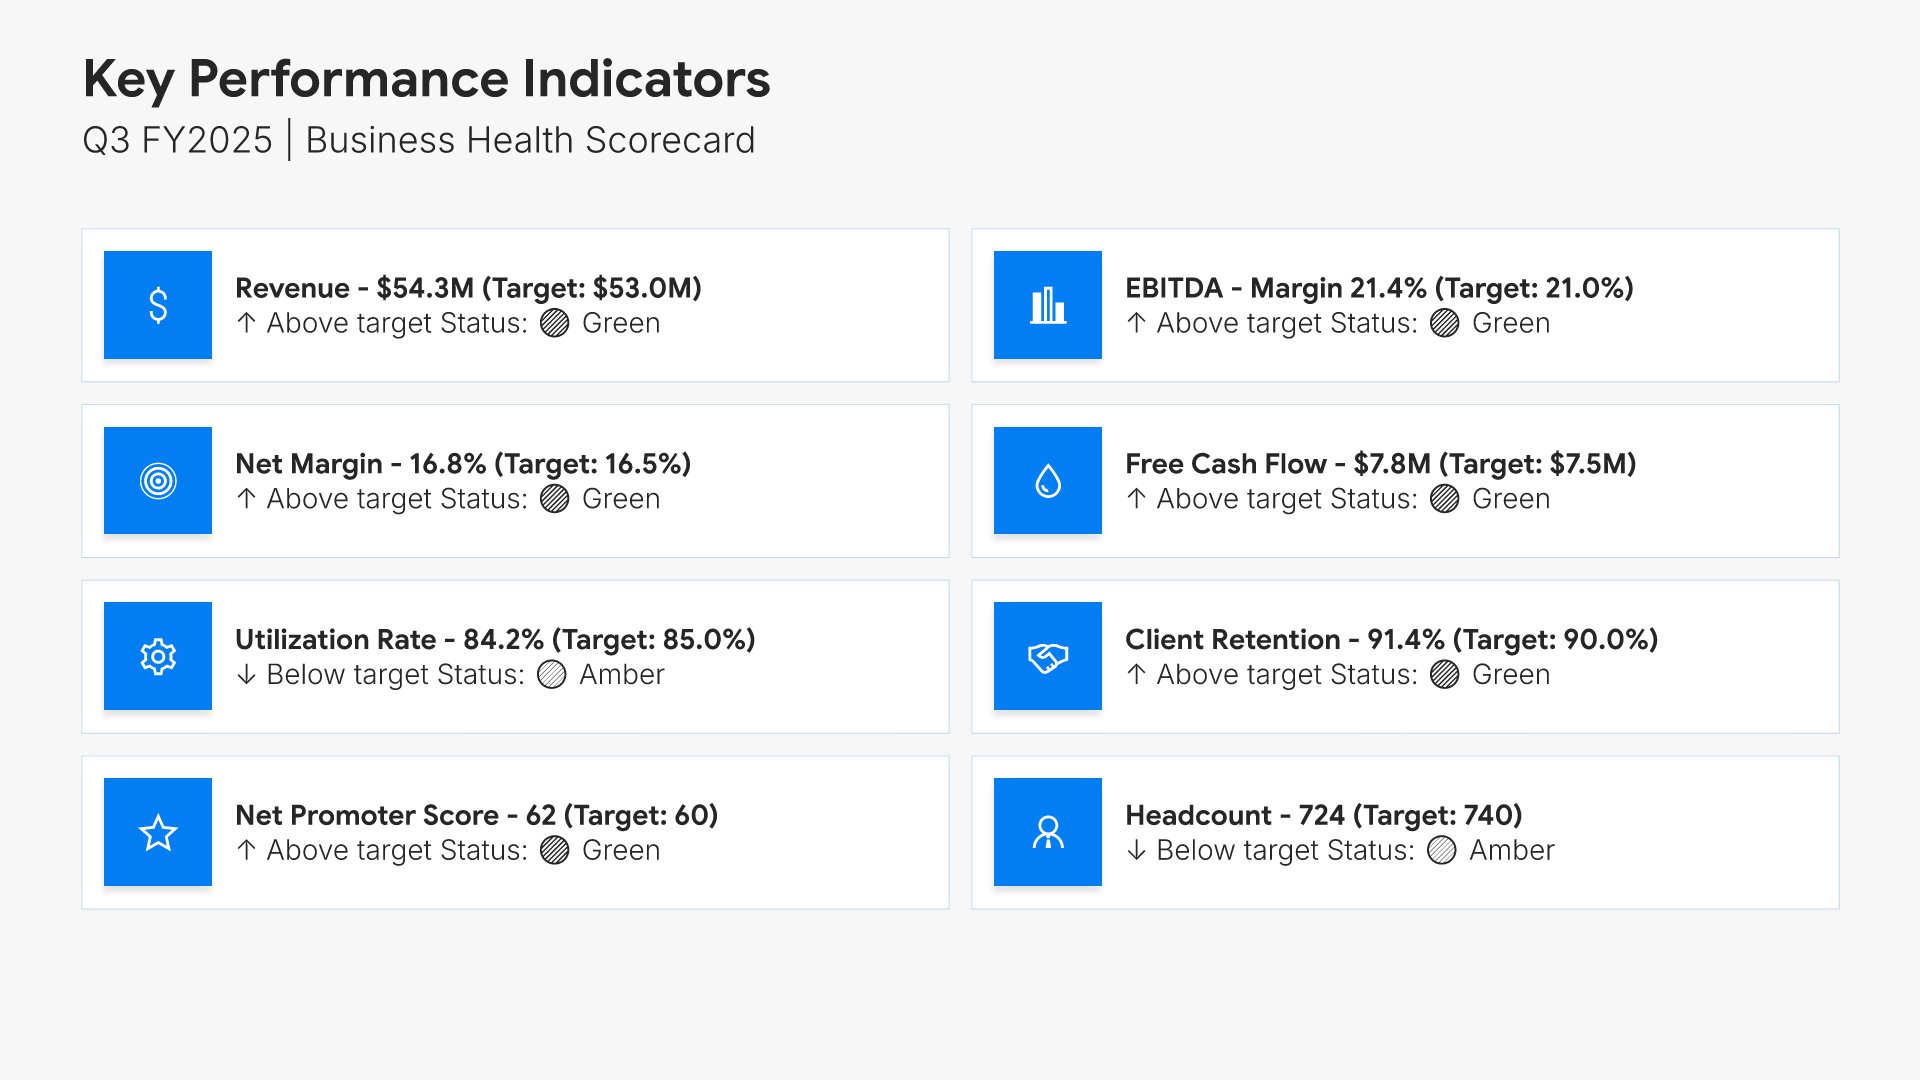
Key performance indicators slide, quarterly financial report template, six KPIs with target and status

Slide 08

Key Performance Indicators

Revenue, EBITDA, net margin, utilization, client retention, and headcount, each with target and status.

Built using “Simple Numbers” slide
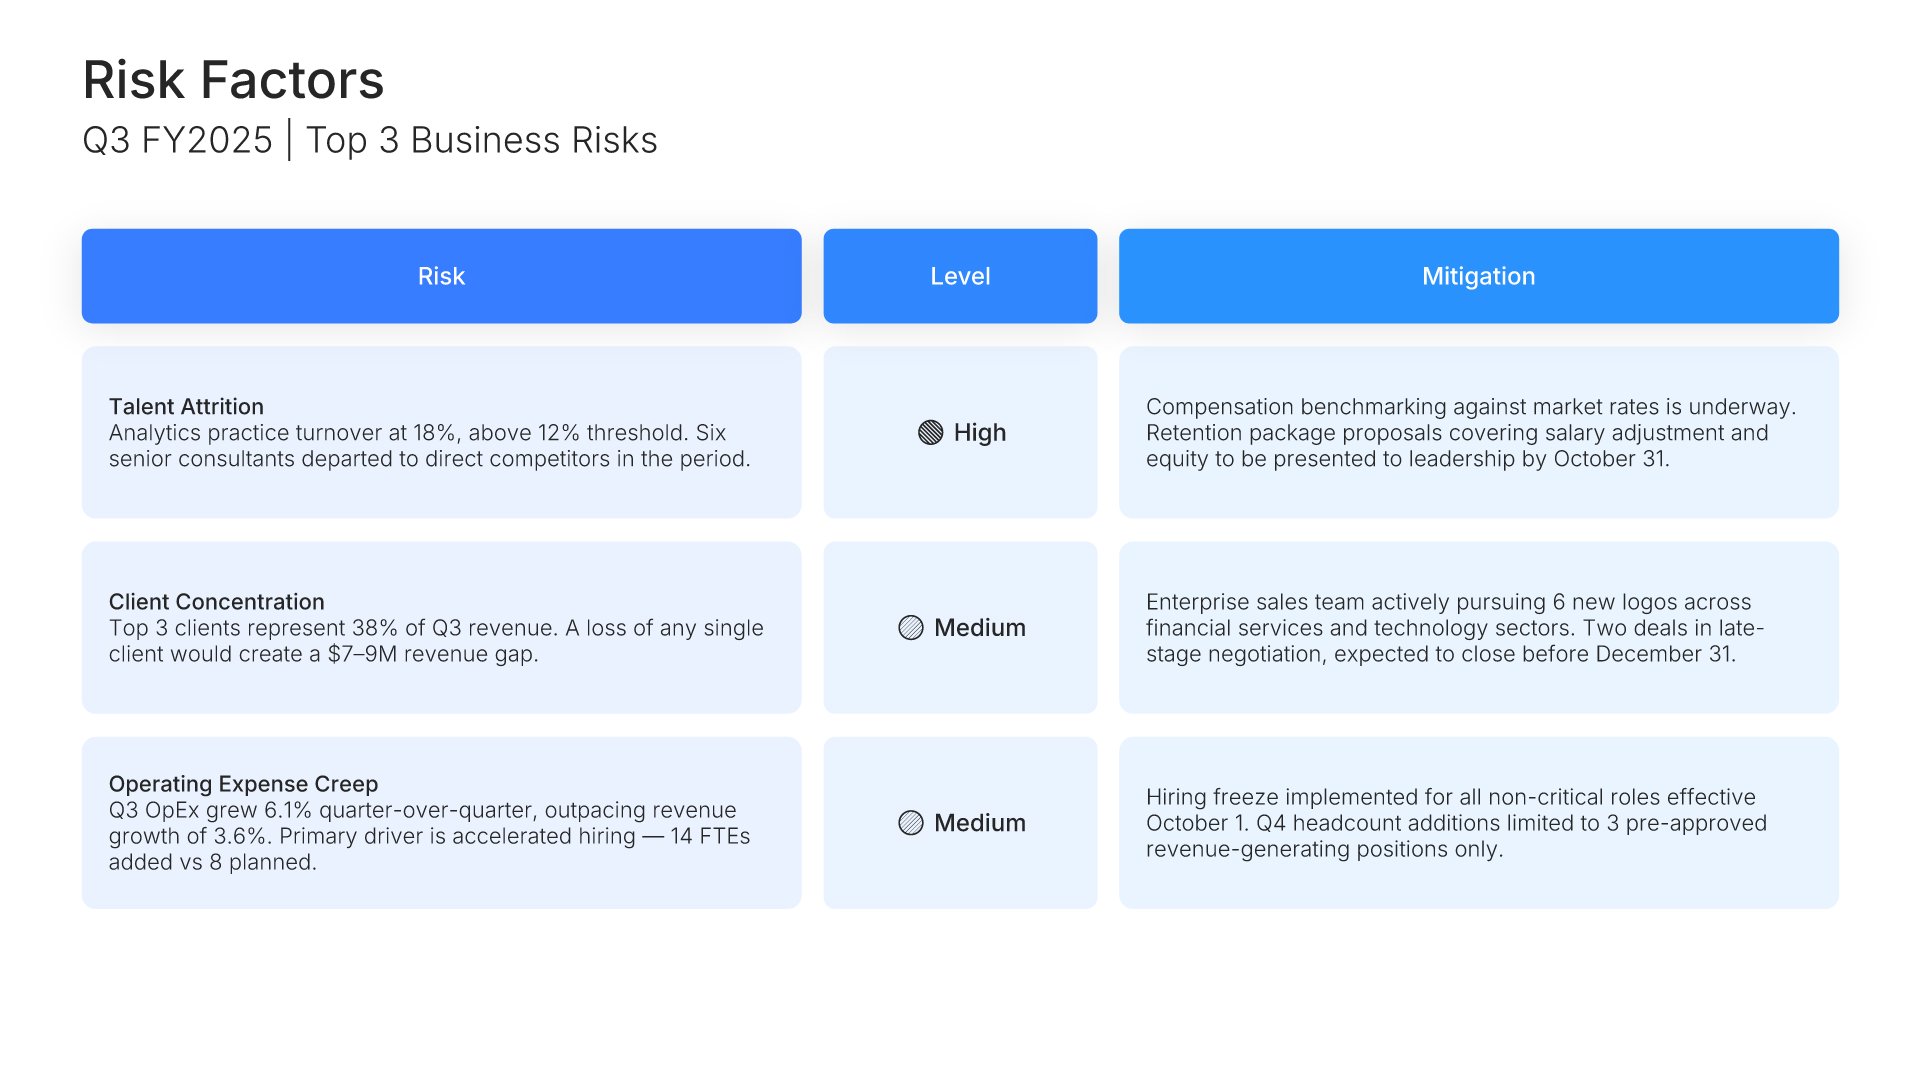
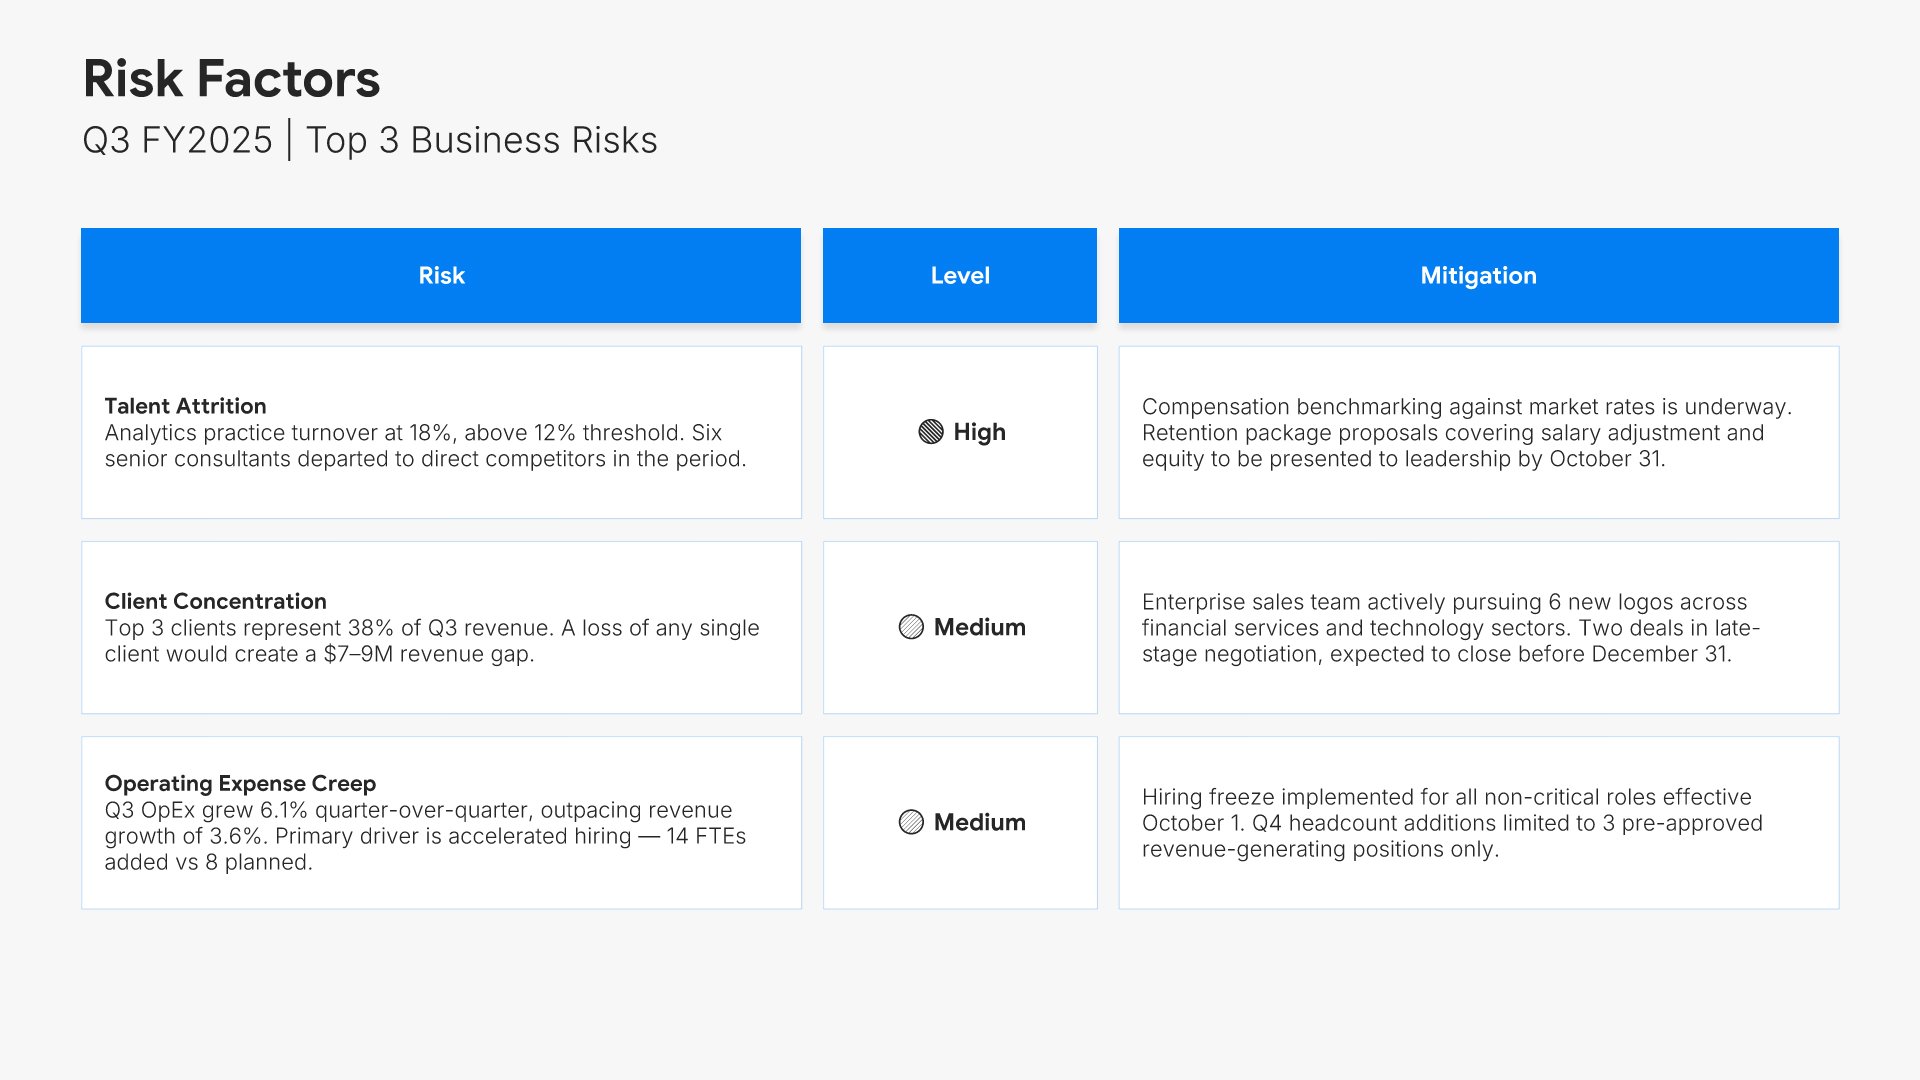
Risk factors and challenges slide, quarterly financial report template, top three risks with mitigations

Slide 09

Risk Factors & Challenges

The quarter's top three risks with their level and the mitigation against each.

Built using “Table” slide
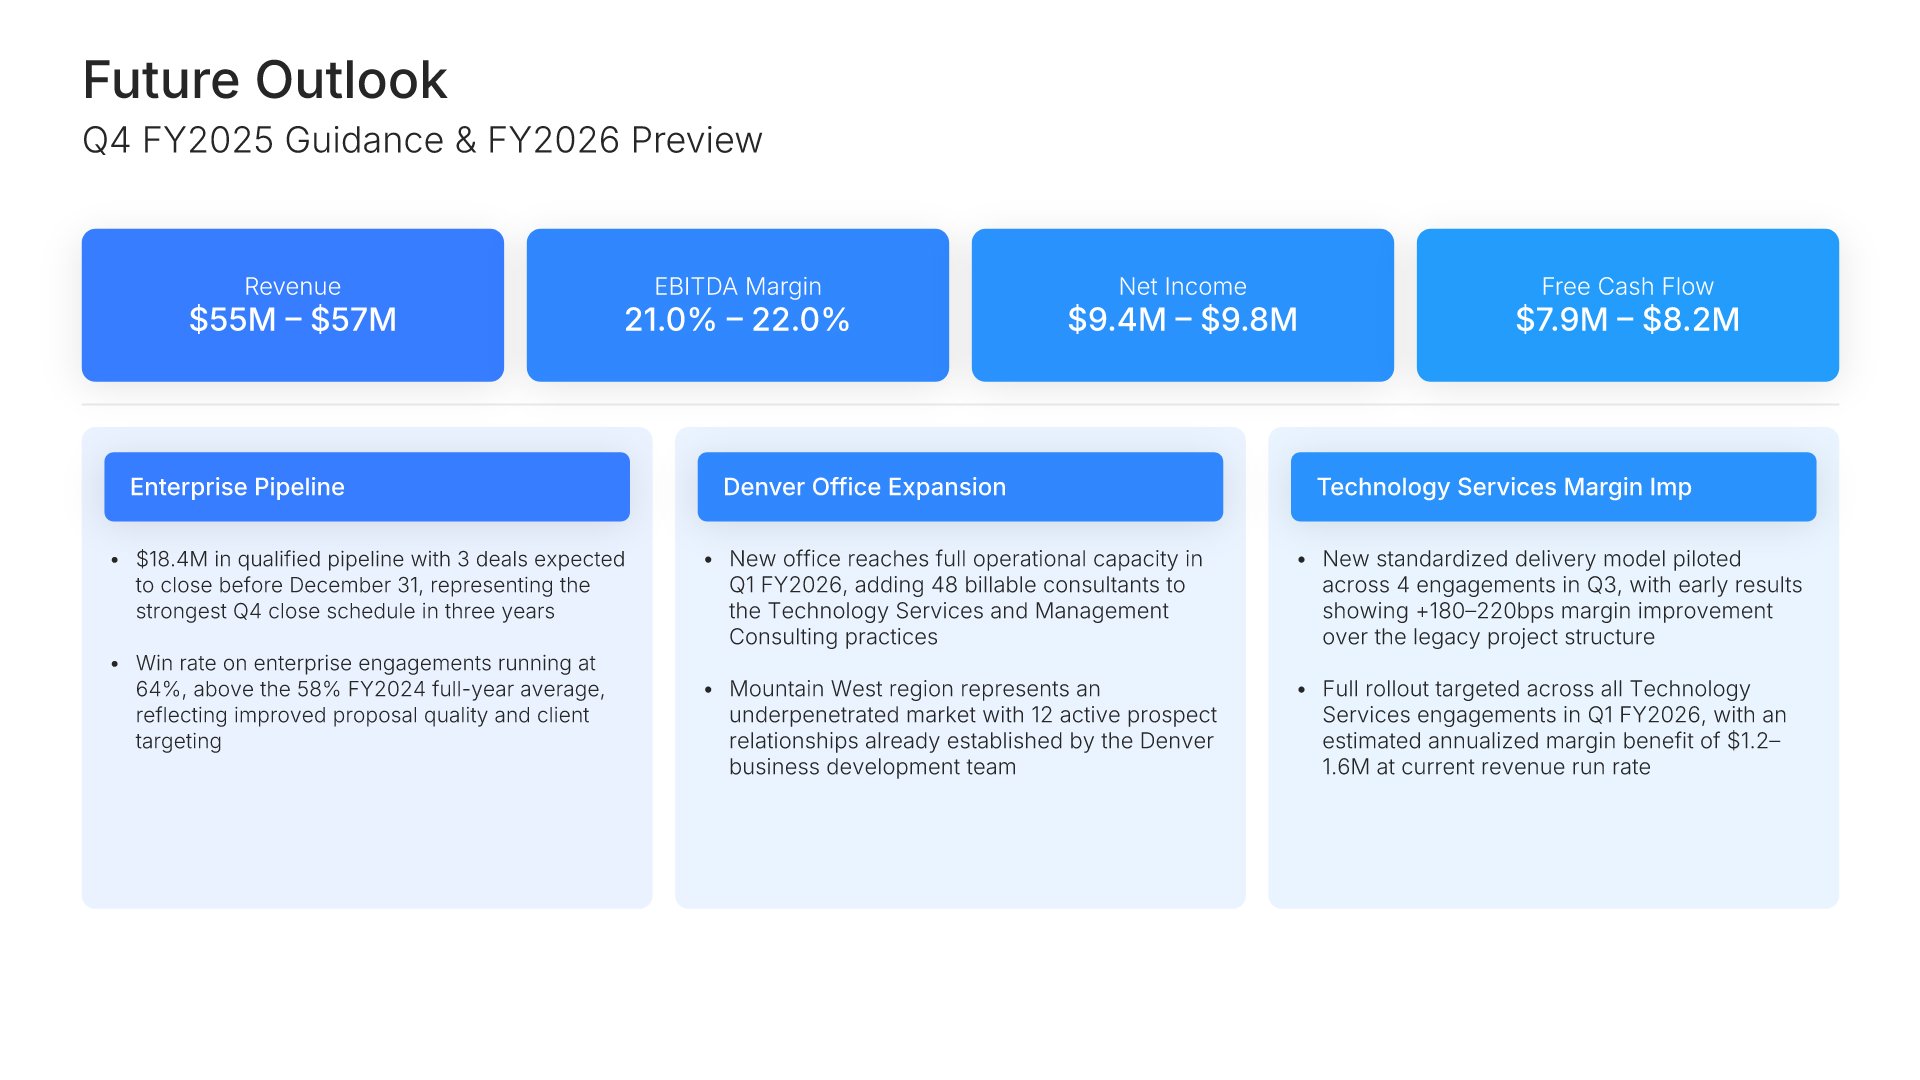
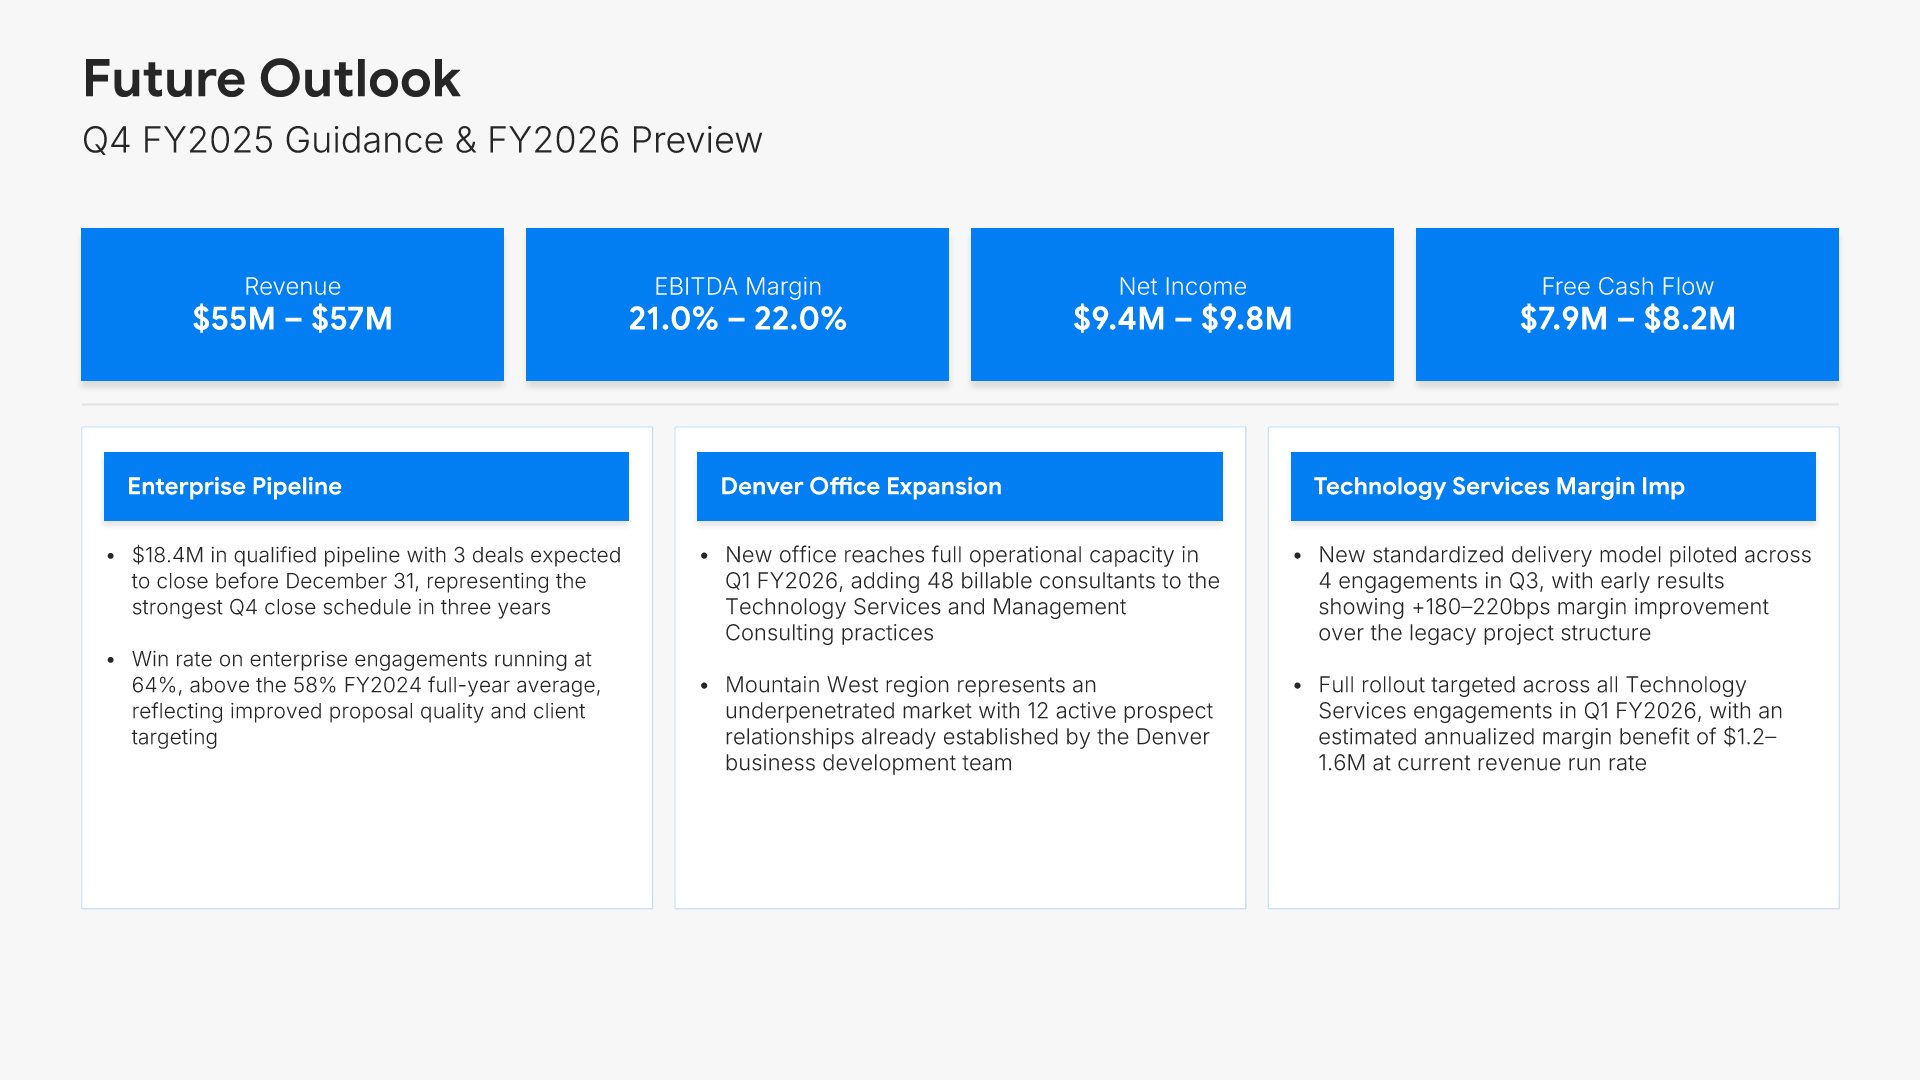
Future outlook slide, quarterly financial report template, next quarter and full-year guidance ranges

Slide 10

Future Outlook

Next quarter and the full year ahead, with the guidance ranges.

Built using “Executive Summary” slide
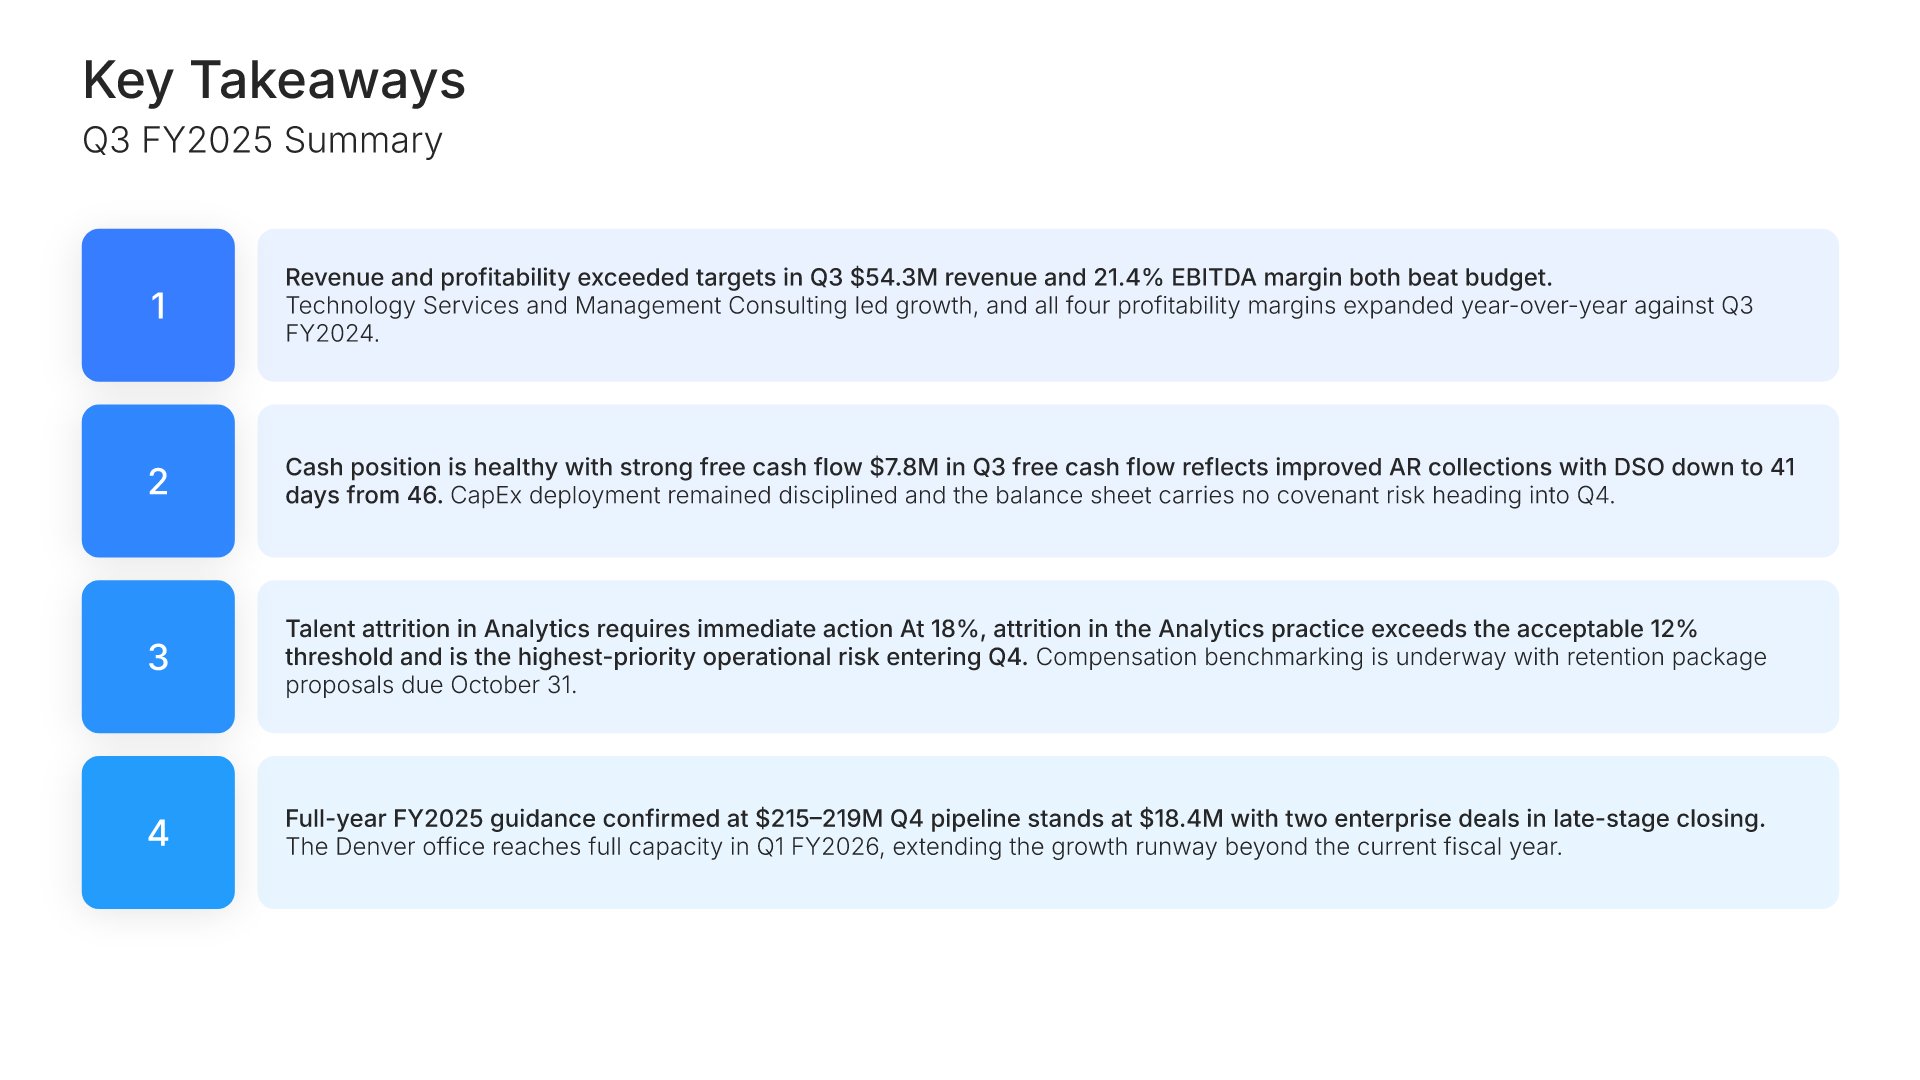
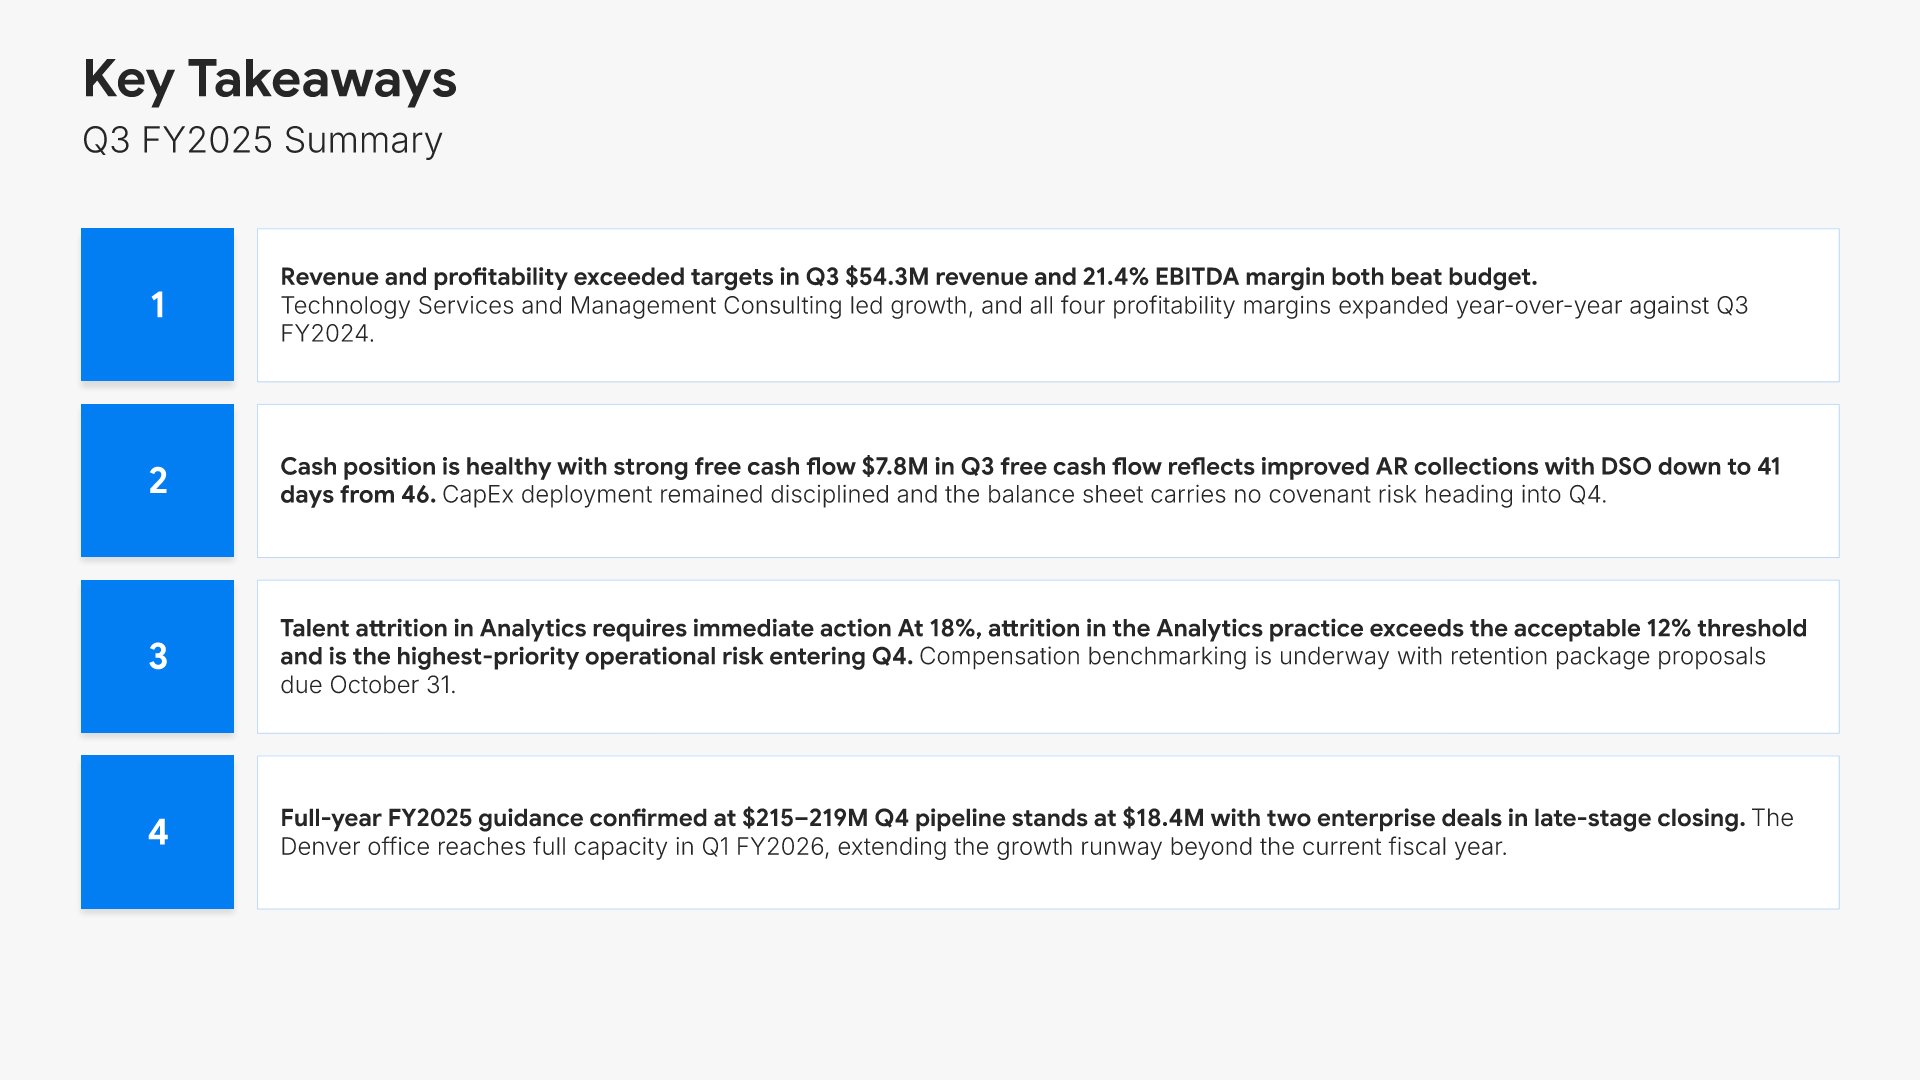
Key takeaways slide, quarterly financial report template, four numbered conclusions for the board

Slide 11

Key Takeaways

Four numbered conclusions the board should leave with.

Built using “Simple Text (with Numbers)” slide
Thank you slide, quarterly financial report template, contact details and close

Slide 12

Thank You

Contact details and a clean close.

Built using “Title” slide

About the quarterly financial report template

The structure, the slides, your brand, and a file you can edit anywhere.

Built for readers who saw last quarter’s report

A quarterly report is read in ten minutes by people who saw the last one. So it has to lead with what changed, show the variance against plan, and say what the next quarter looks like. This template does that in twelve slides, ending on four takeaways the board can act on.

Built from 9,000+ slides across 134+ categories

Every slide here comes from the same library. Waterfall charts, KPI dashboards, financial tables, and comparison layouts are already in it, so adding a segment breakdown or a second variance view takes a minute. Everything sits on the same grid, so the layout still holds.

Brand the whole presentation in one click

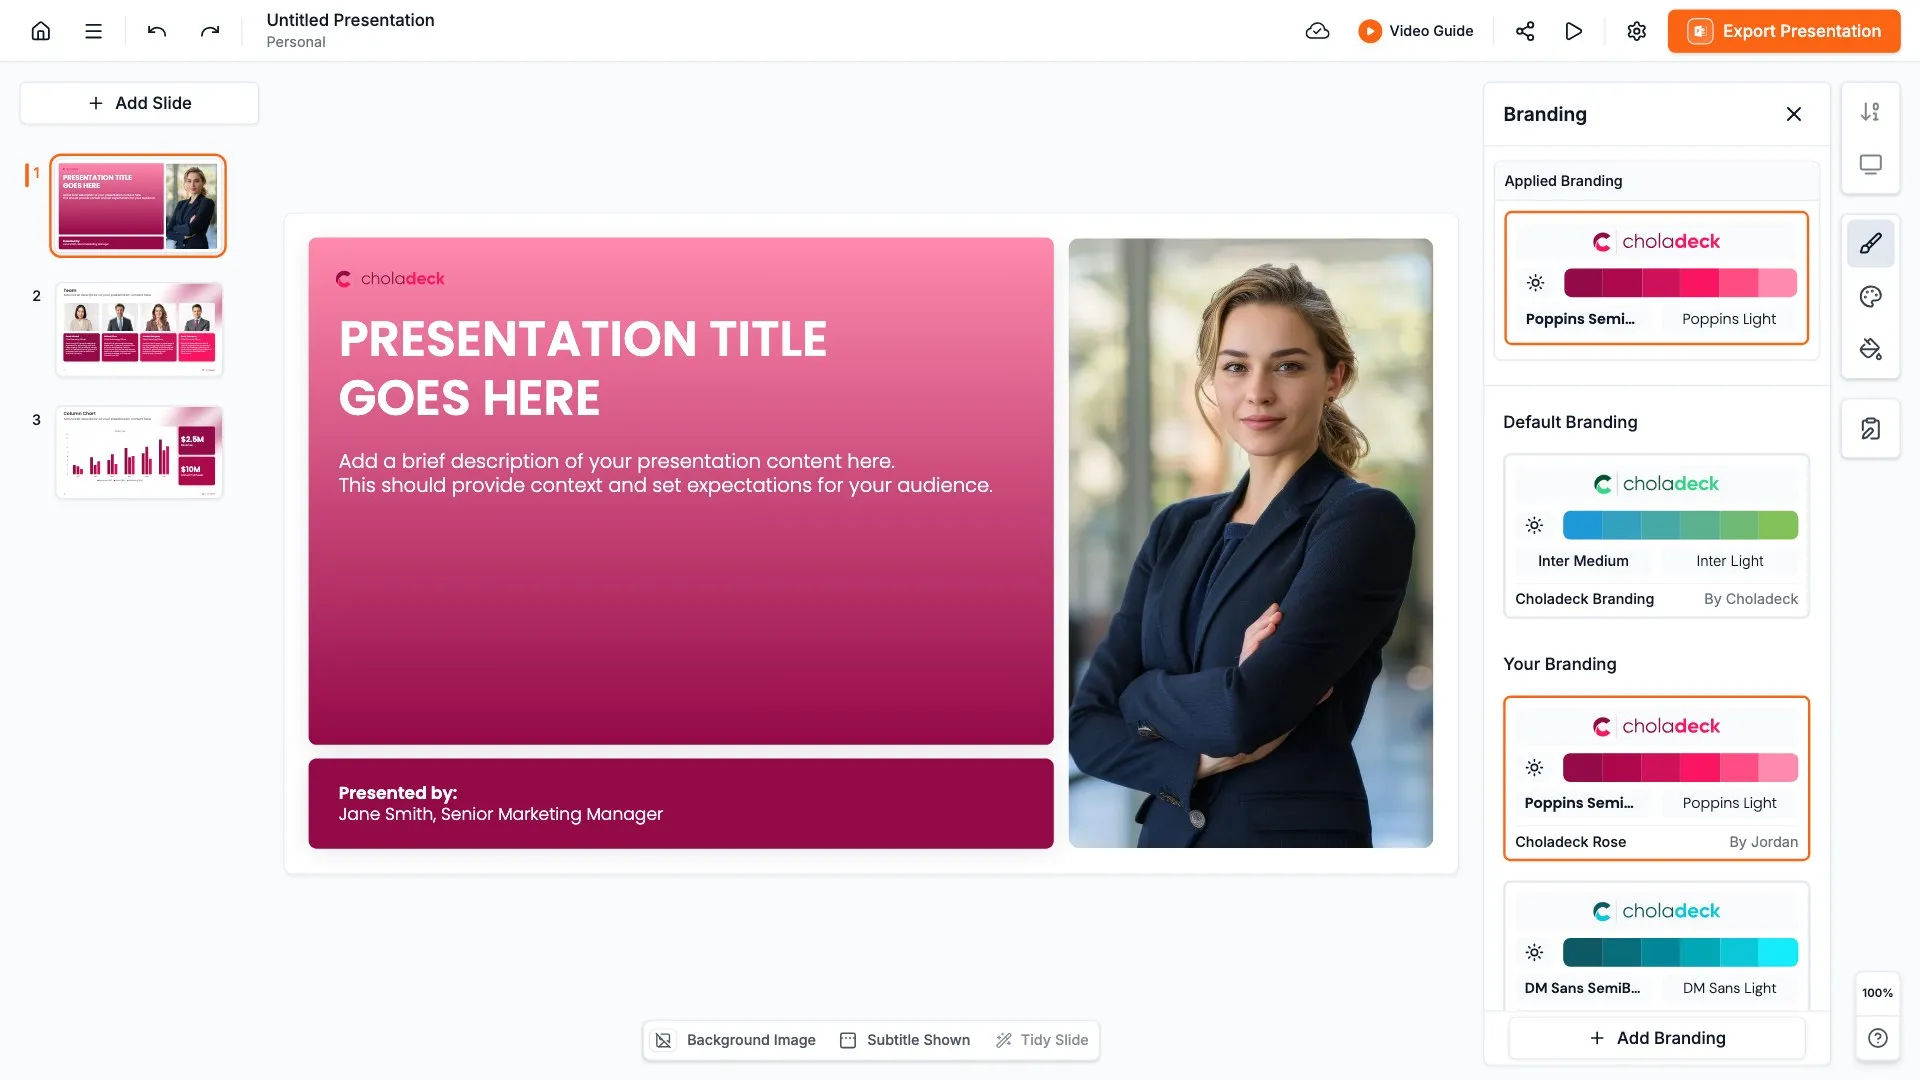
Add your logo, colors, fonts, and background once. It applies to the whole presentation and the entire slide library at the same time. Every quarter’s report looks like the last one, so the board compares the numbers, not the layouts.

Export to PowerPoint, Google Slides, or Keynote

You get a real file, not a locked link. Export it and keep editing in the tool you already use. Every table and chart stays editable, so next quarter you update the numbers rather than rebuild the report.

How Choladeck works

From blank page to finished presentation in four steps.

STEP 01

Browse 9,000+ slides across 134+ categories, or open one of the 74 premade presentations.

STEP 02

Add your logo, colors, and fonts in one click. The whole presentation instantly matches your company.

STEP 03

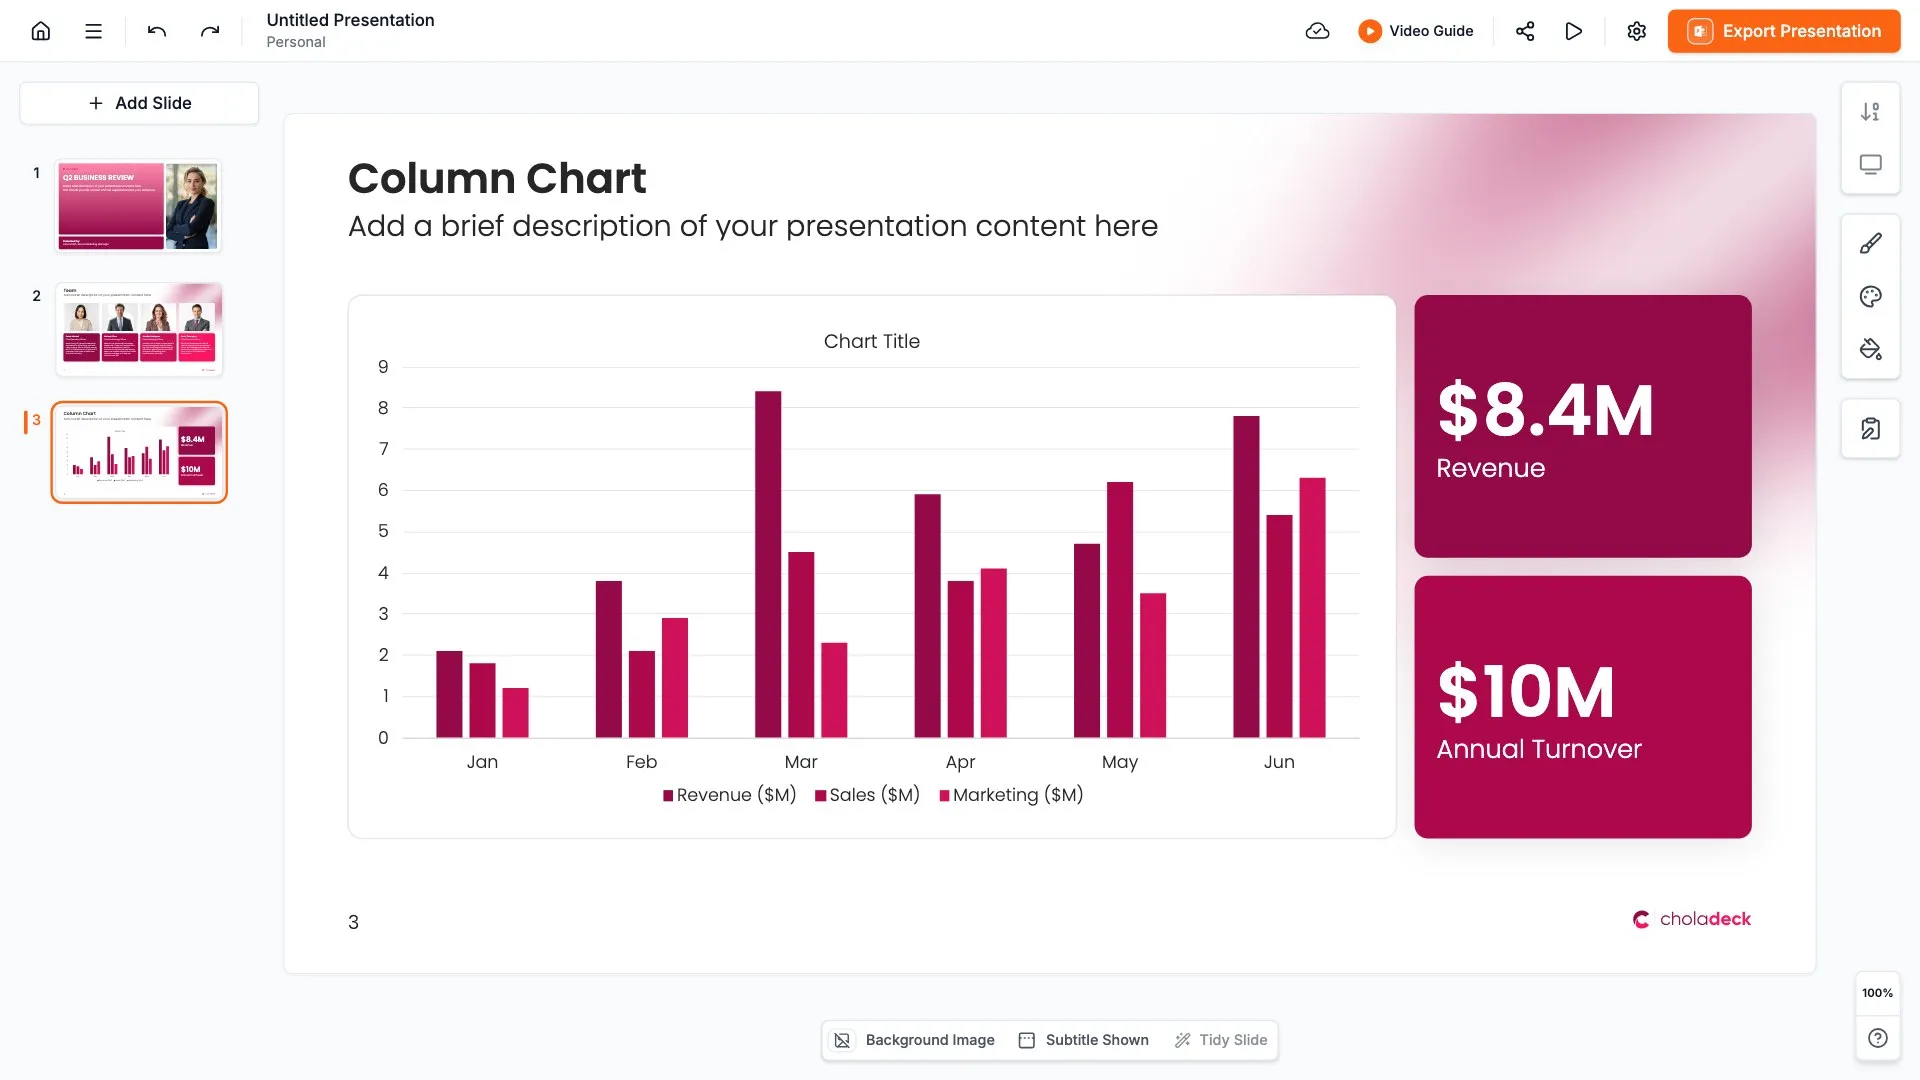
Add your text, numbers, charts, and tables. Everything on the slide is editable.

STEP 04

Send it to PowerPoint, Google Slides, or Keynote, and present.
Build your own

Nothing here fits? Build your own quarterly financial report

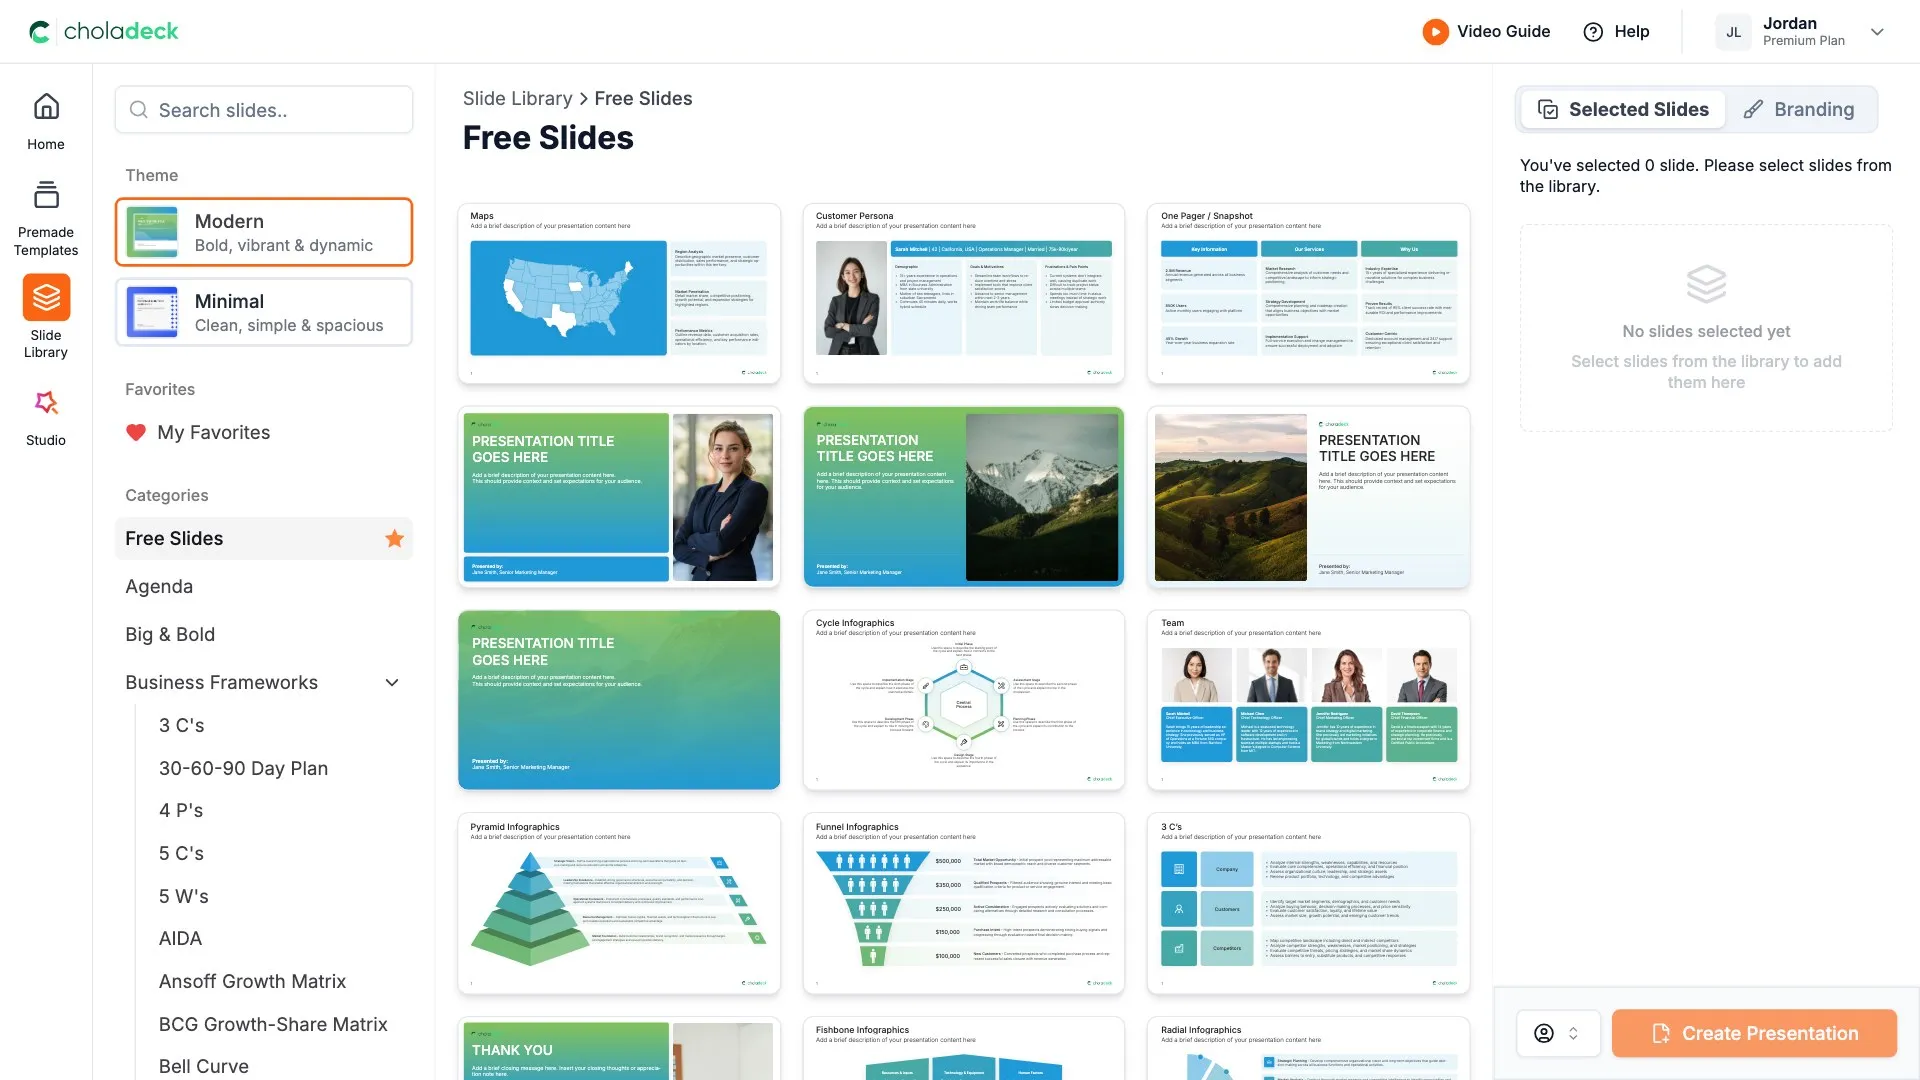
This template is assembled from the same 9,000+ slides. Pick the slides you need, drop them into one file, and brand the whole thing in one click.
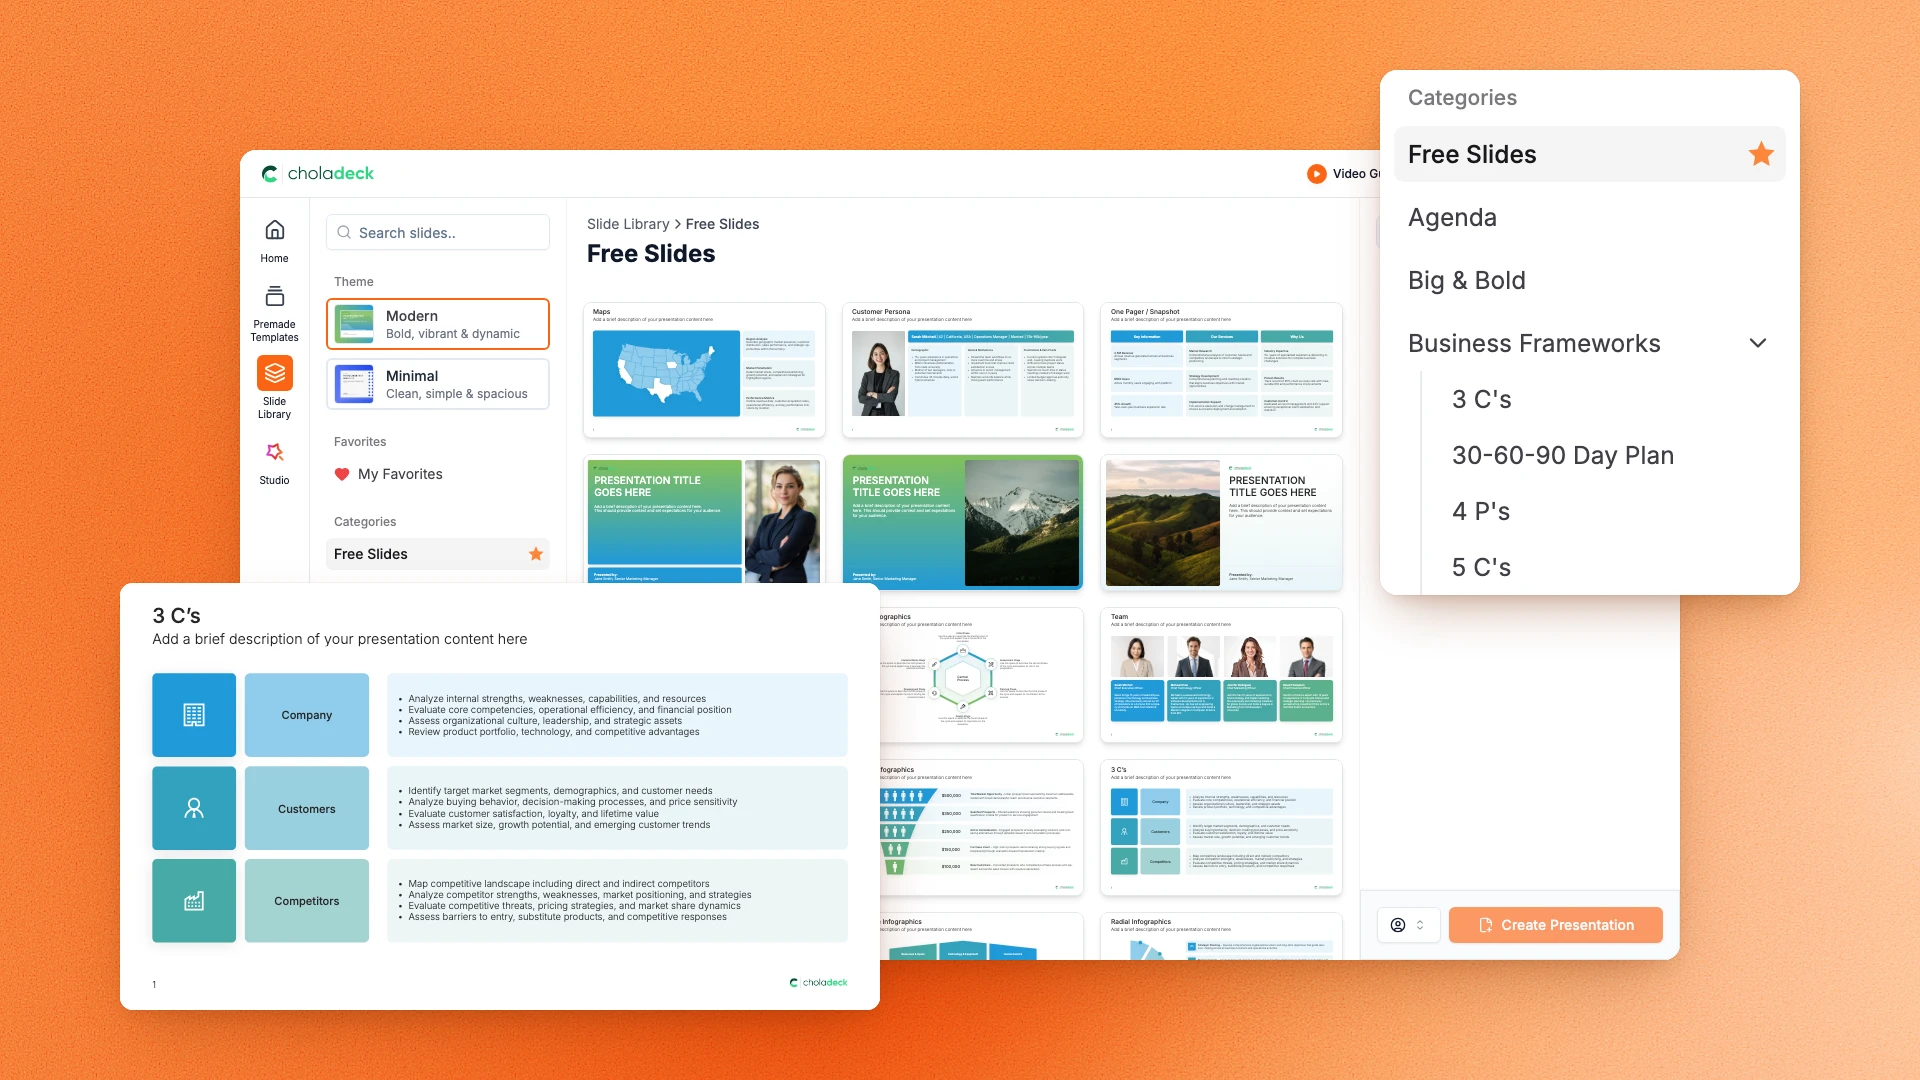
Choladeck slide library on Free Slides, with its category list and the 3 C’s slide shown larger

Questions about the quarterly financial report template

What's inside the template, and how far you can change it.

Using the template

Is the template fully editable?

+

Yes. Text, tables, charts, icons, and colors on every slide are yours to change. Nothing is locked and nothing is a flat image.

How do I brand it to my company?

+

Add your logo, colors, fonts, and background once. It applies to the whole presentation and the entire slide library at the same time.

Can I add slides from the slide library?

+

Yes. Add any slide from the library into this one, or swap out one that doesn't fit. Everything works together.

What's included

Can I reuse it every quarter?

+

That's what it's for. Duplicate the file, update the figures, and the charts follow. Nothing needs rebuilding between quarters.

Does it show performance against plan?

+

Yes. A budget-versus-actual slide charts every line against forecast, with the variance summary underneath.

Is placeholder content included?

+

Yes. Every slide comes with realistic text, sample figures, and filled-in charts, so you can see how the quarterly financial report reads before you put your own numbers in.

Start your quarterly financial report
from one that's already done

Pick it, brand it, add your content, and export.

Free to start. No credit card required.