Pricing

Metrics-neutral KPI dashboard template

Fourteen slides that put every function on one scorecard, then report each in turn. Revenue and sales, customer, operations and delivery, marketing, and people and culture each get their own section, then the trends, the gaps with causes, and the actions with owners. Select it, brand it to your organization in one click, add your figures, and export to PowerPoint, Google Slides, or Keynote.

Free to start. No credit card required.
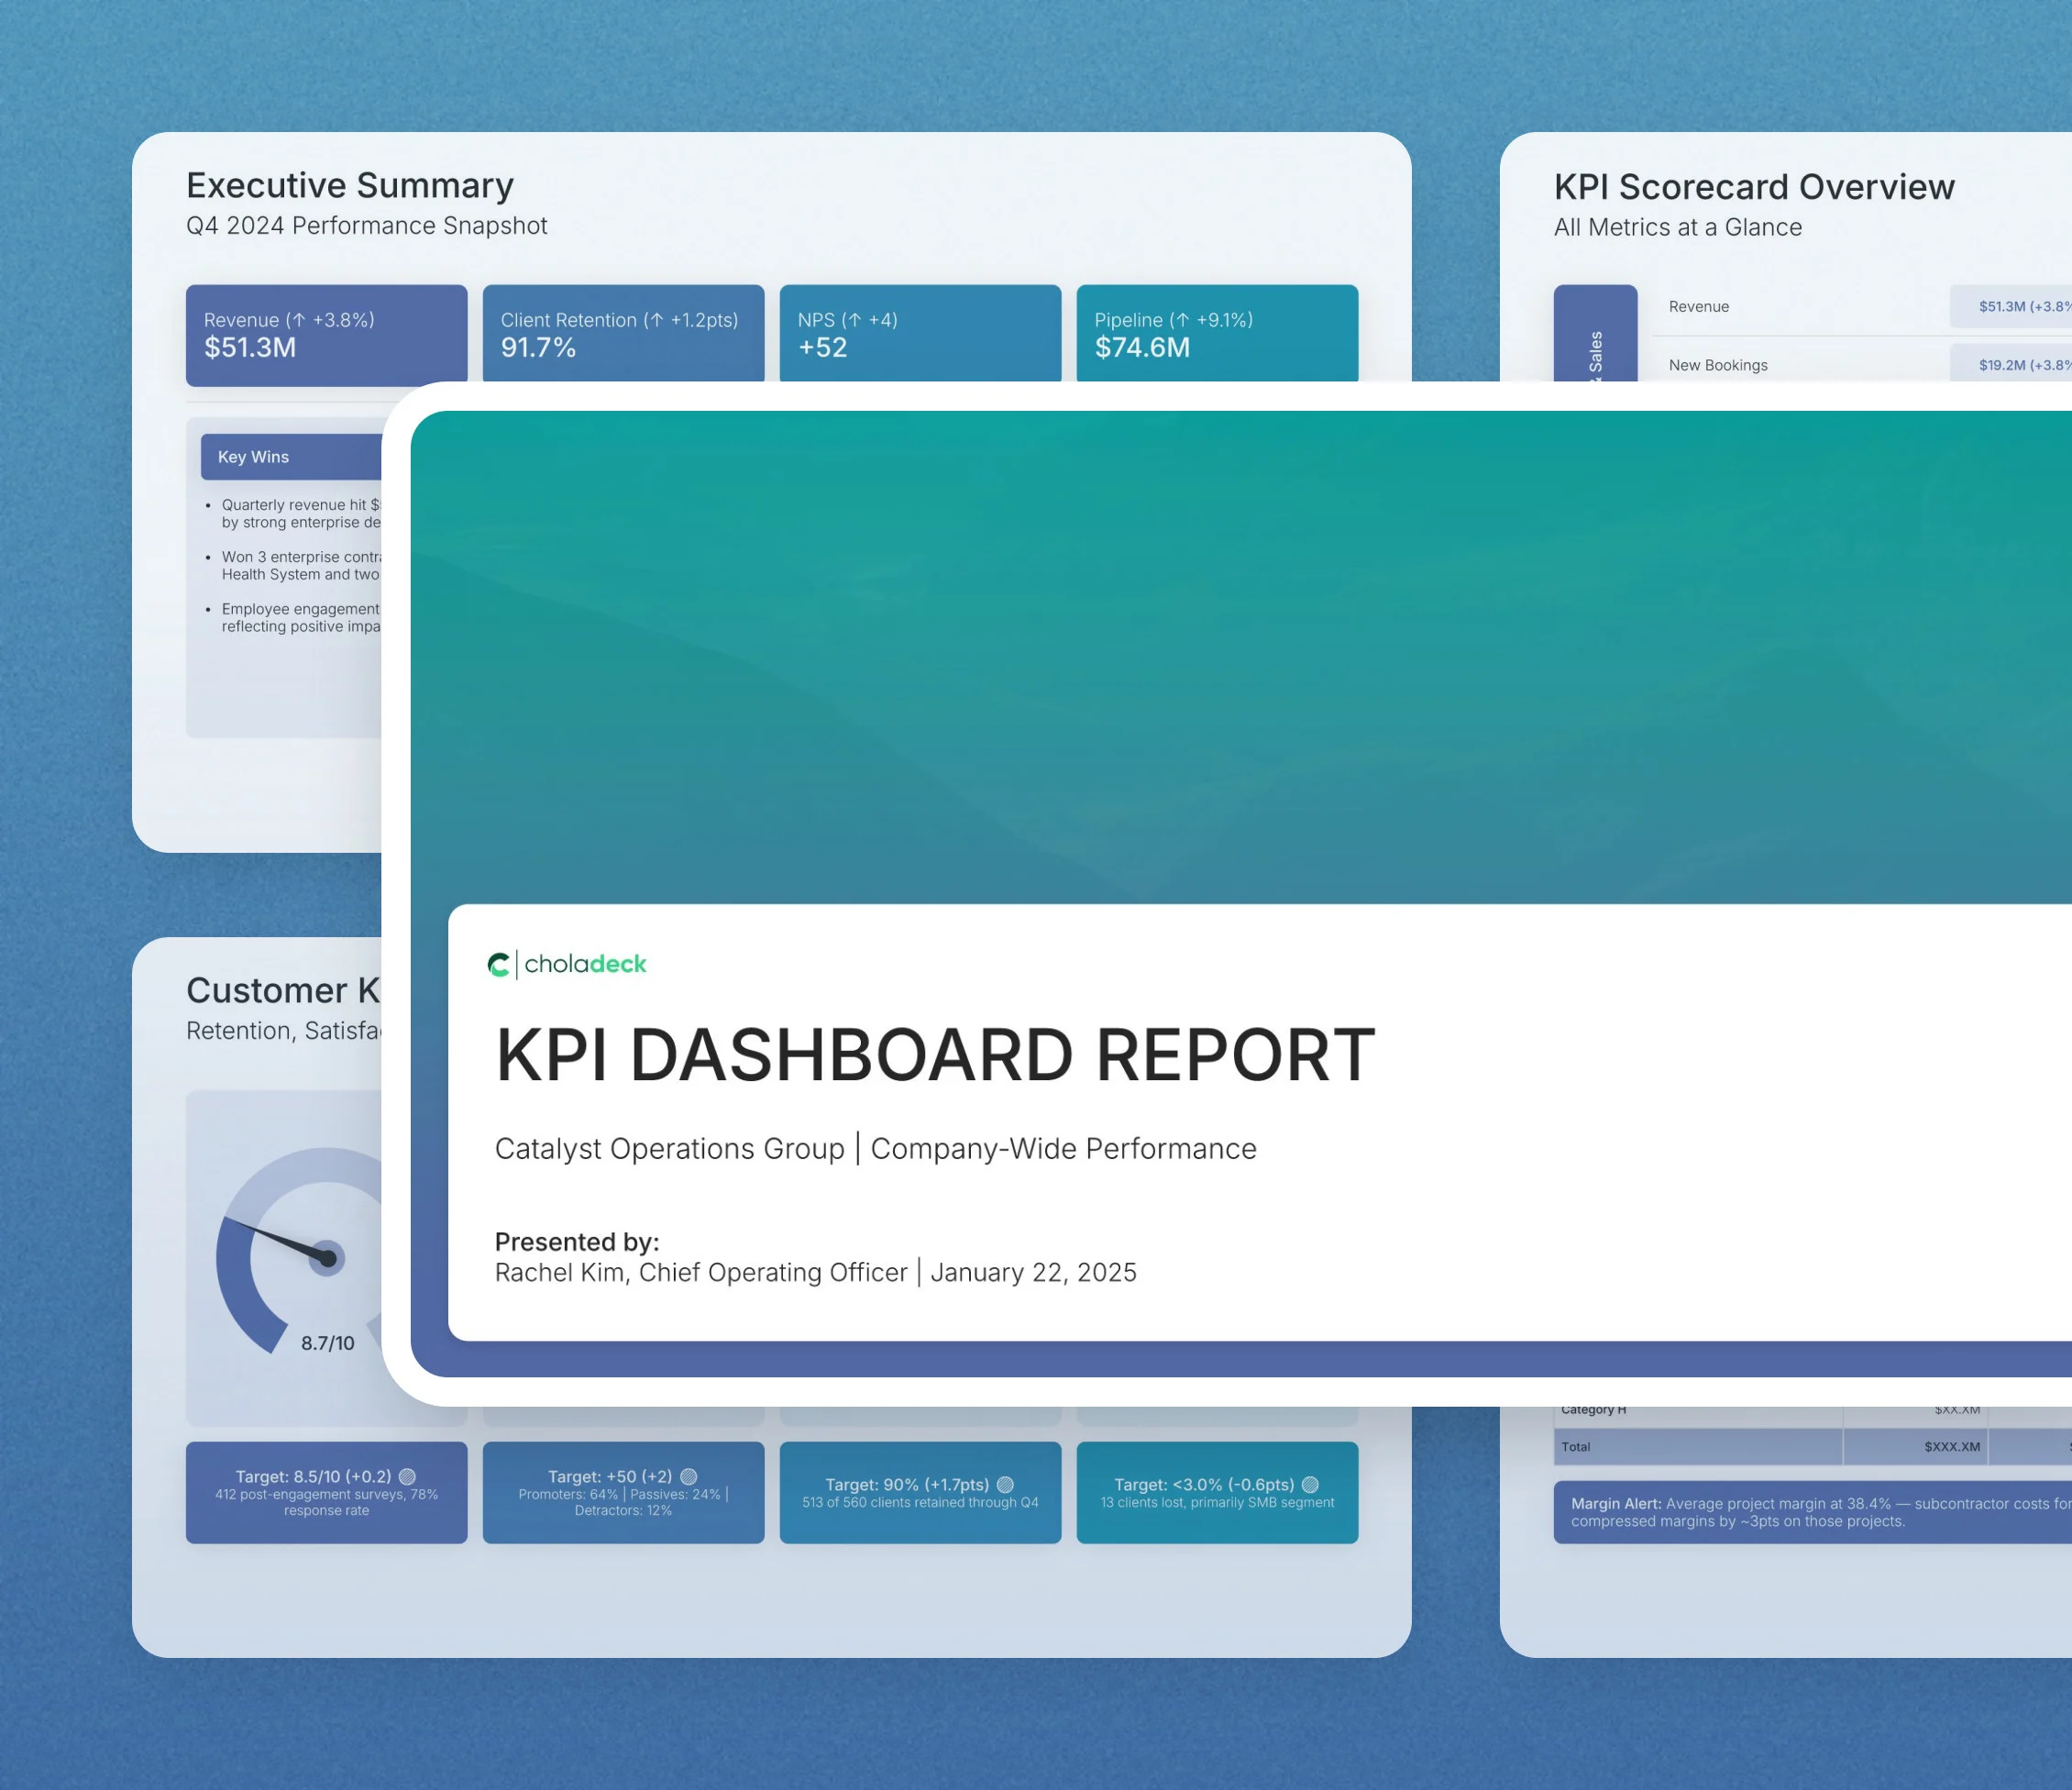
Metrics-neutral KPI dashboard template: the title slide in front of other slides from the 14-slide deck

Every slide in the metrics-neutral KPI dashboard template

Fourteen slides, in the order you present them.

Title slide, metrics-neutral KPI dashboard template, reporting period and who prepared it

Slide 01

Title

The reporting period, the organization, and who prepared it.

Built using “Title” slide
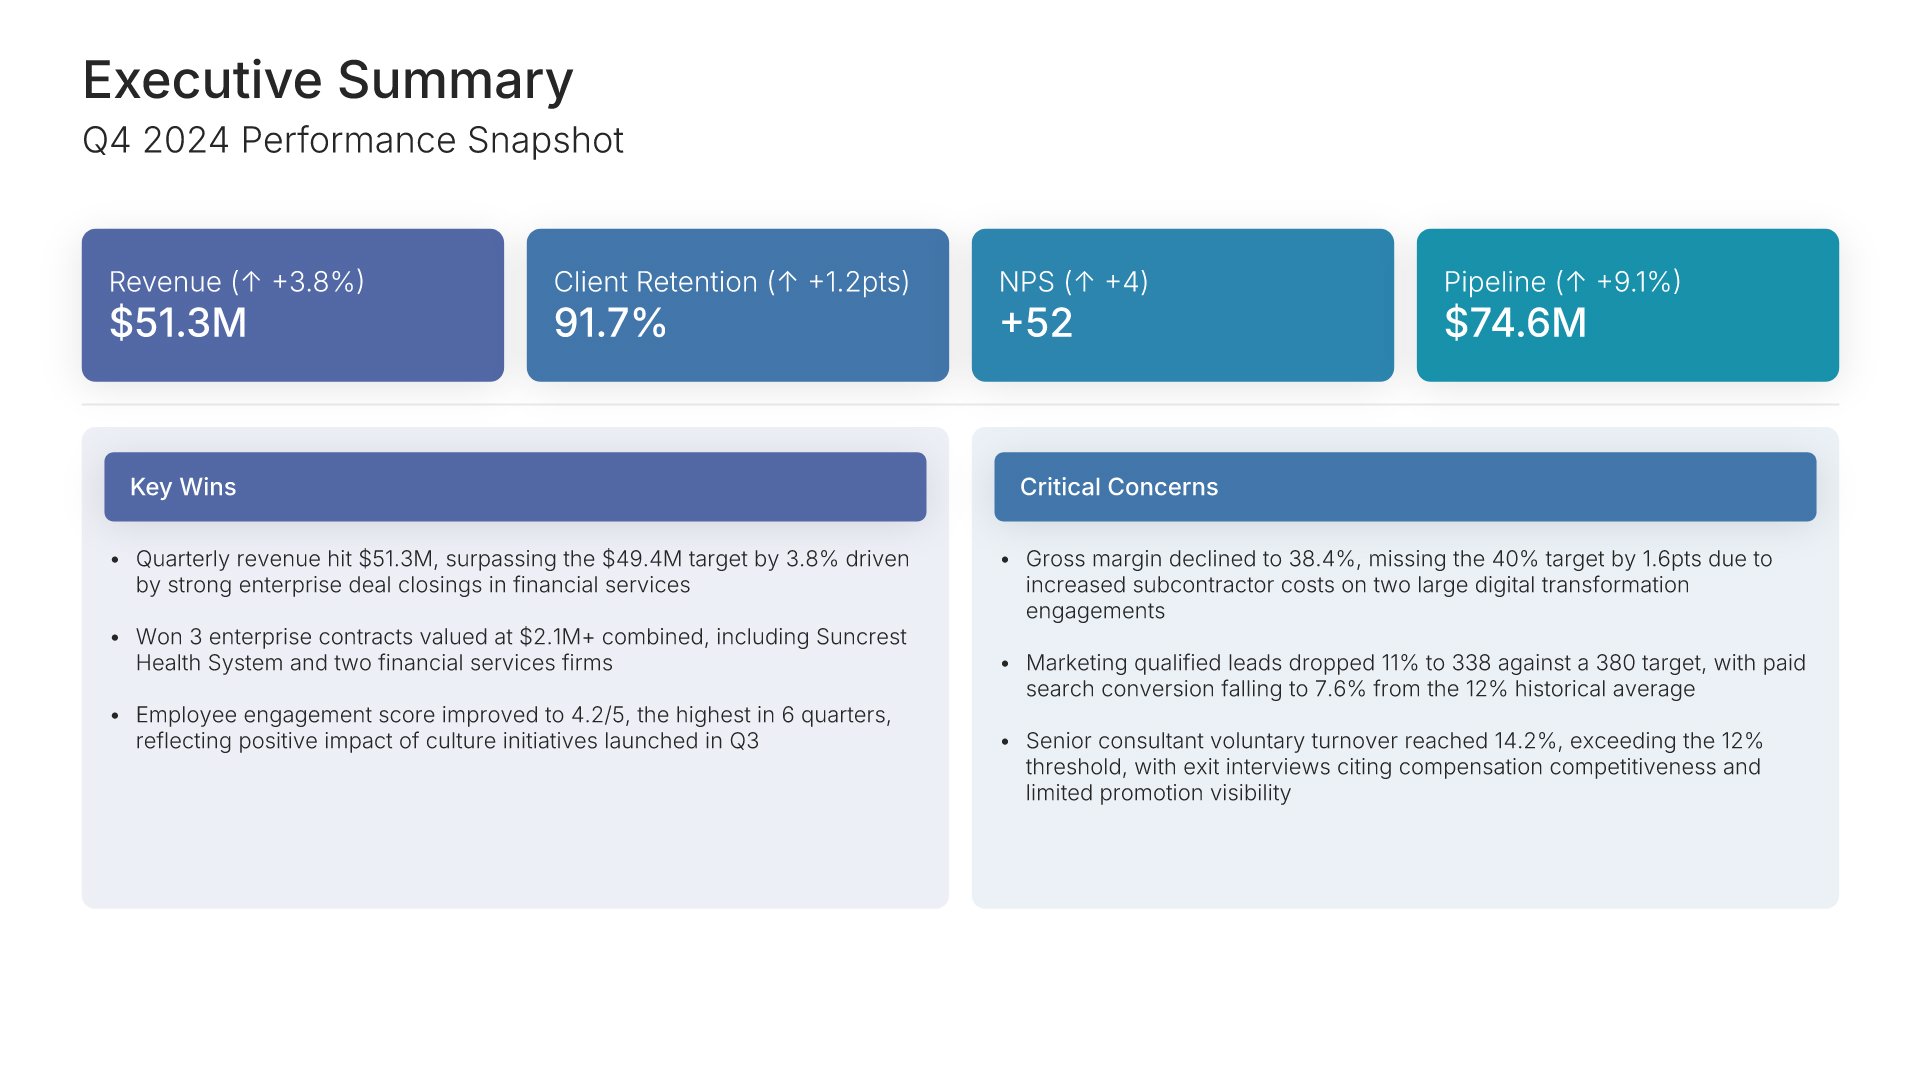
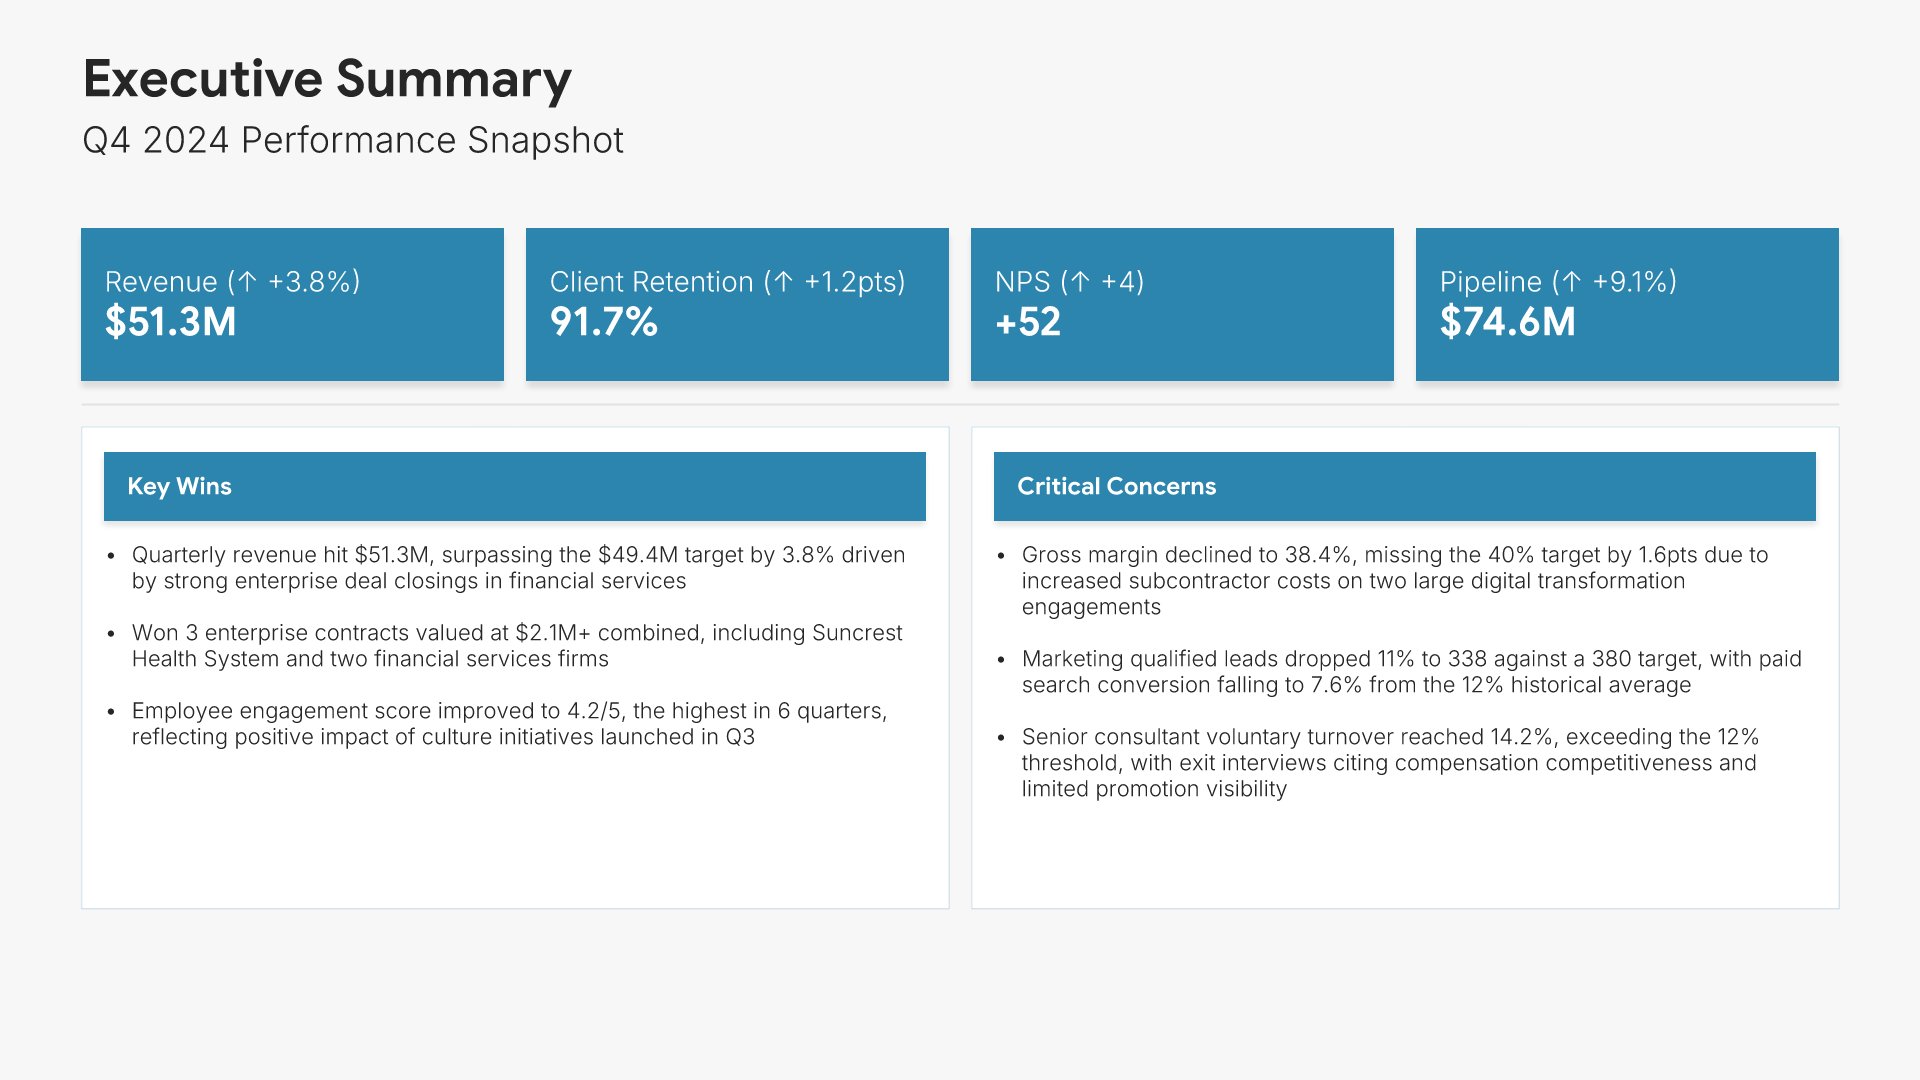
Executive summary slide, metrics-neutral KPI dashboard template, headline figures, wins, and critical issues

Slide 02

Executive Summary

Headline figures for the period, with key wins and critical issues beside them.

Built using “Executive Summary” slide
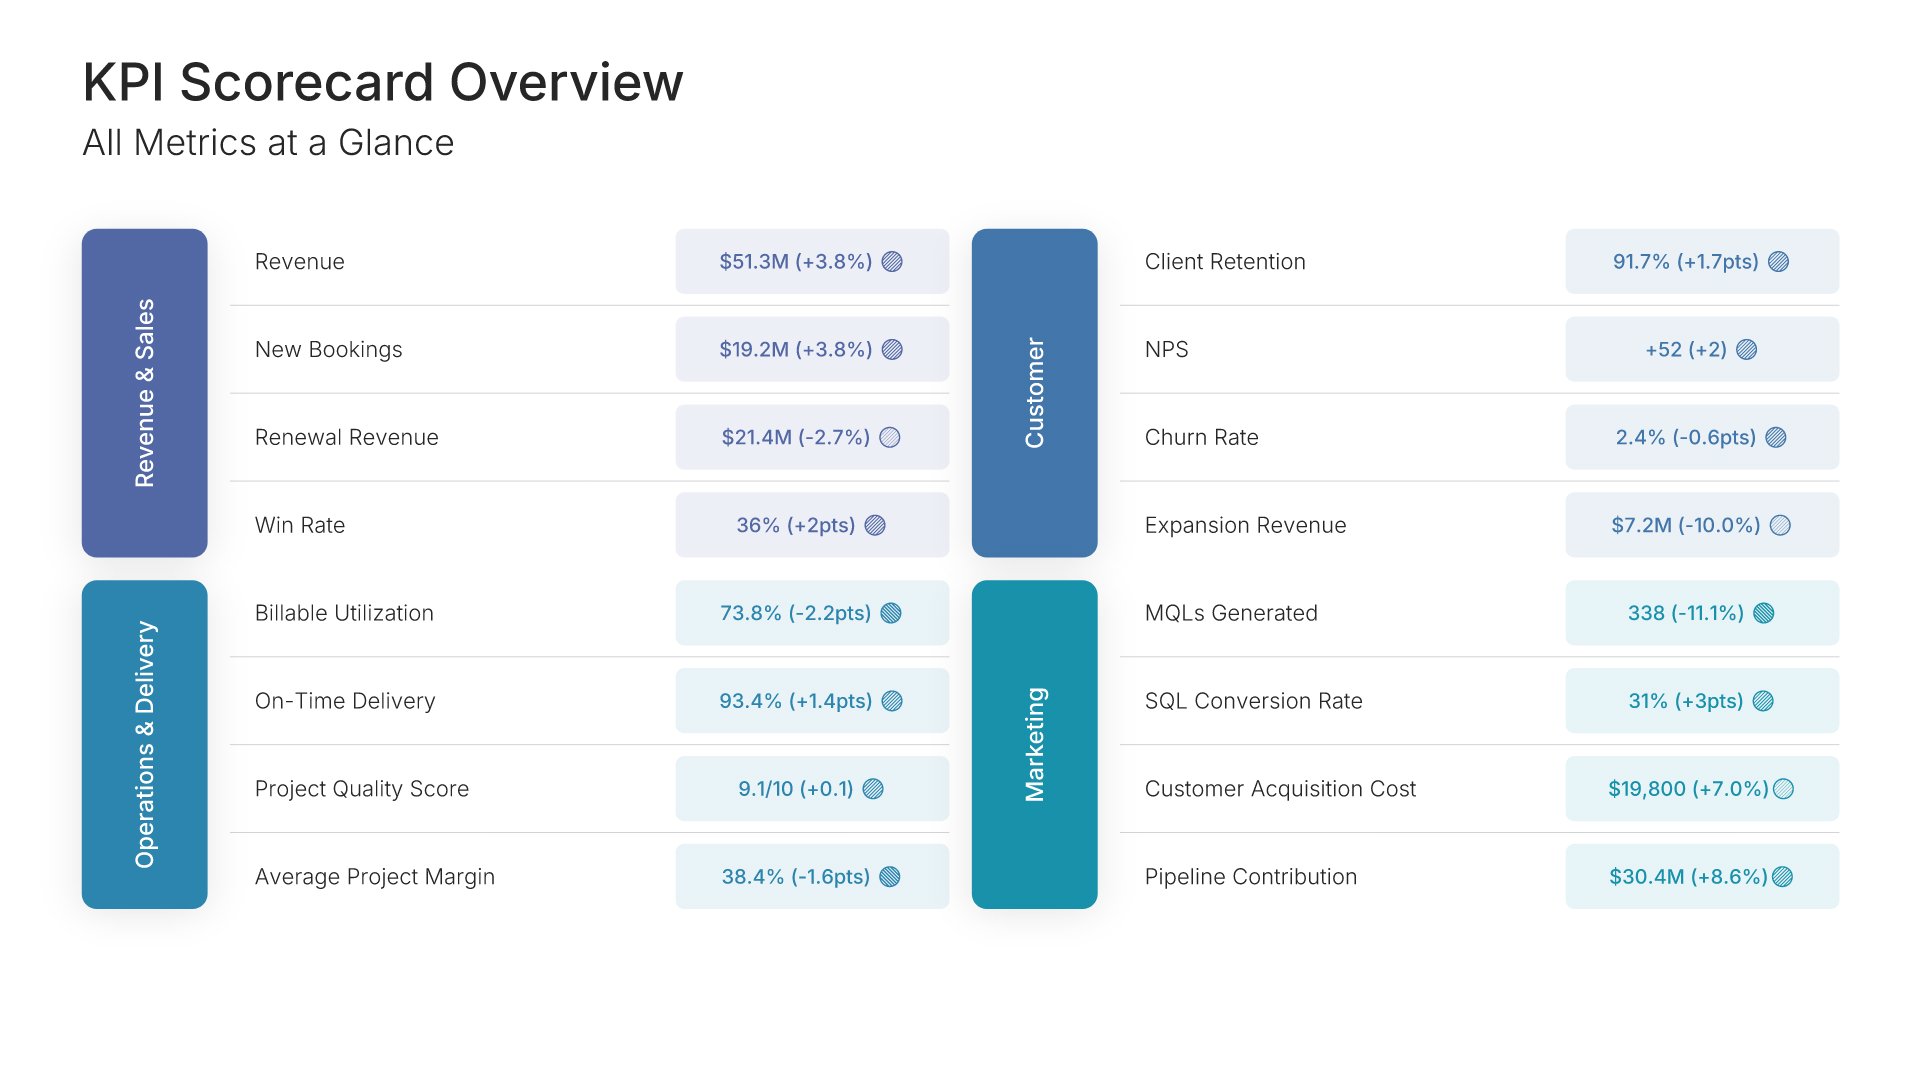
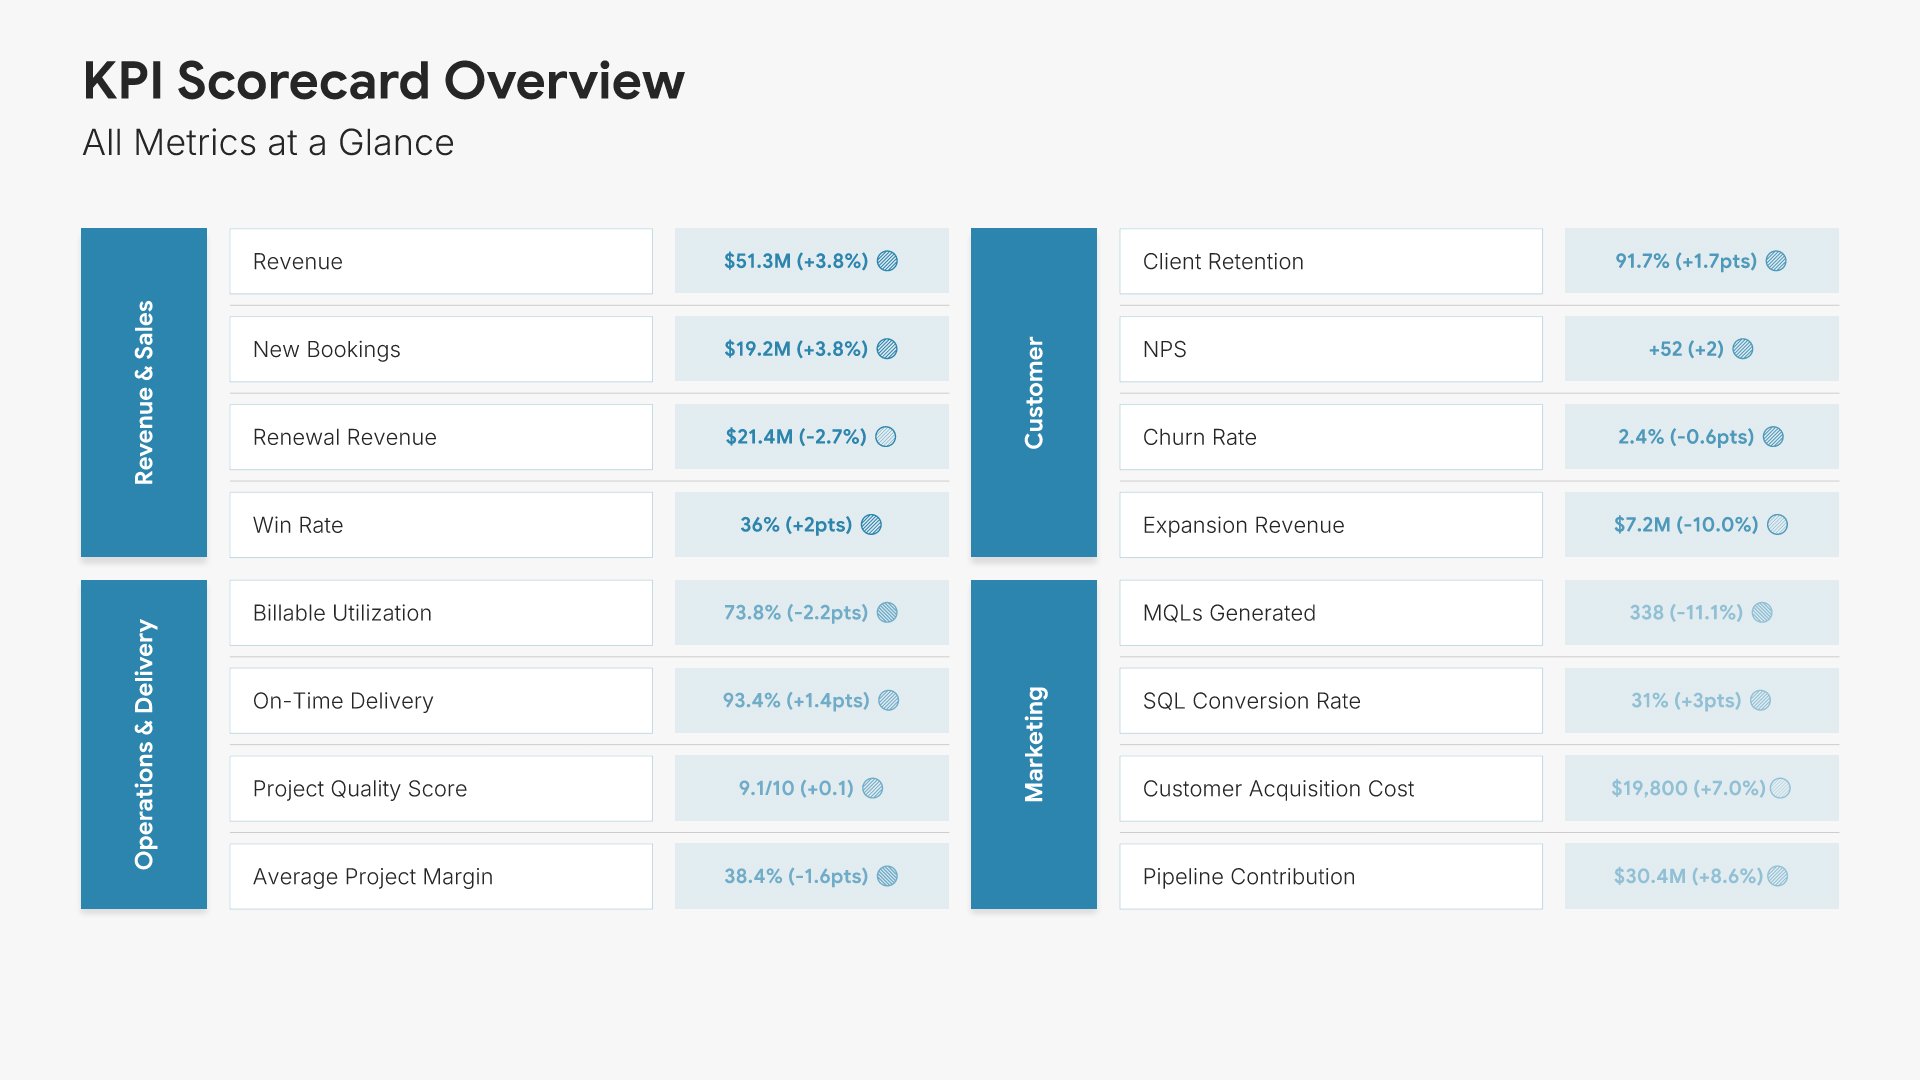
KPI scorecard overview slide, metrics-neutral KPI dashboard template, every metric grouped by function

Slide 03

KPI Scorecard Overview

Every metric on one slide, grouped by function, with target and status.

Built using “Simple Numbers” slide
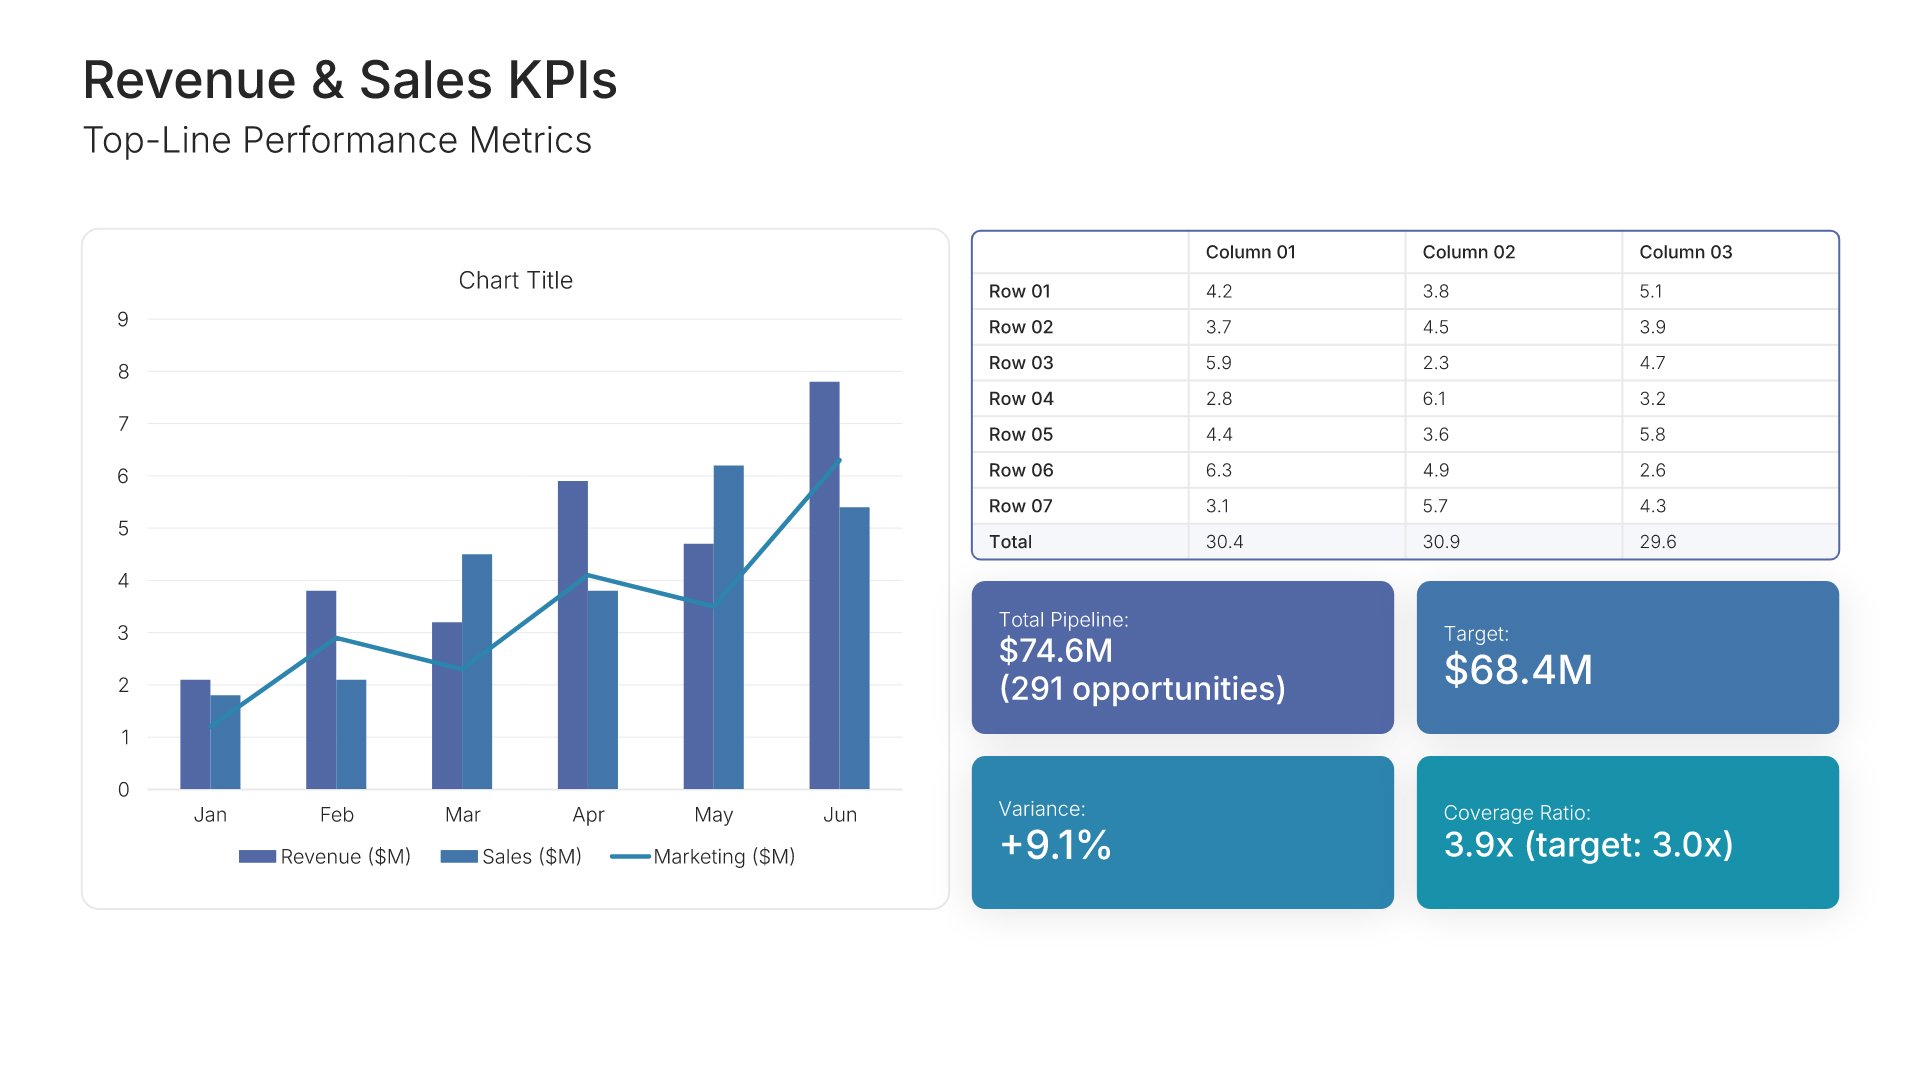
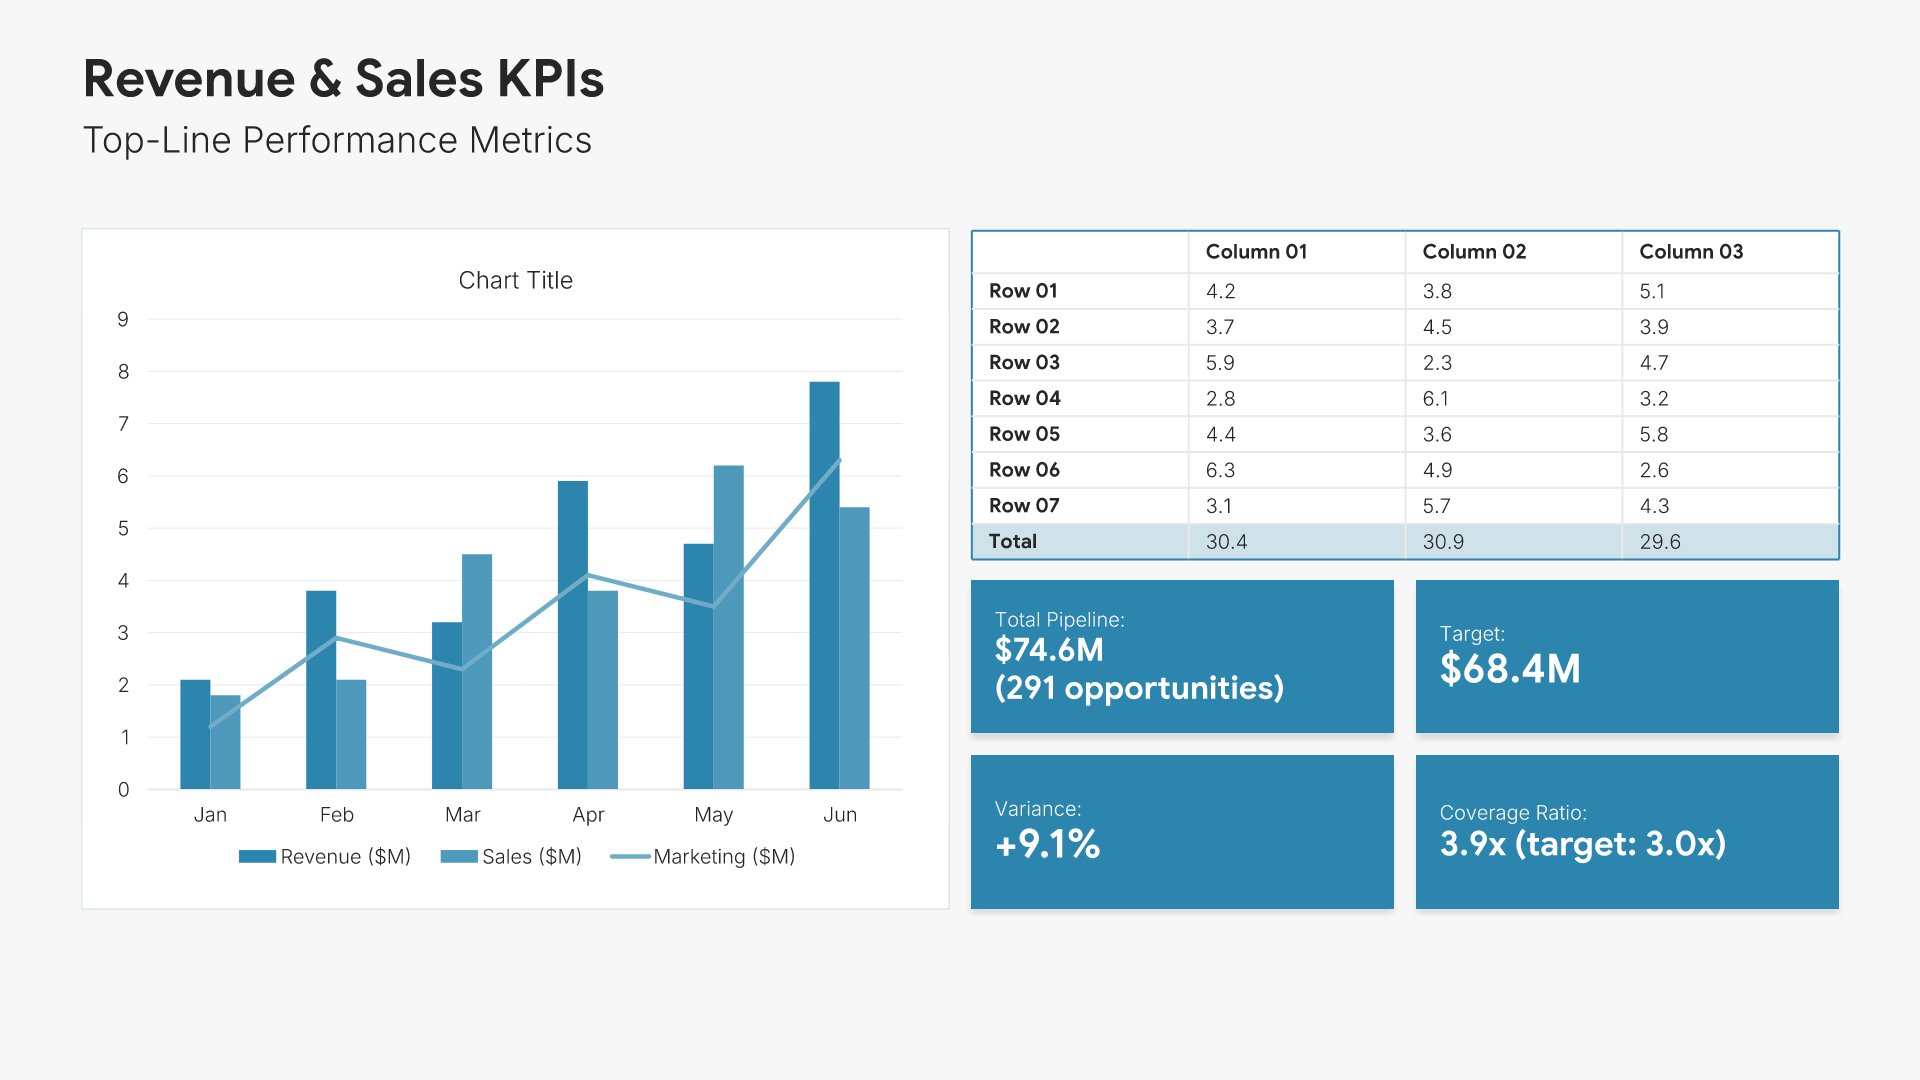
Revenue and sales KPIs slide, metrics-neutral KPI dashboard template, grouped bar chart with supporting table

Slide 04

Revenue & Sales KPIs

Revenue and deal metrics as a grouped bar chart with a supporting table.

Built using “KPI Dashboard” slide
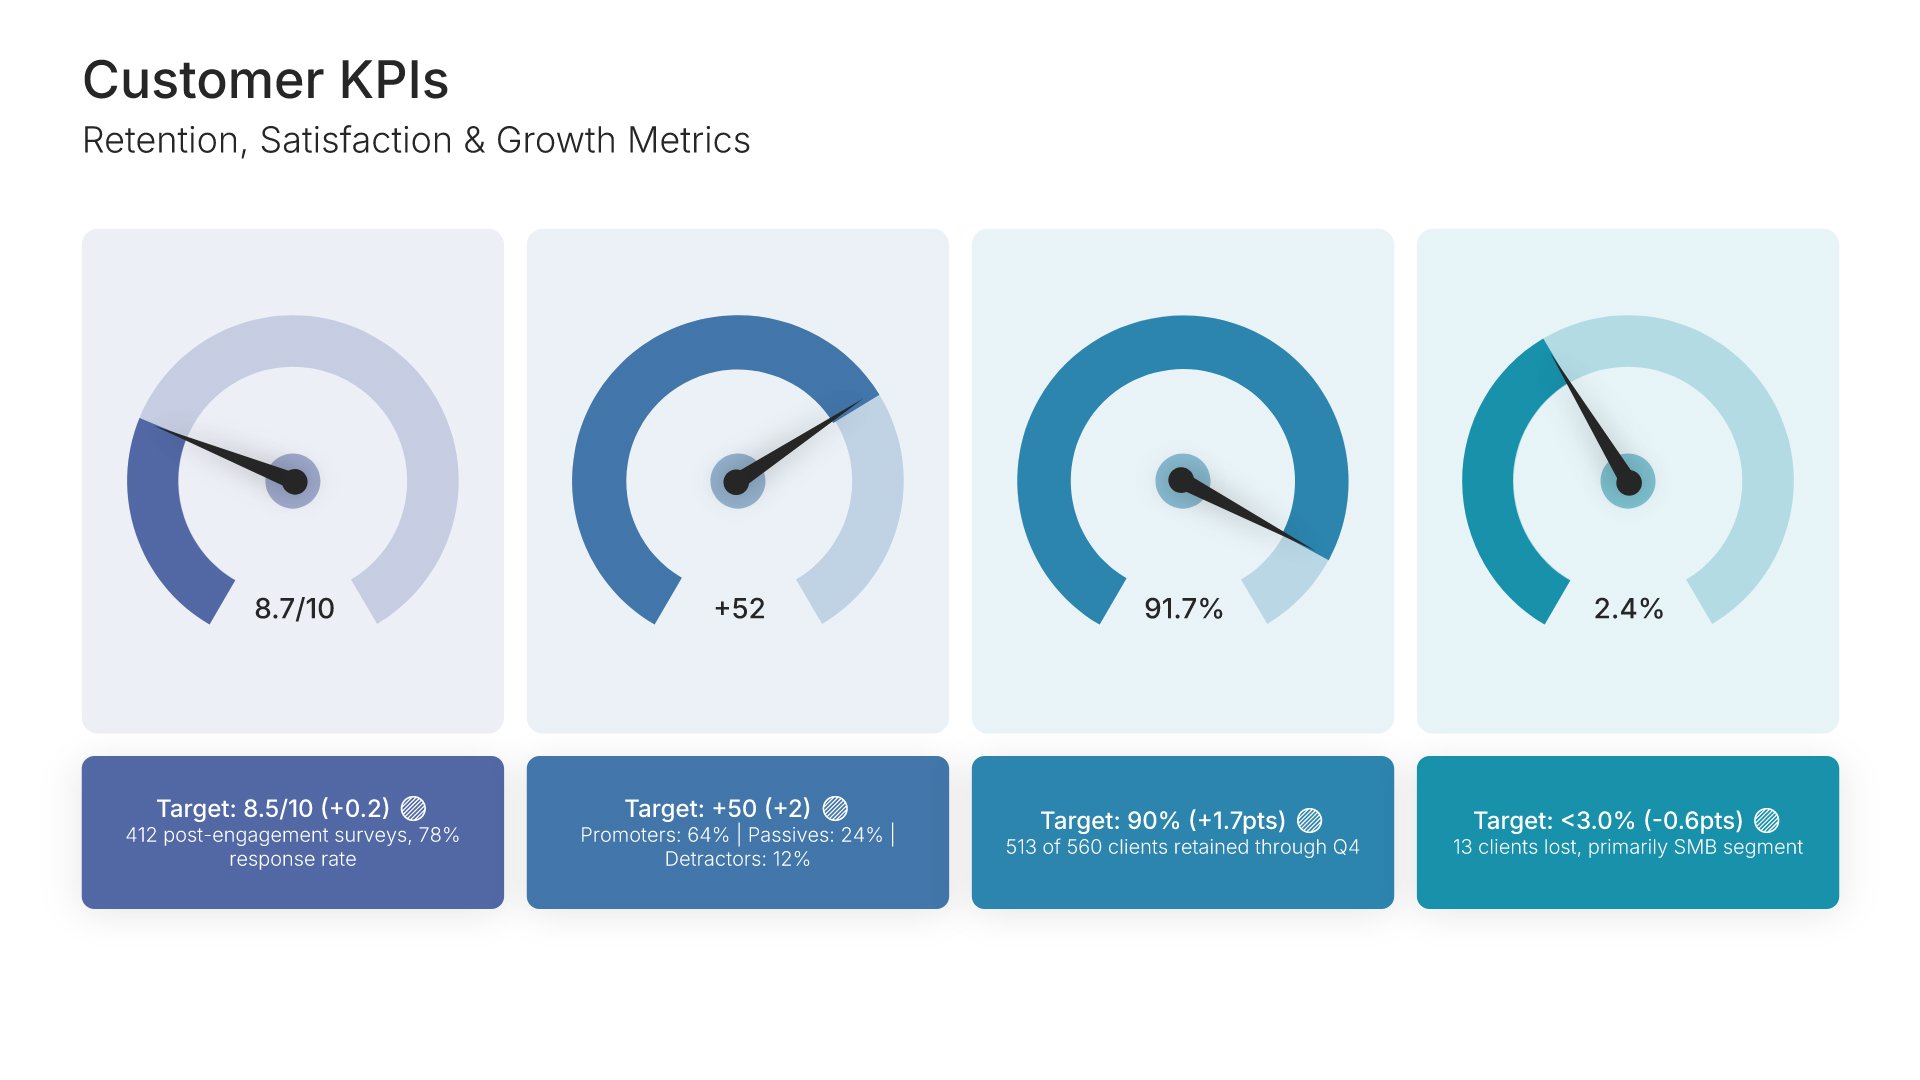
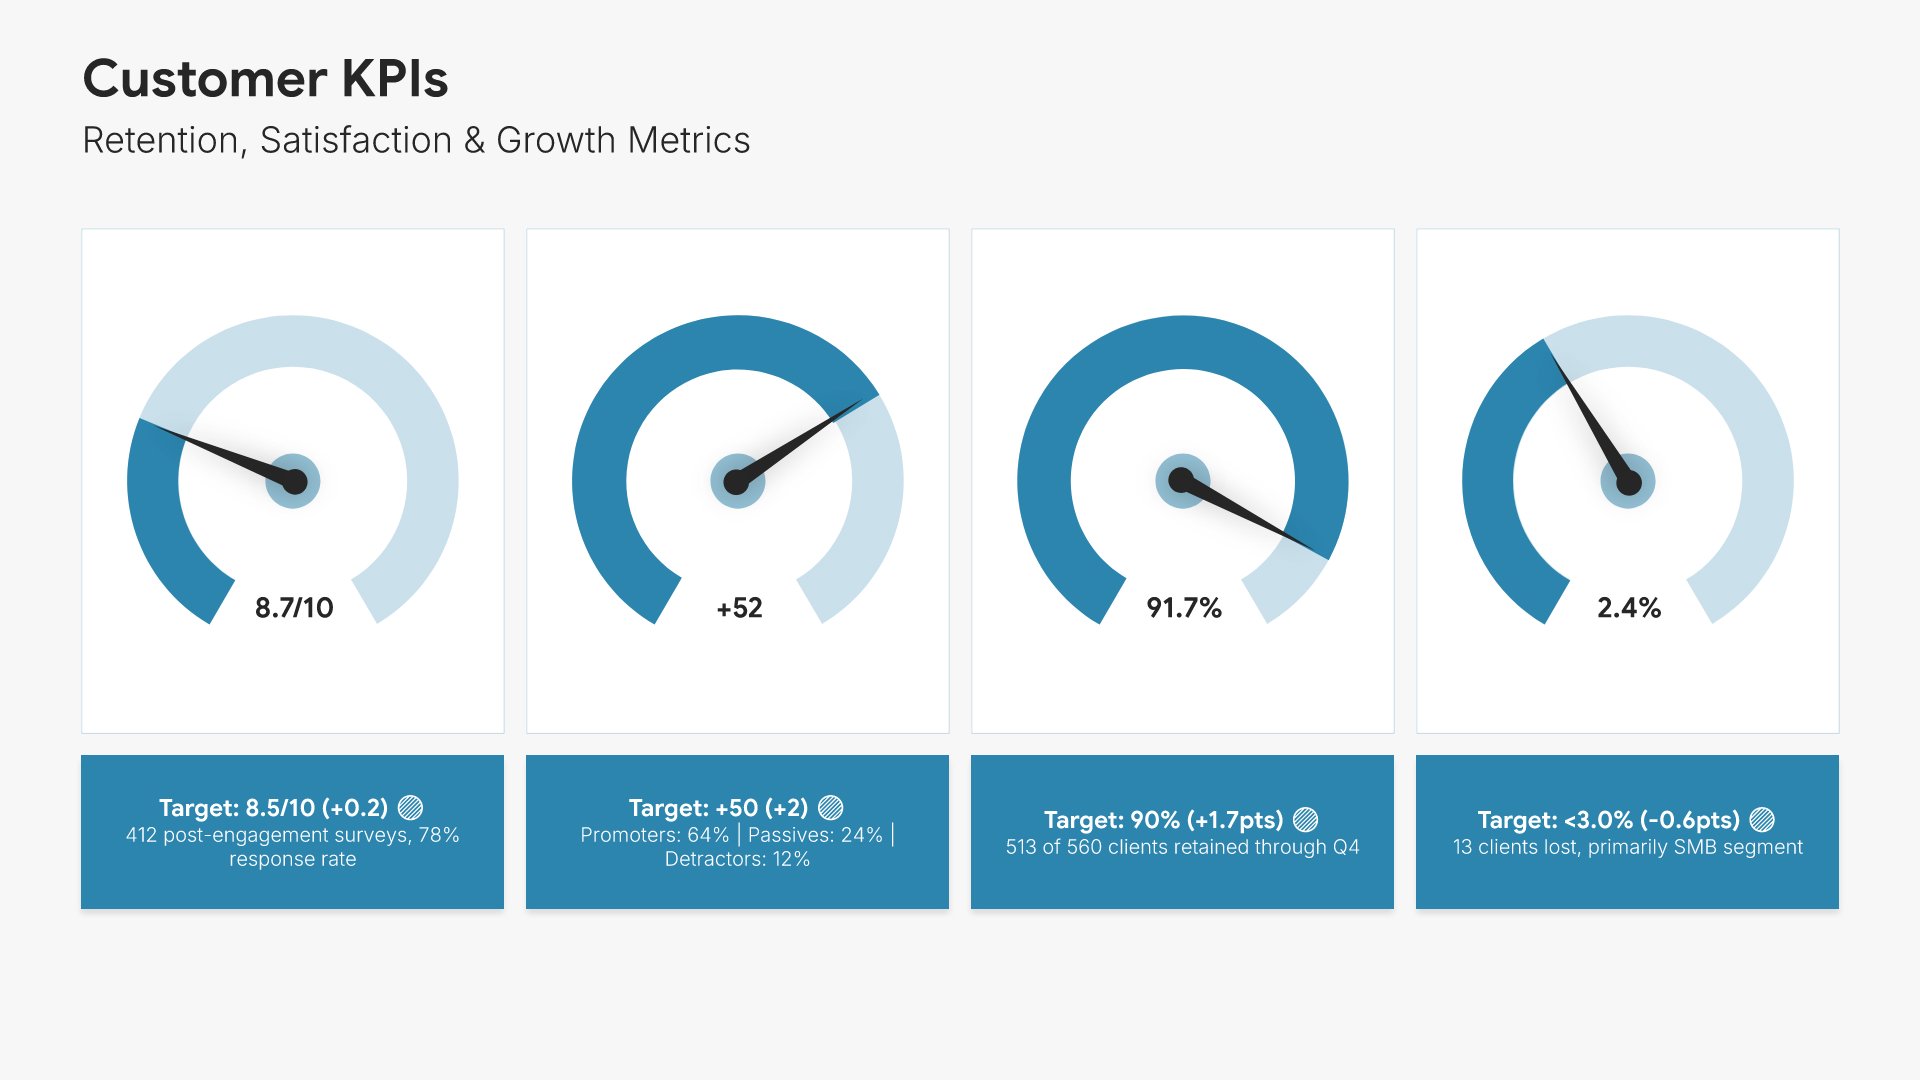
Customer KPIs slide, metrics-neutral KPI dashboard template, retention and satisfaction as gauge dials

Slide 05

Customer KPIs

Retention, satisfaction, and growth as gauge dials, each against its target.

Built using “Data Visualization” slide
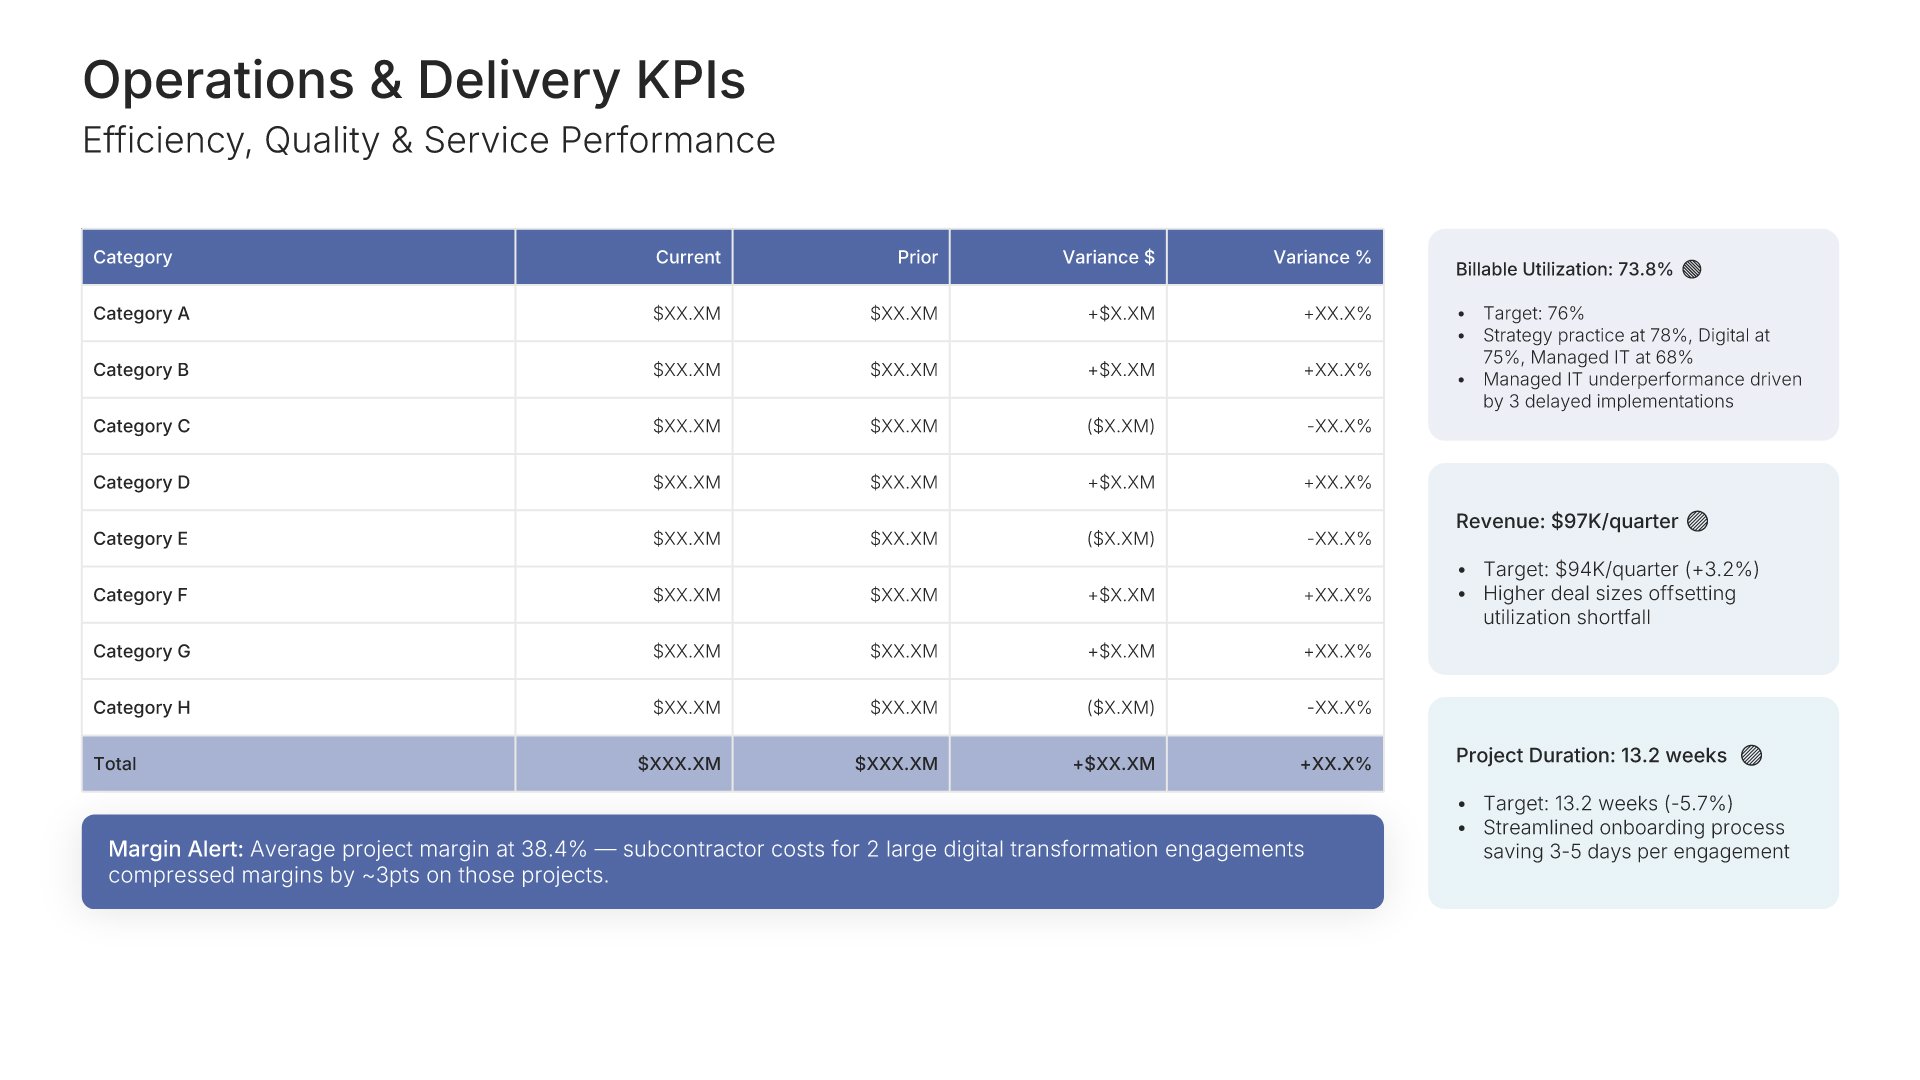
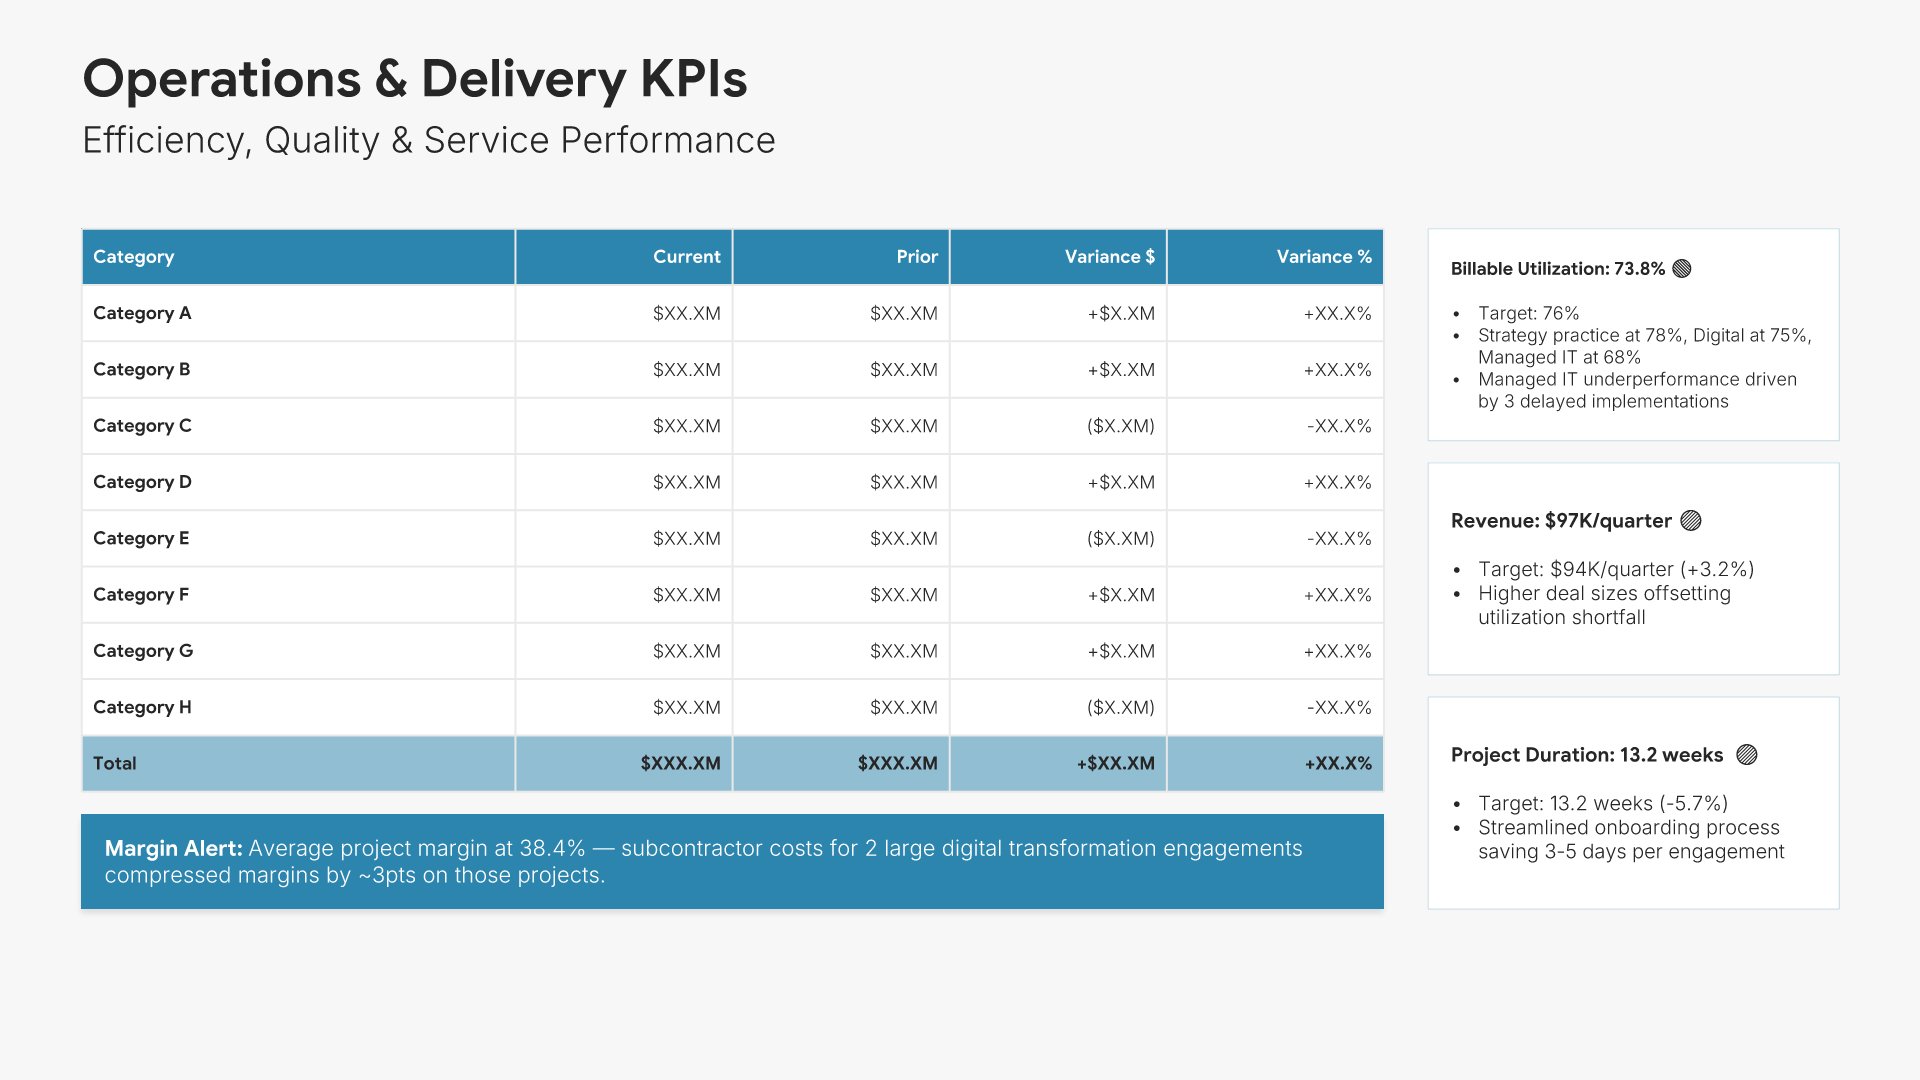
Operations and delivery KPIs slide, metrics-neutral KPI dashboard template, utilization, quality, and service levels

Slide 06

Operations & Delivery KPIs

Utilization, delivery, quality, and cycle time, with service levels alongside.

Built using “Financial Table” slide
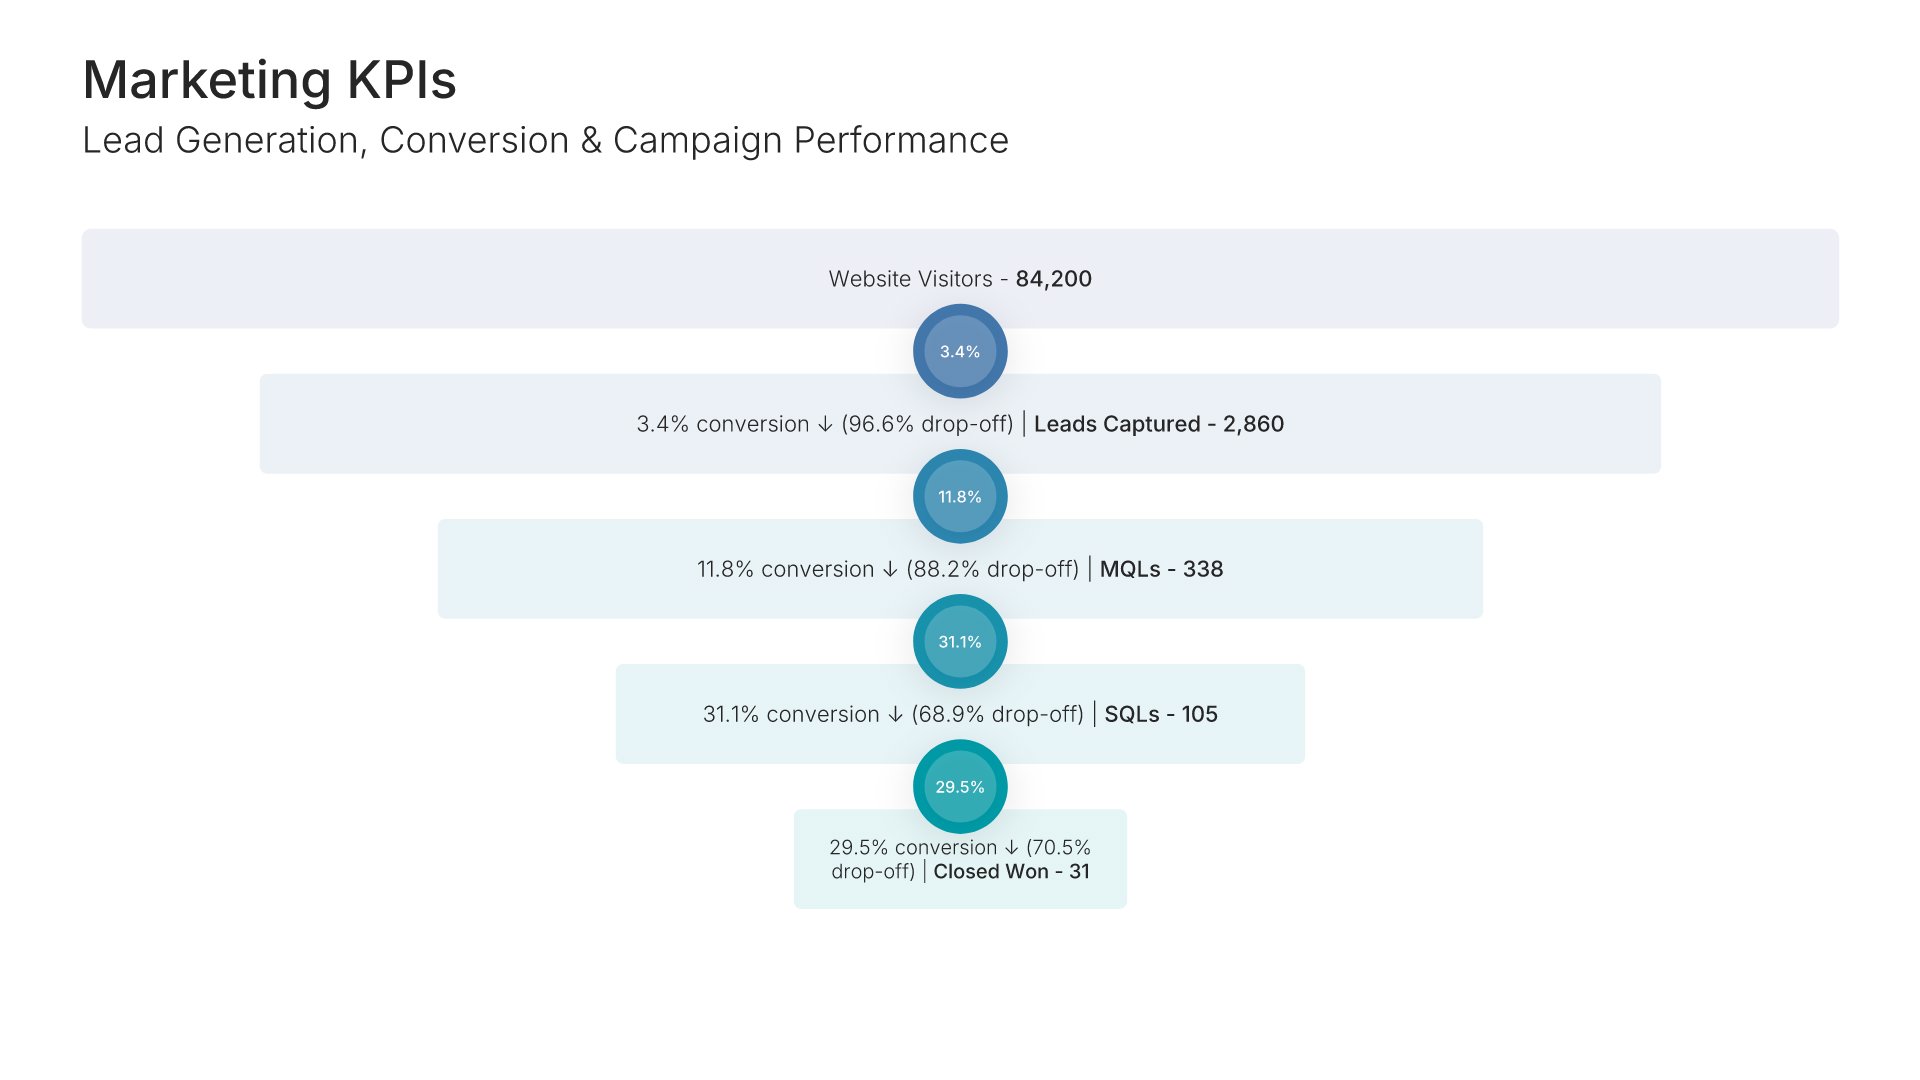
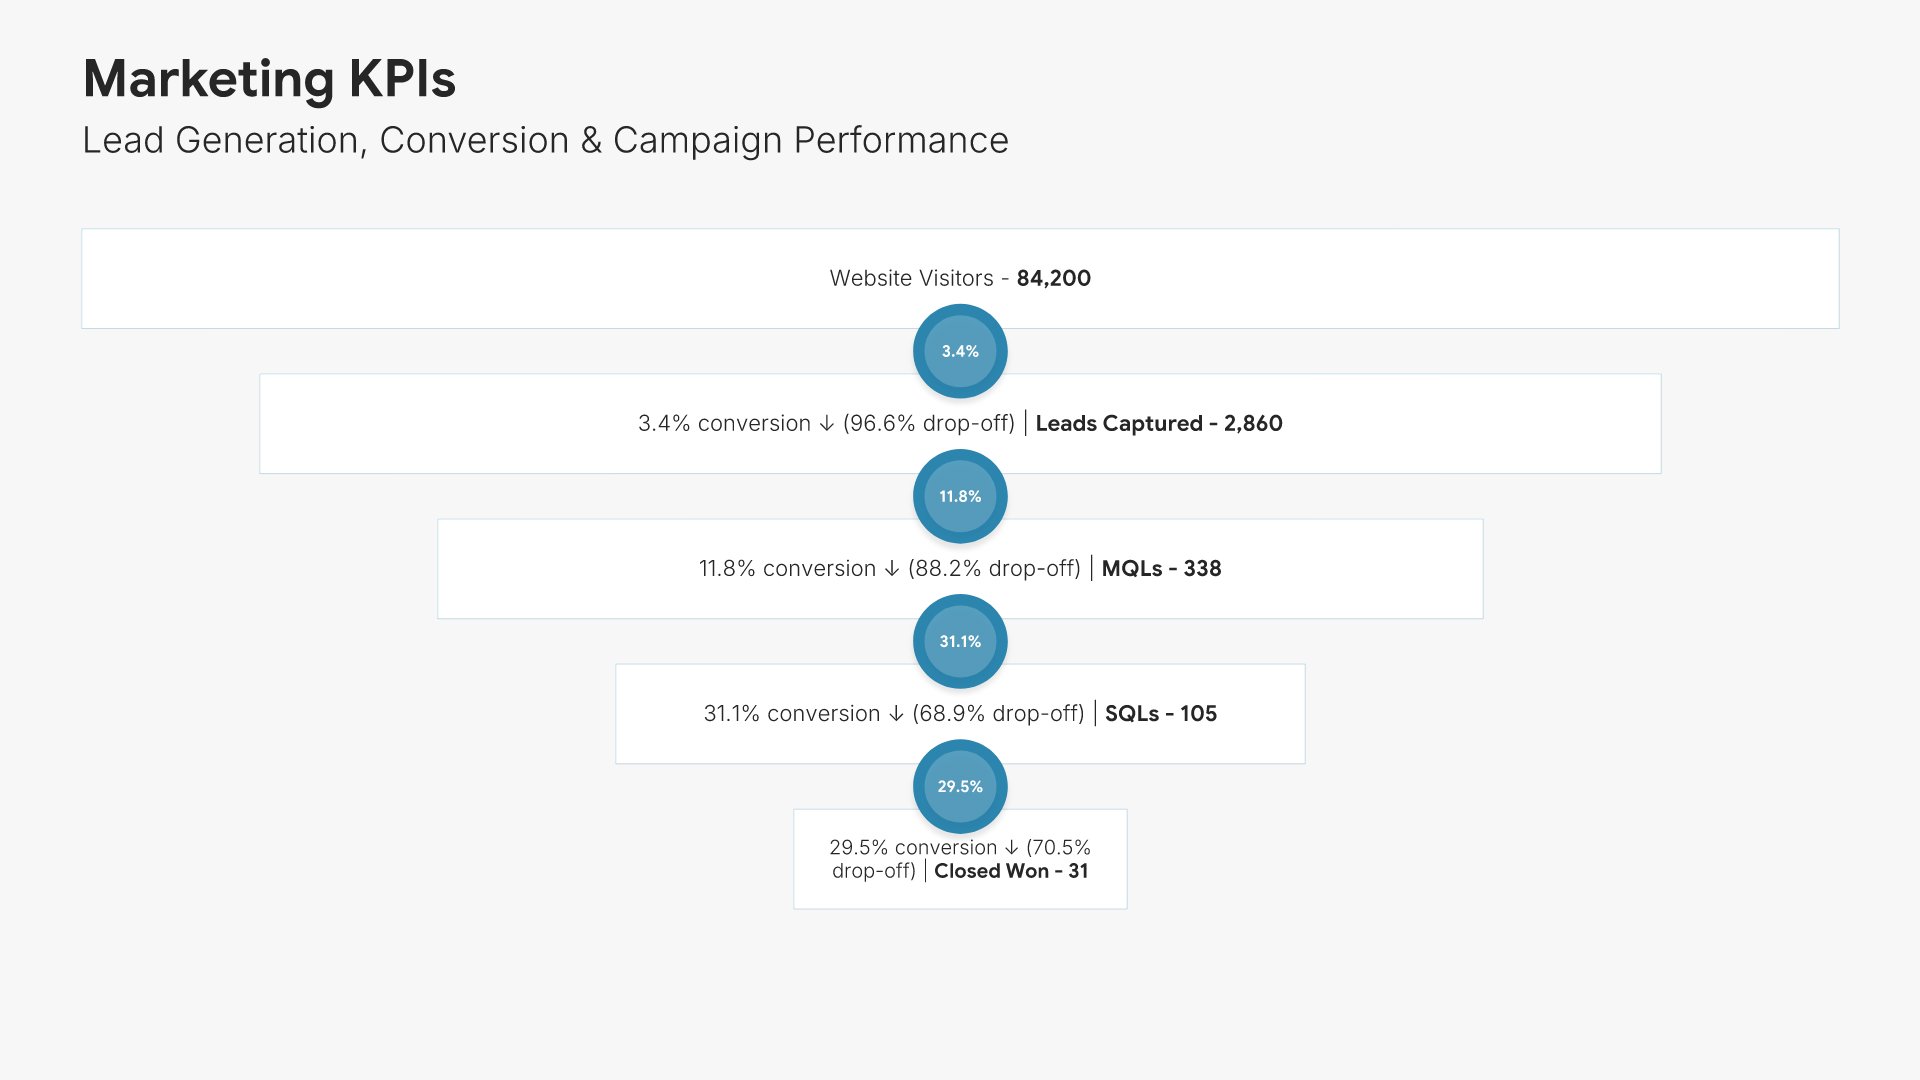
Marketing KPIs slide, metrics-neutral KPI dashboard template, lead funnel from visitors to customers

Slide 07

Marketing KPIs

Lead generation as a funnel, from visitors through to closed customers.

Built using “Funnel Infographics” slide
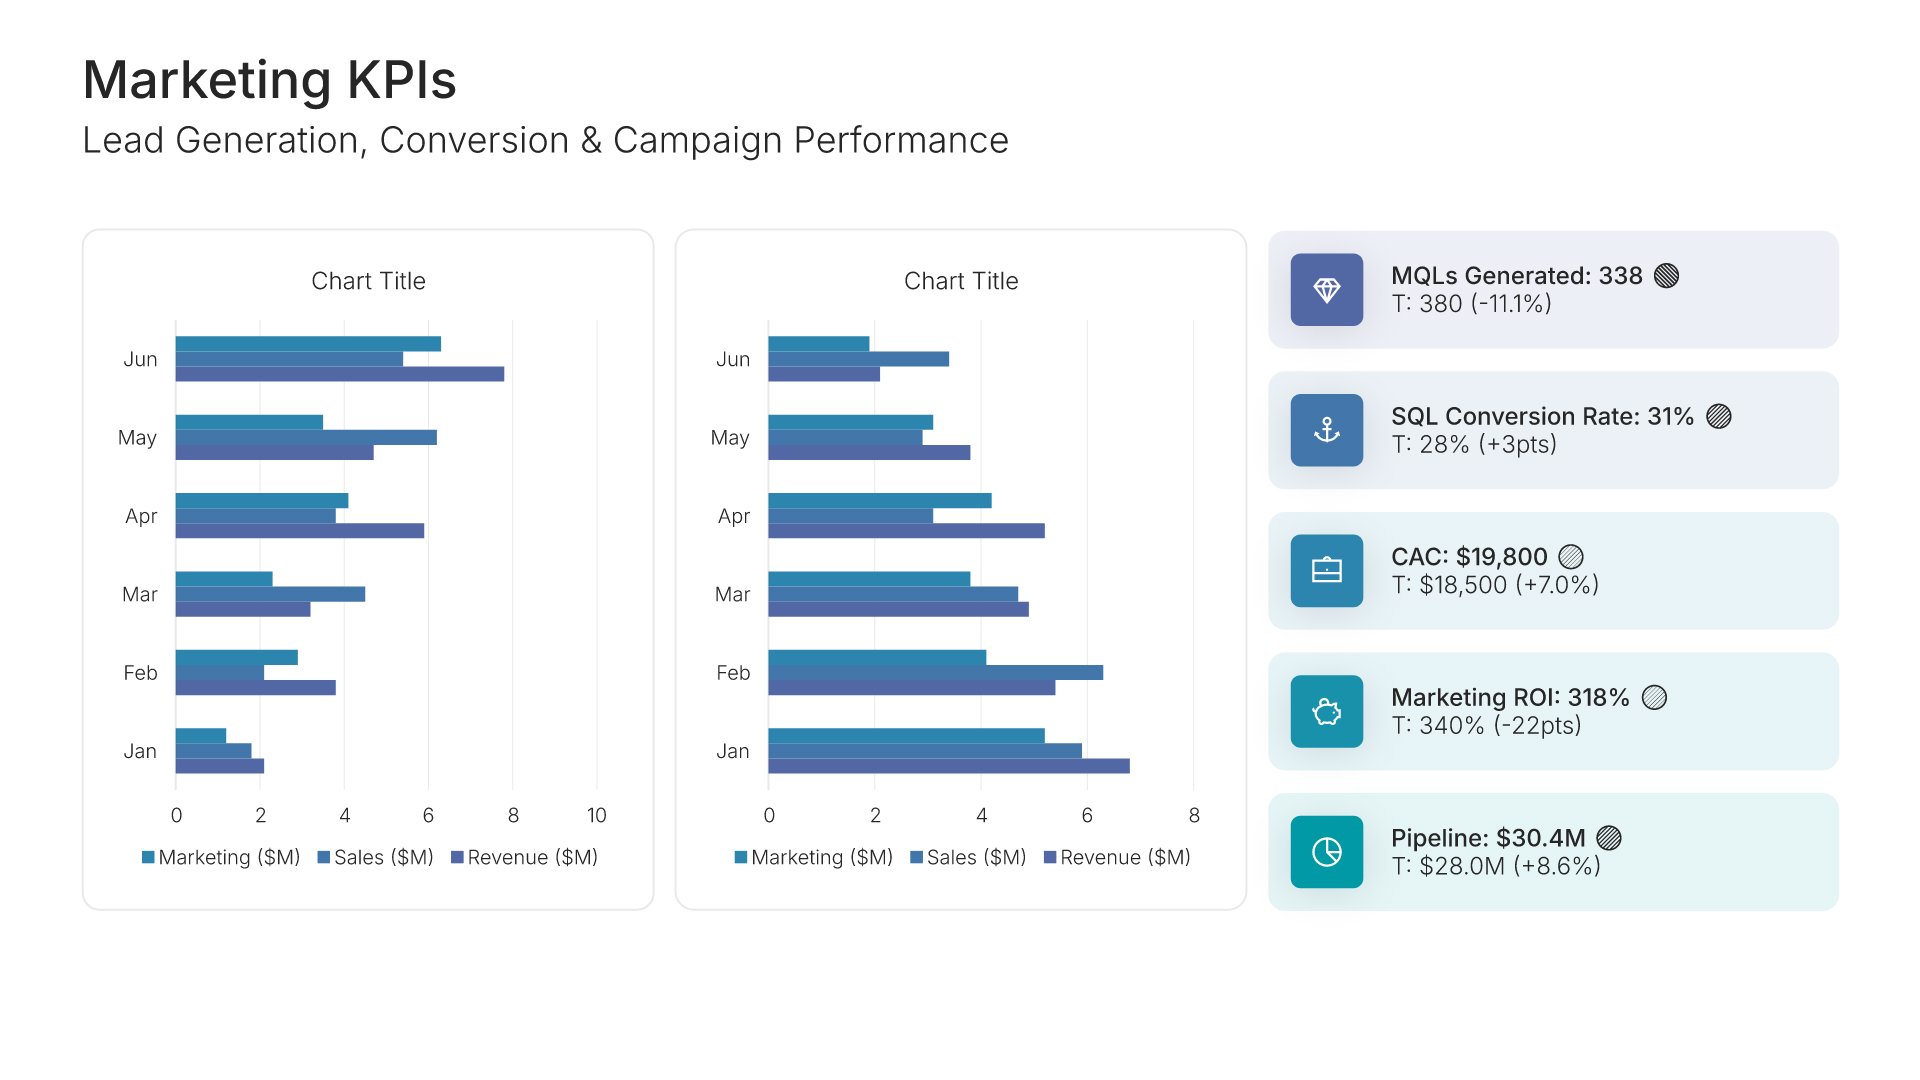
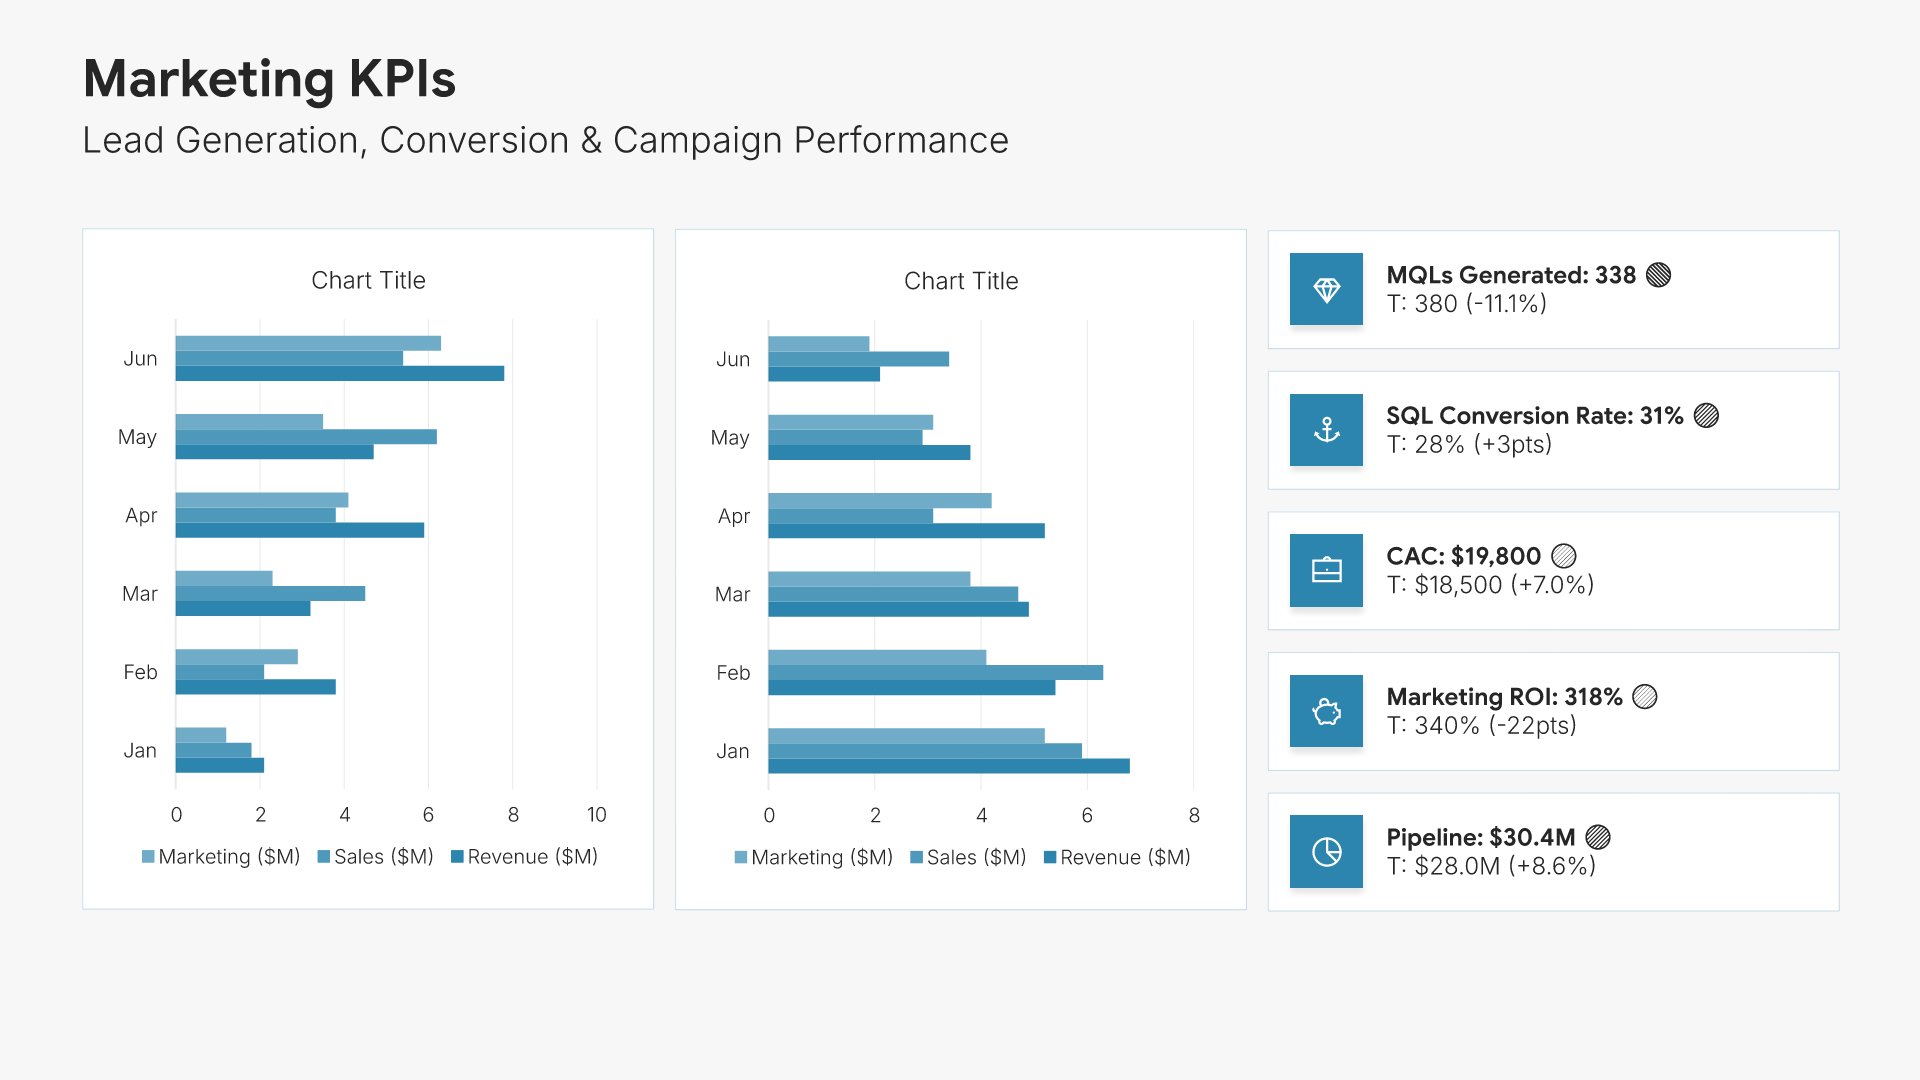
Marketing KPIs slide, metrics-neutral KPI dashboard template, marketing metrics as horizontal bar charts

Slide 08

Marketing KPIs

Marketing metrics as horizontal bar charts.

Built using “Charts” slide
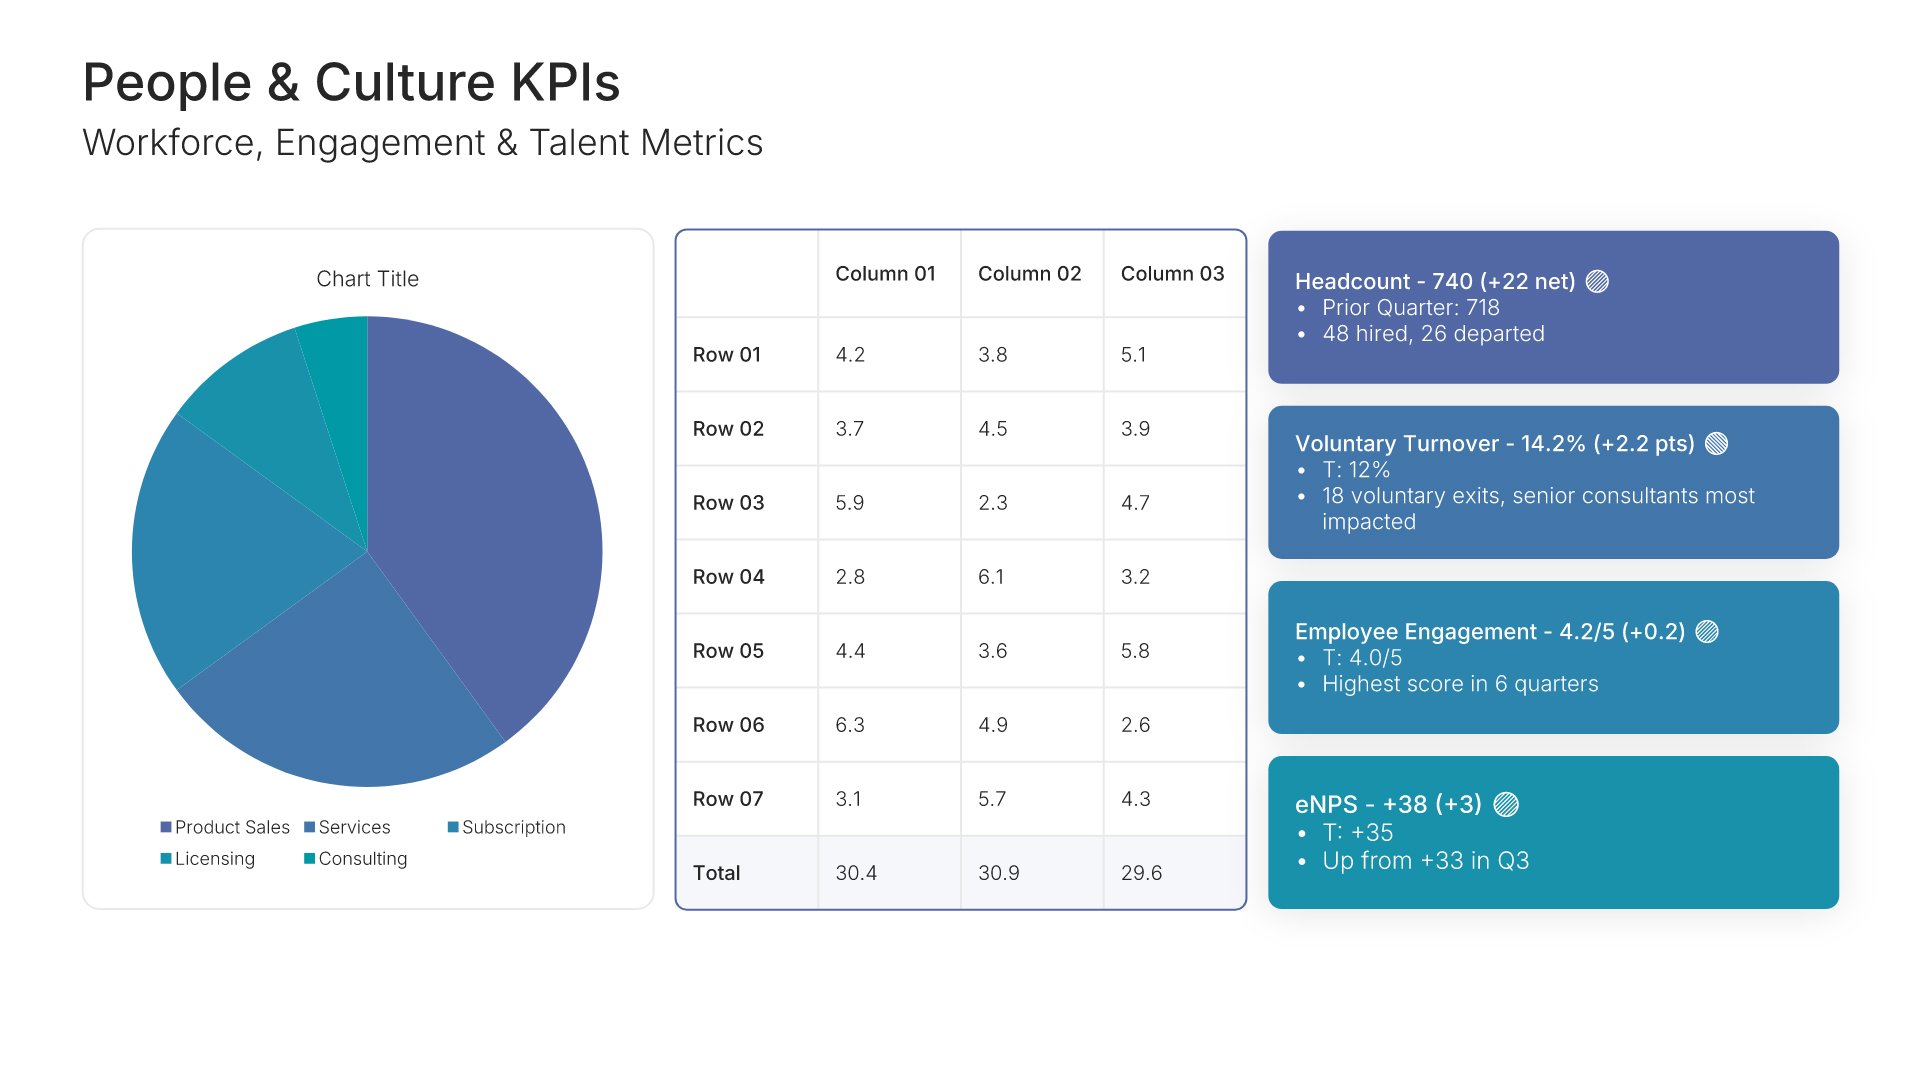
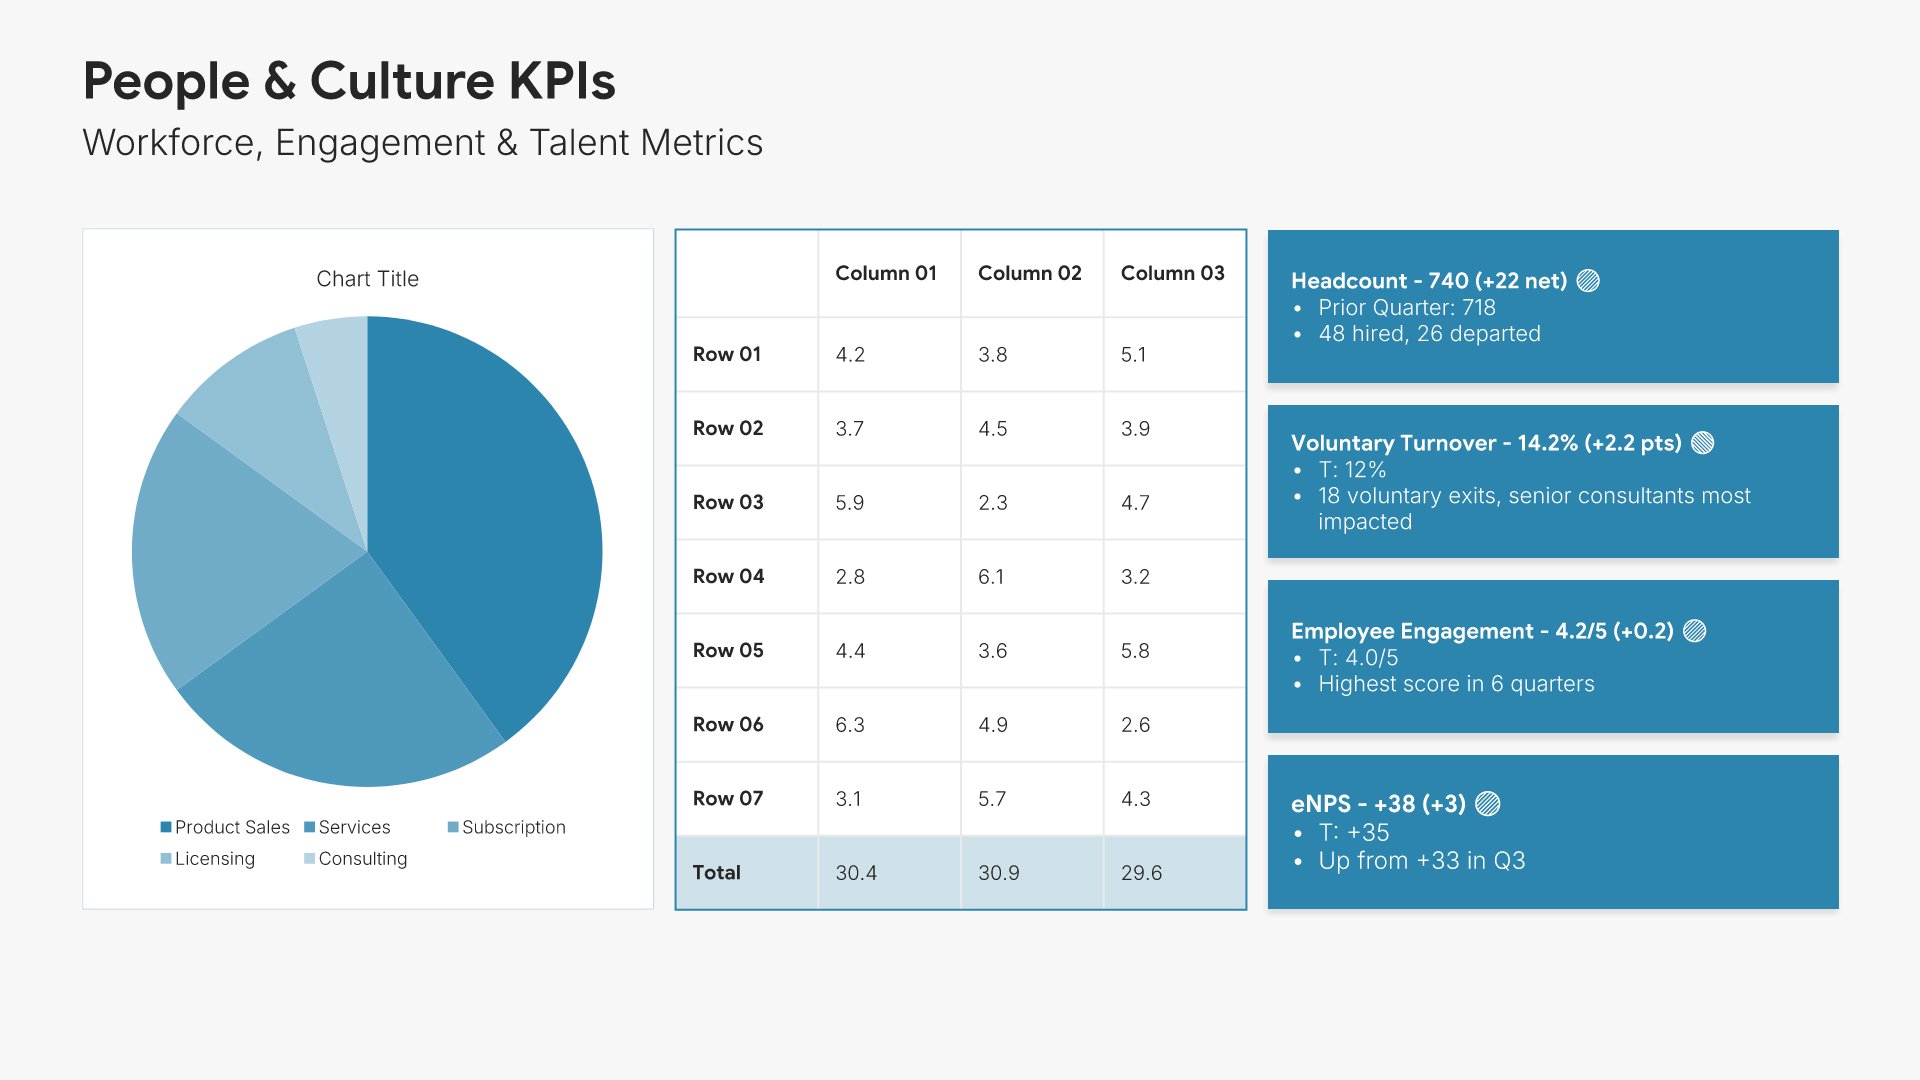
People and culture KPIs slide, metrics-neutral KPI dashboard template, headcount, turnover, and engagement

Slide 09

People & Culture KPIs

Headcount breakdown, with turnover, engagement, and hiring velocity beside it.

Built using “KPI Dashboard” slide
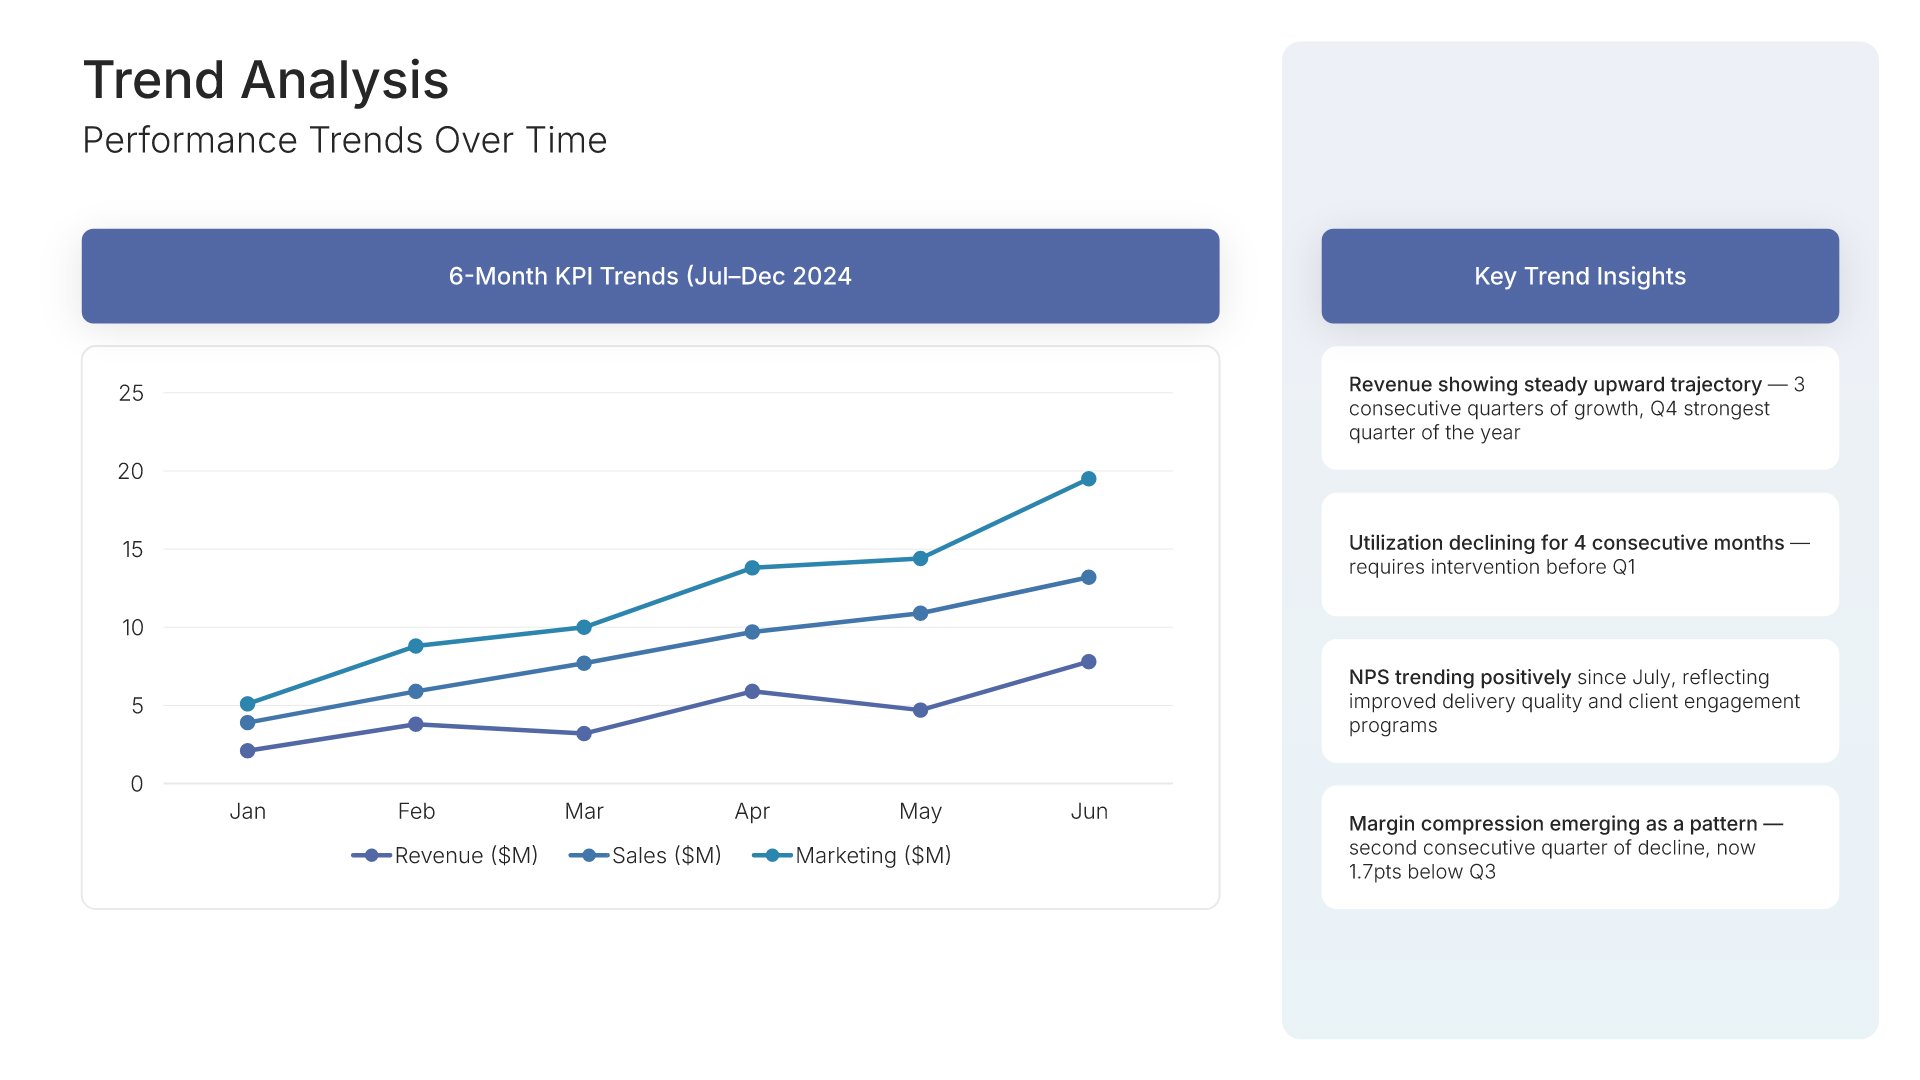
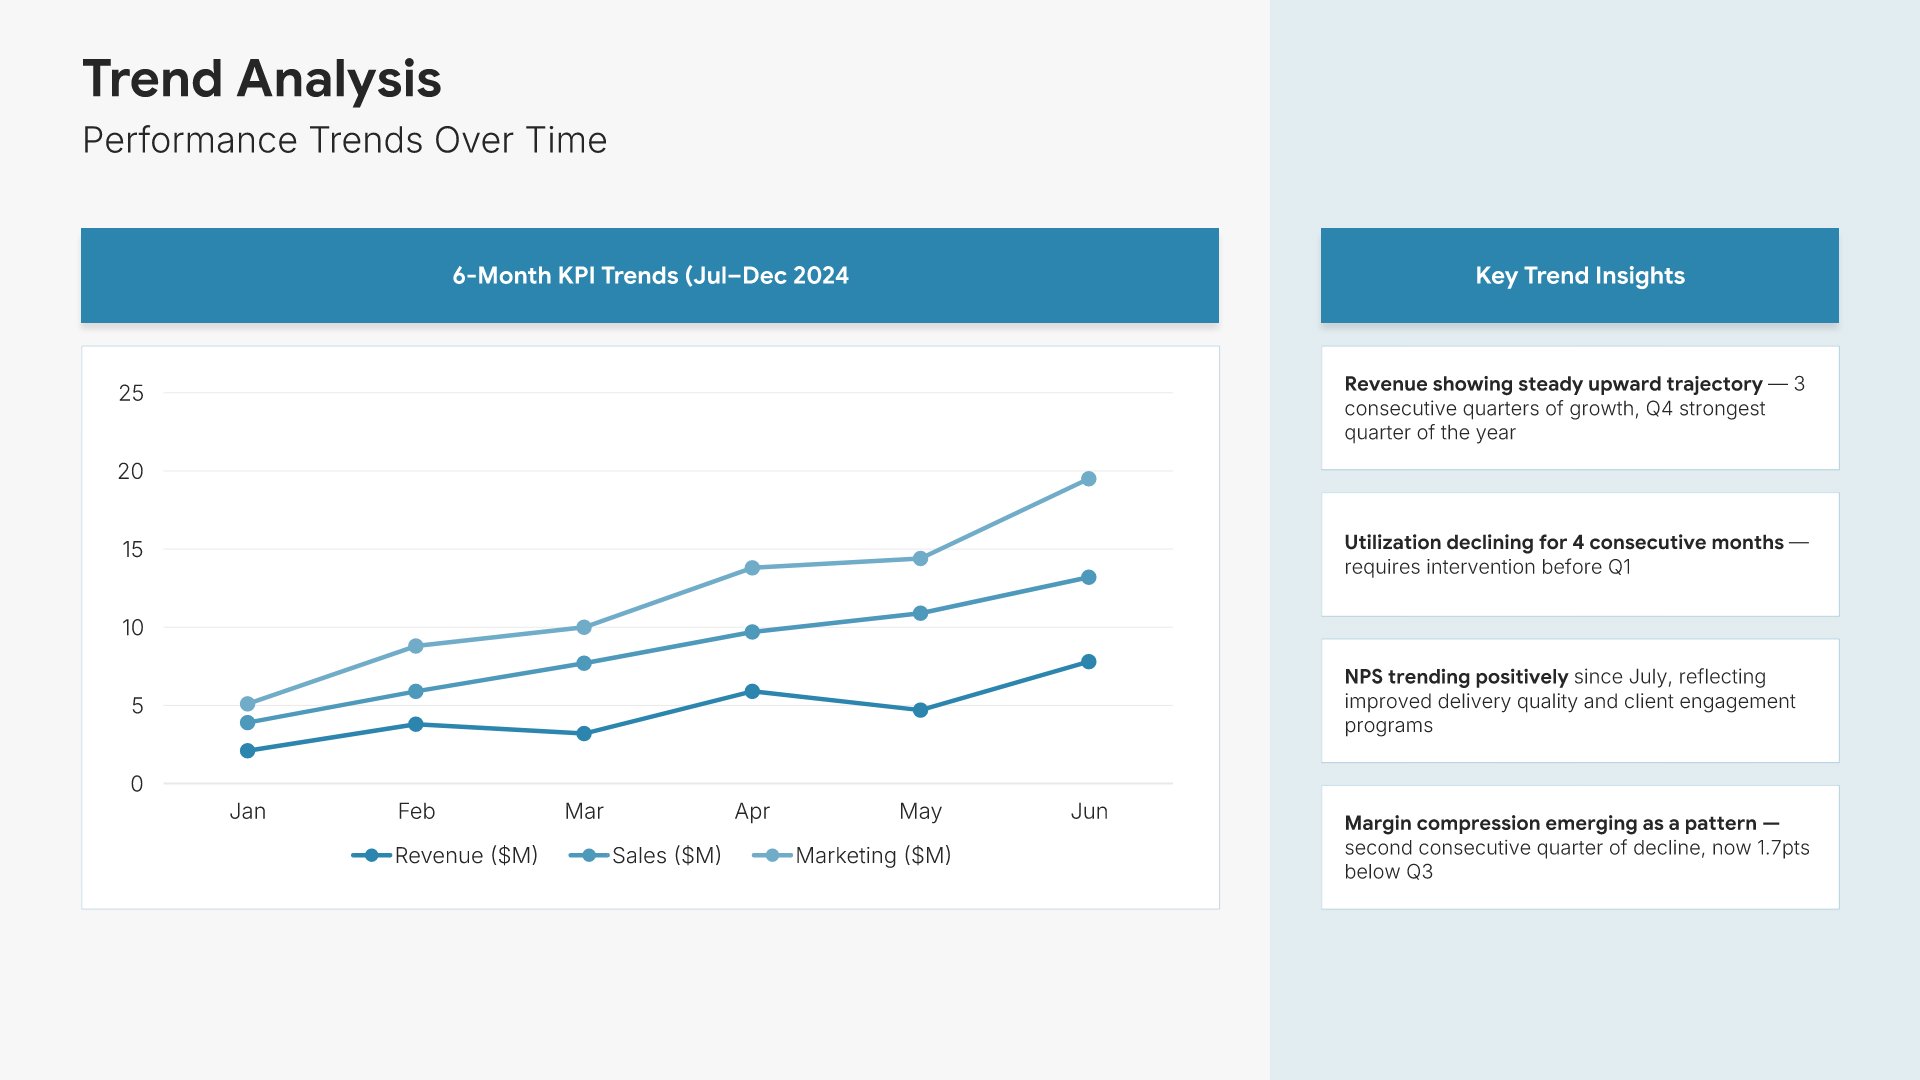
Trend analysis slide, metrics-neutral KPI dashboard template, twelve months with direction on each

Slide 10

Trend Analysis

Twelve months of movement across the headline metrics, with direction on each.

Built using “Charts” slide
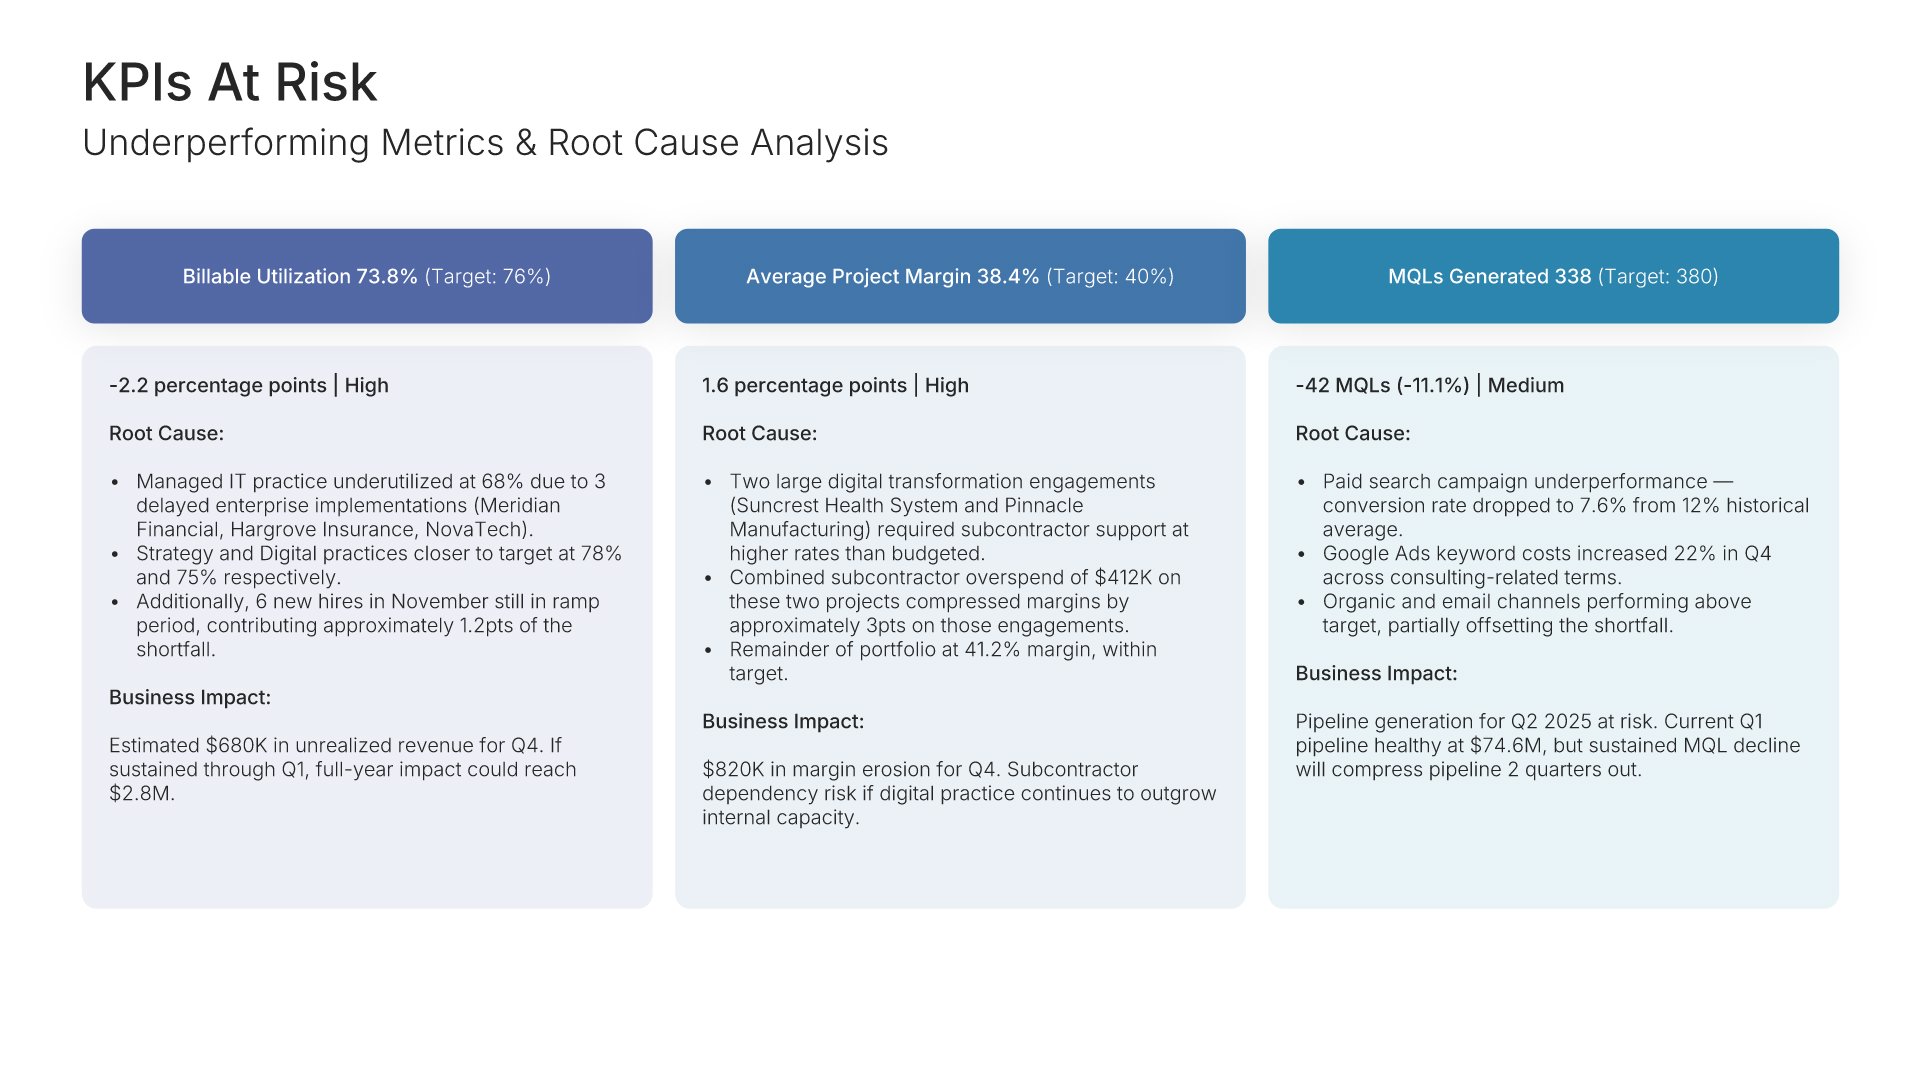
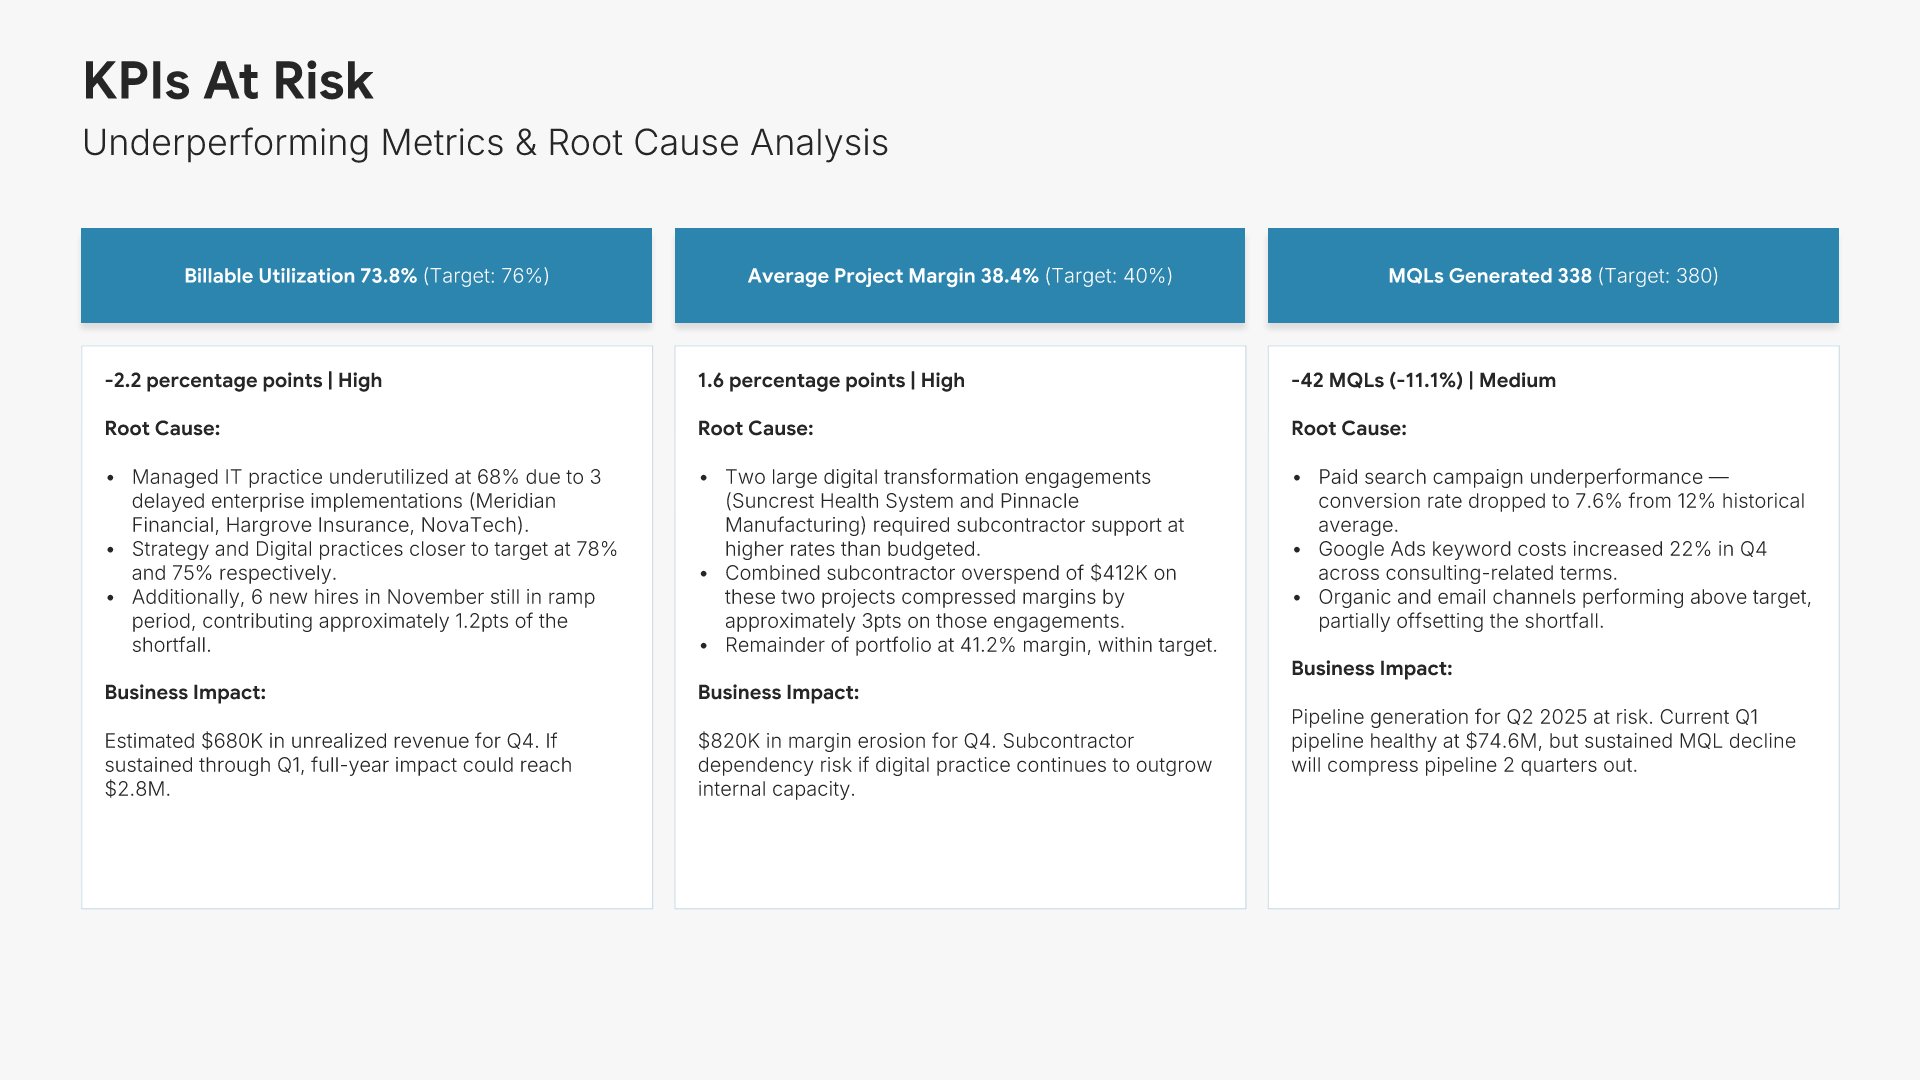
KPIs at risk slide, metrics-neutral KPI dashboard template, root cause and proposed action

Slide 11

KPIs At Risk

The metrics that missed, each with root cause and the action proposed.

Built using “Executive Summary” slide
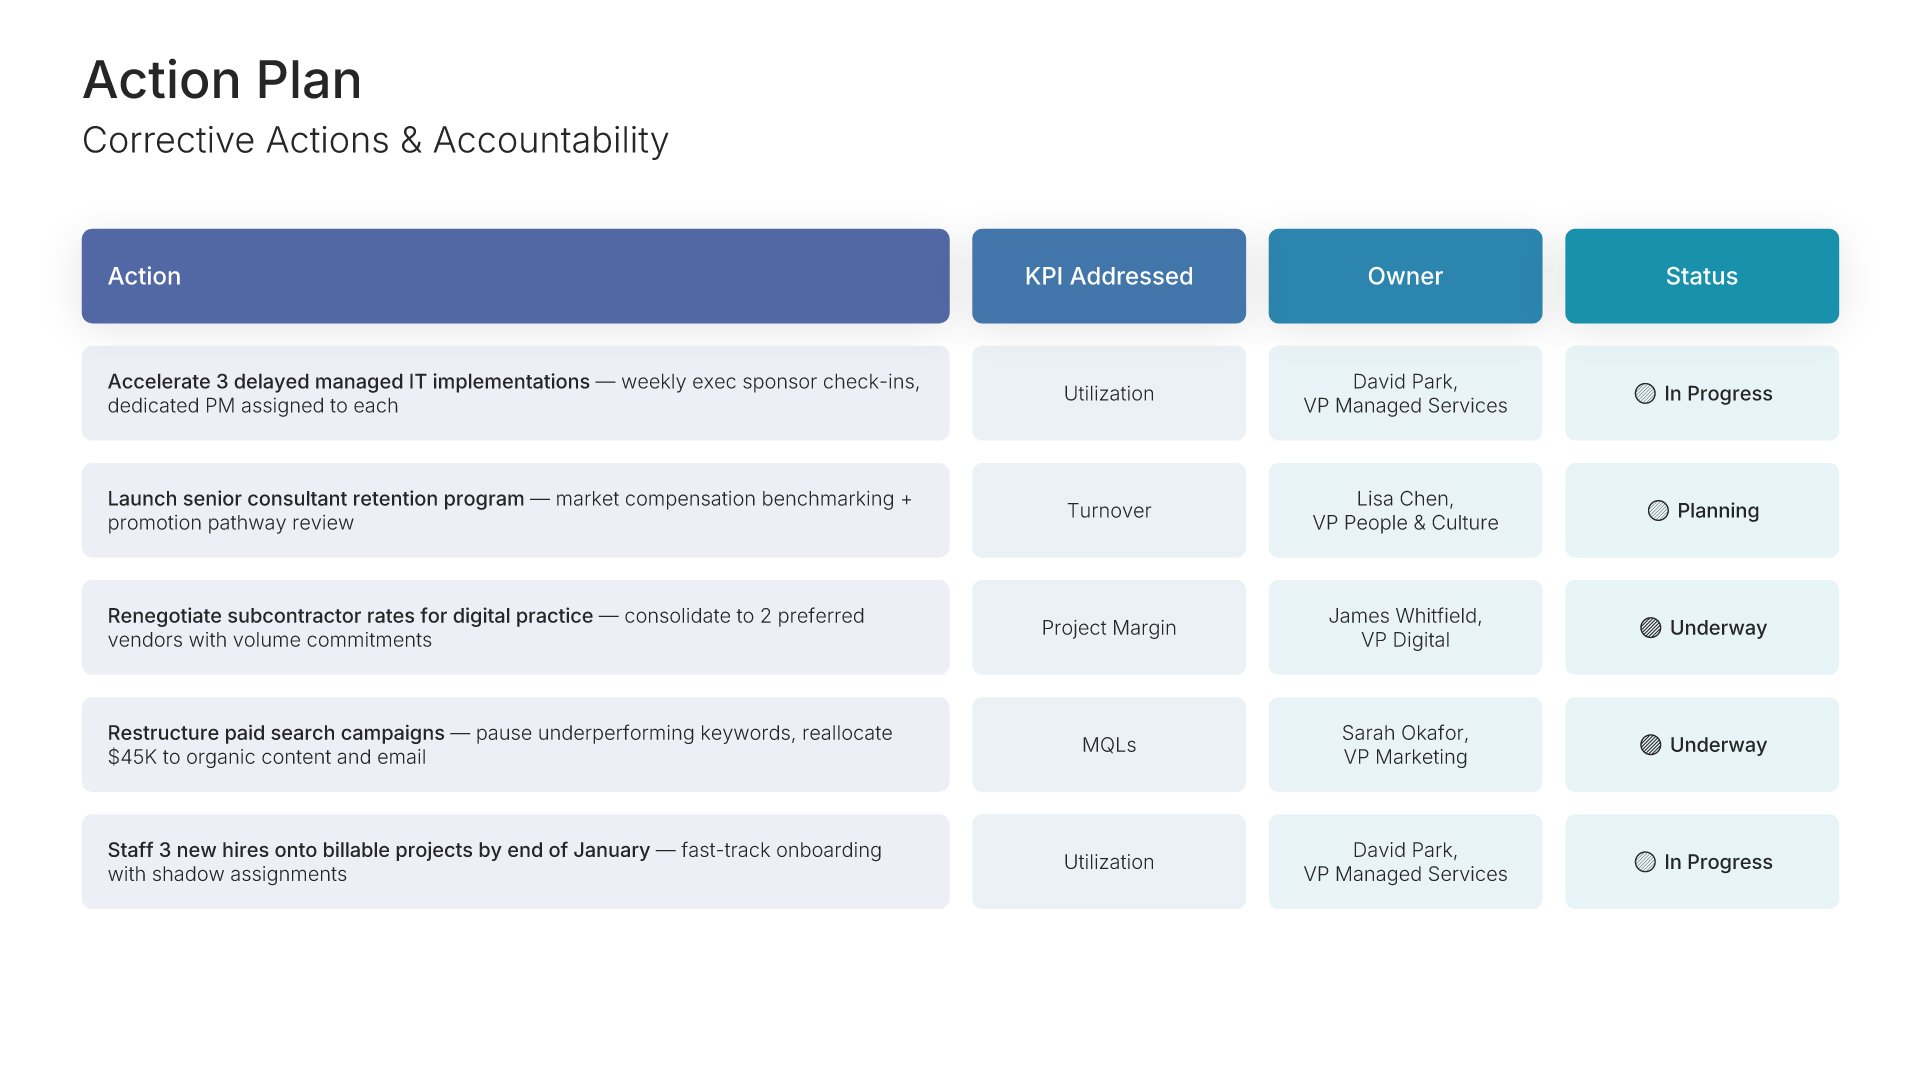
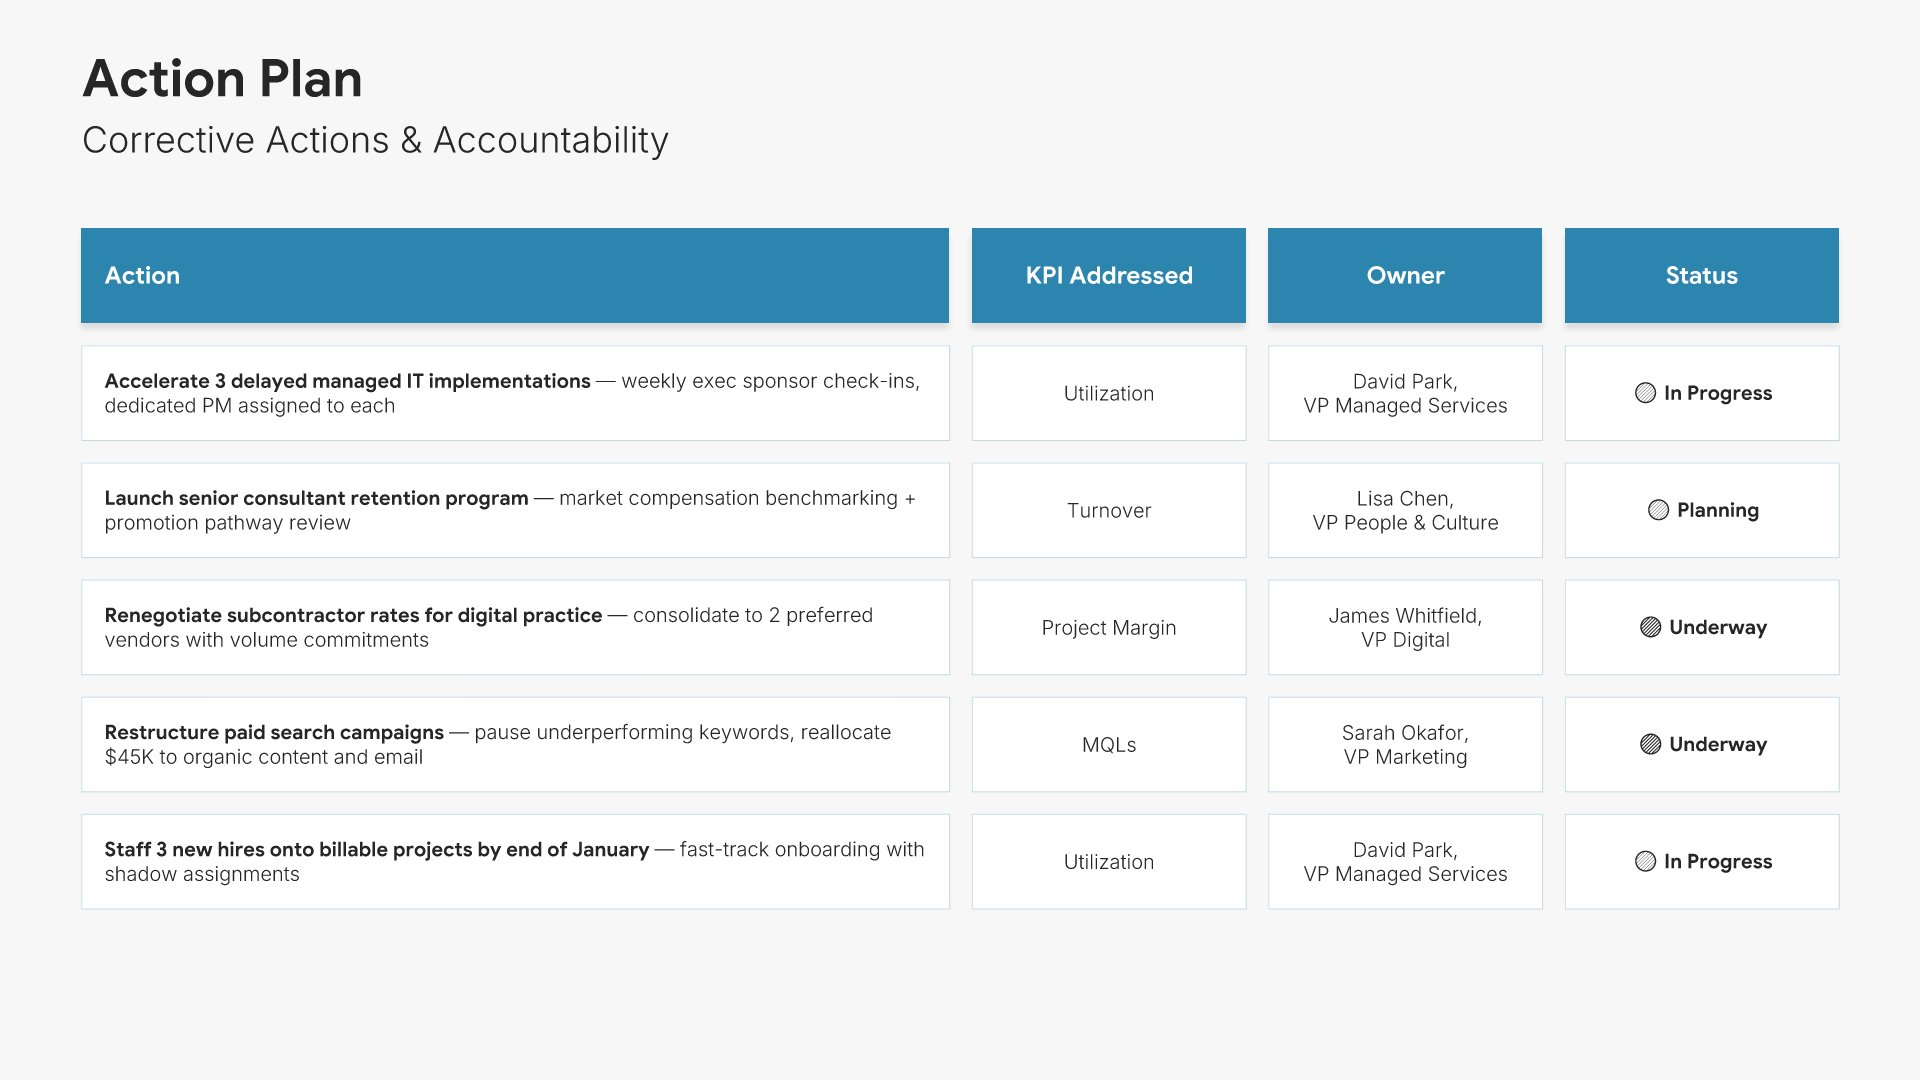
Action plan slide, metrics-neutral KPI dashboard template, owner, category, timeline, and status

Slide 12

Action Plan

Every gap with an owner, a category, a timeline, and a status.

Built using “Table” slide
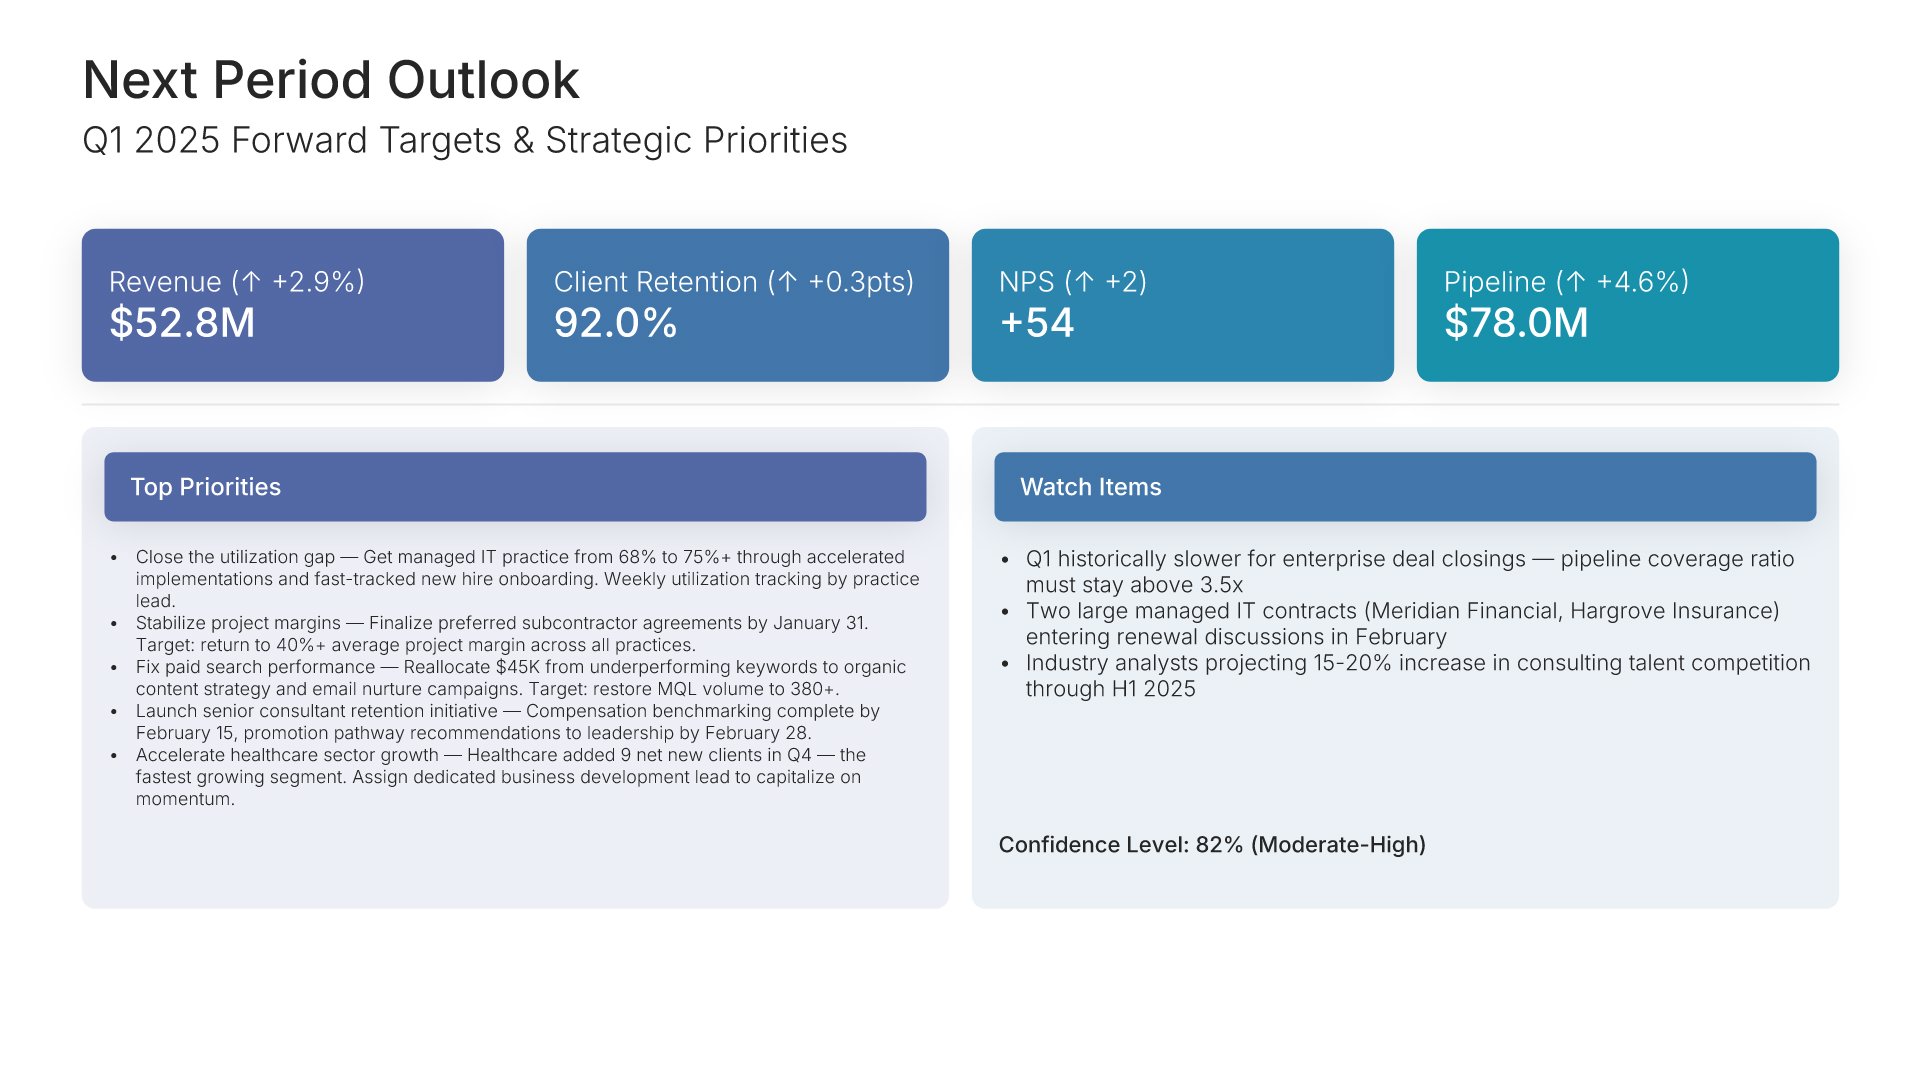
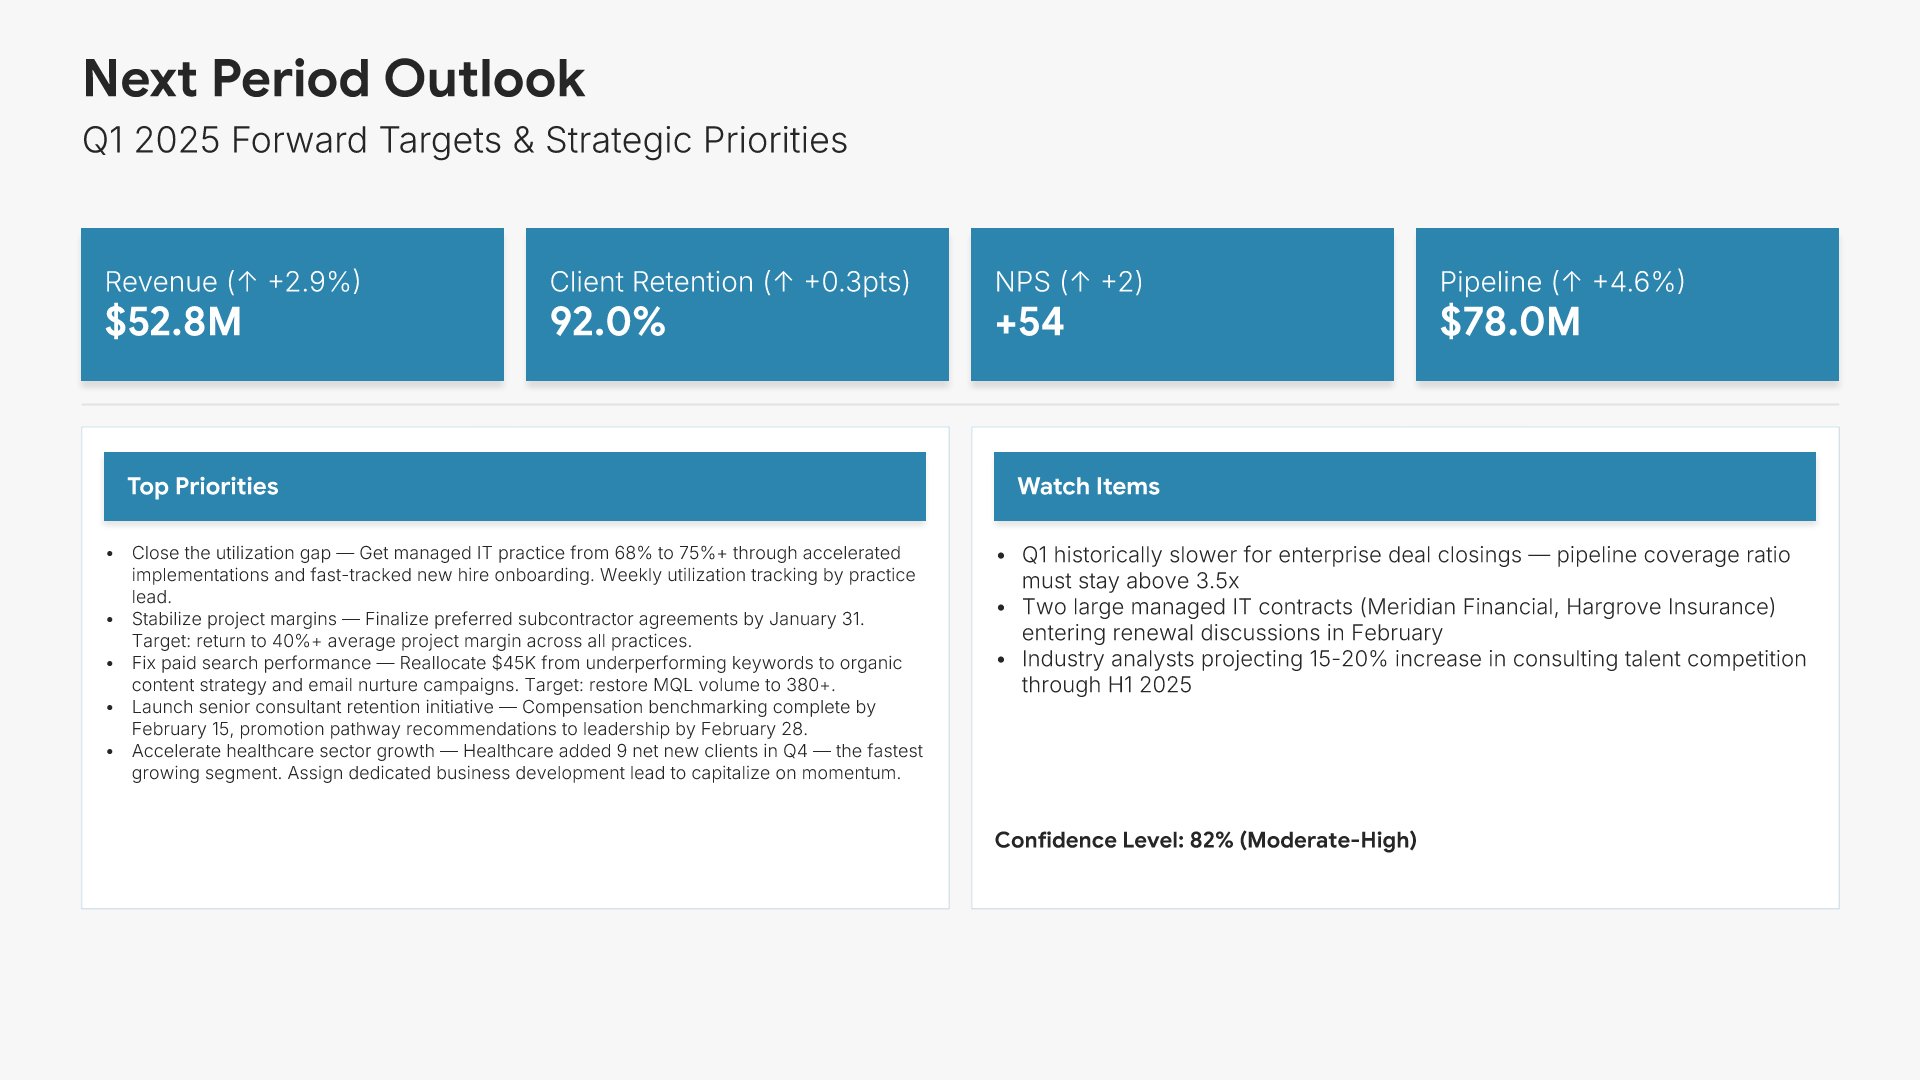
Future outlook slide, metrics-neutral KPI dashboard template, next period's targets and forecast confidence

Slide 13

Future Outlook

Next period's targets, the priorities behind them, and confidence in the forecast.

Built using “Executive Summary” slide
Thank you slide, metrics-neutral KPI dashboard template, contacts and next review date

Slide 14

Thank You

The close, with contacts and the date of the next review.

Built using “Thank You” slide

About the metrics-neutral KPI dashboard template

The structure, the slides, your brand, and a file you can edit anywhere.

Built so the room sees every function at once

Cross-functional reviews run long when nobody can see the whole picture at once. This dashboard puts every metric from sales, customer, operations, marketing, and people on one scorecard slide, grouped by function with target and status, then gives each function its own section. After that come the trends, the metrics that missed with their causes, and the actions with names against them.

Built from 9,000+ slides across 134+ categories

Every slide here comes from the same library. Metric dashboards, gauge dials, funnels, financial tables, and trend charts are already in it, so adding a sixth function or a second period of trends takes a minute. Everything sits on the same grid, so the layout still holds.

Brand the whole presentation in one click

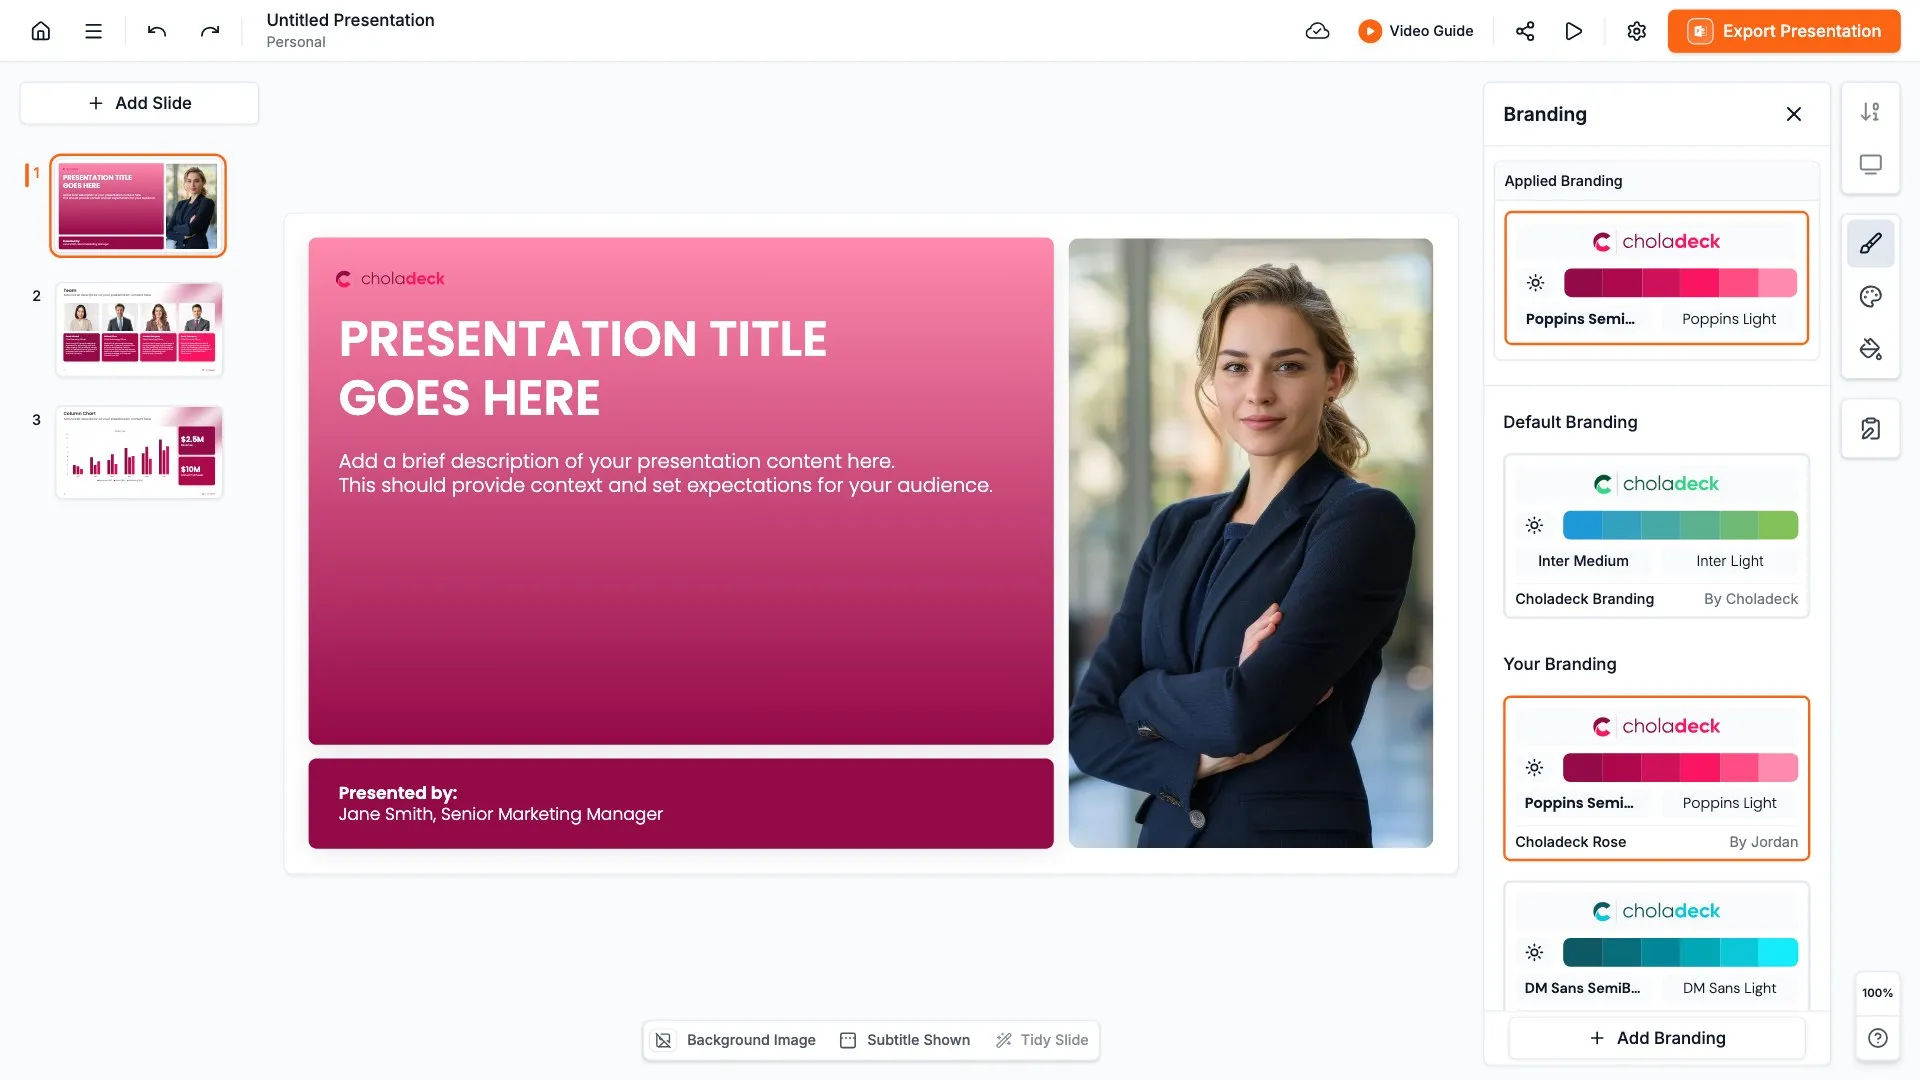
Add your logo, colors, fonts, and background once. It applies to the whole presentation and the entire slide library at the same time. On a presentation this chart-heavy, a manual recolor would take longer than building it.

Export to PowerPoint, Google Slides, or Keynote

You get a real file, not a locked link. Export it and keep editing in the tool you already use. Every chart and table stays editable, so next month you update the numbers rather than rebuild the report.

How Choladeck works

From blank page to finished presentation in four steps.

STEP 01

Browse 9,000+ slides across 134+ categories, or open one of the 74 premade presentations.

STEP 02

Add your logo, colors, and fonts in one click. The whole presentation instantly matches your company.

STEP 03

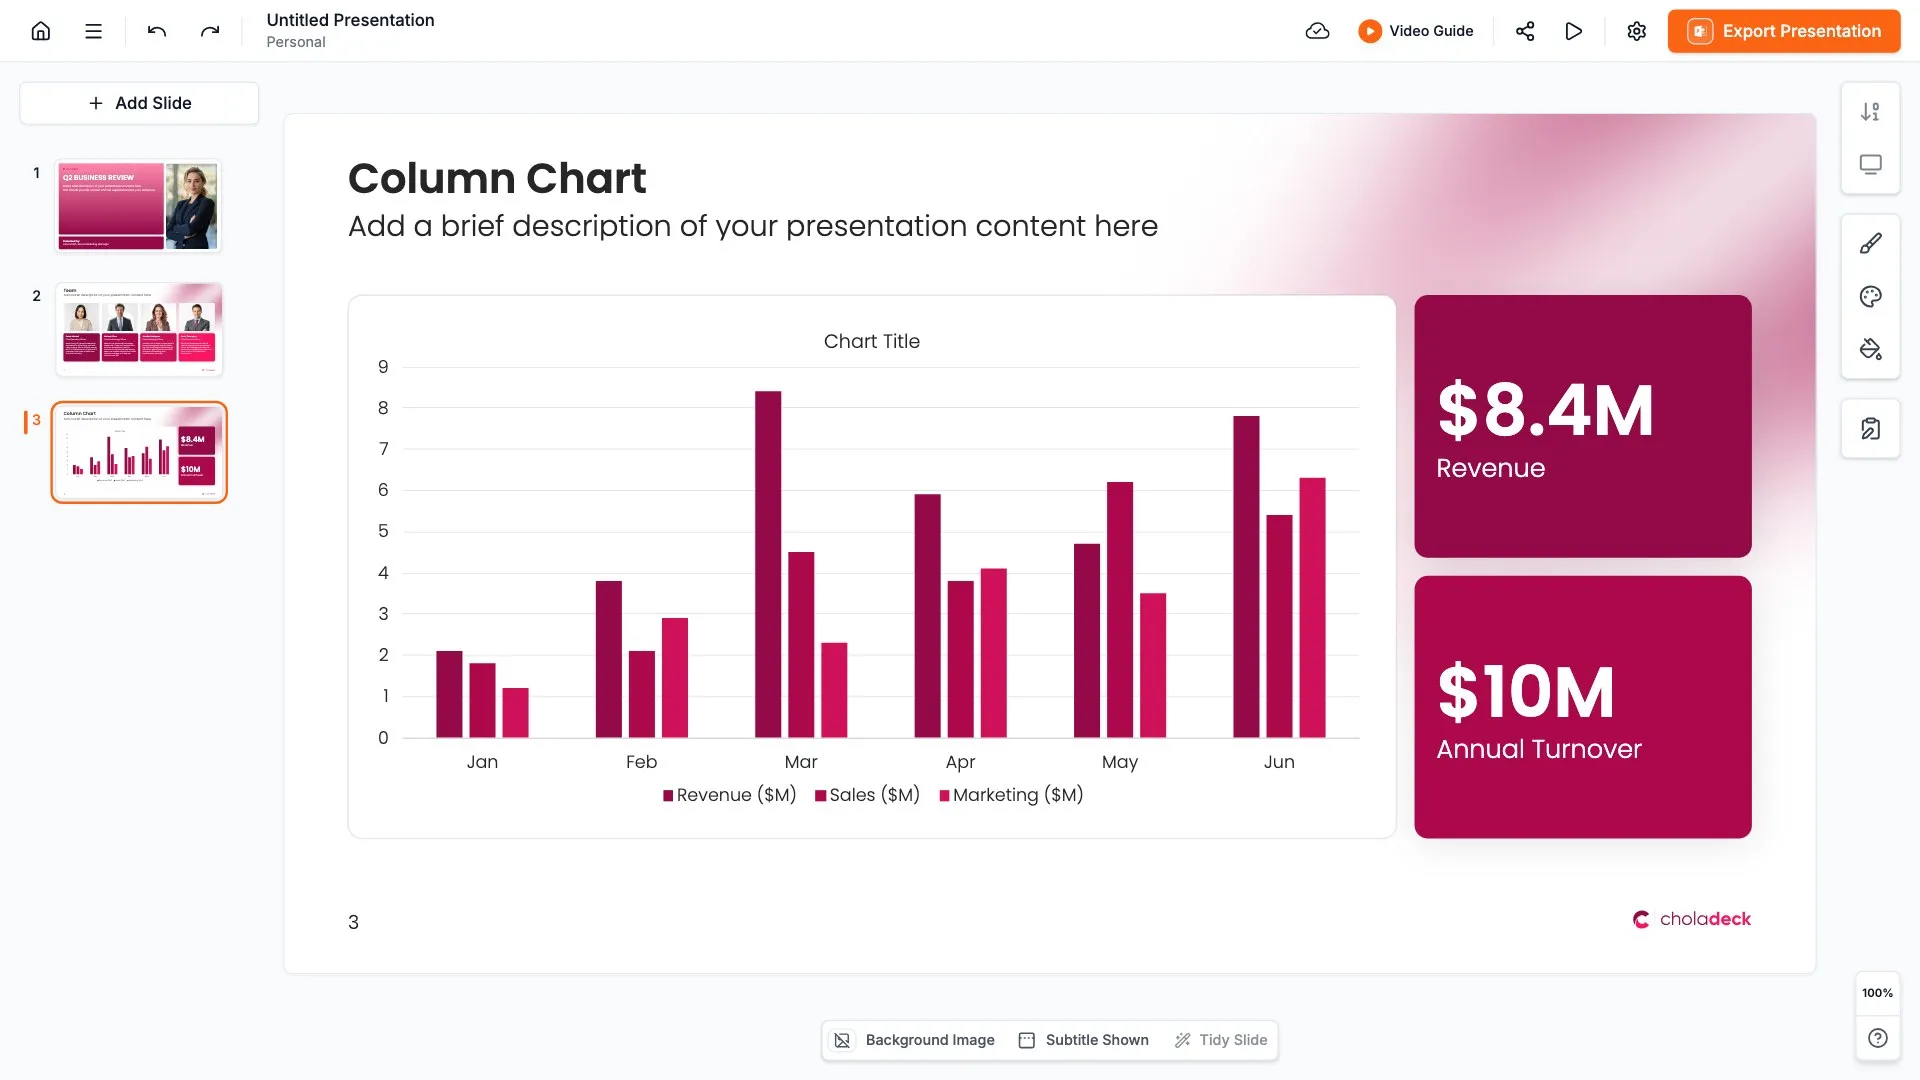
Add your text, numbers, charts, and tables. Everything on the slide is editable.

STEP 04

Send it to PowerPoint, Google Slides, or Keynote, and present.
Build your own

Nothing here fits? Build your own metrics-neutral KPI dashboard

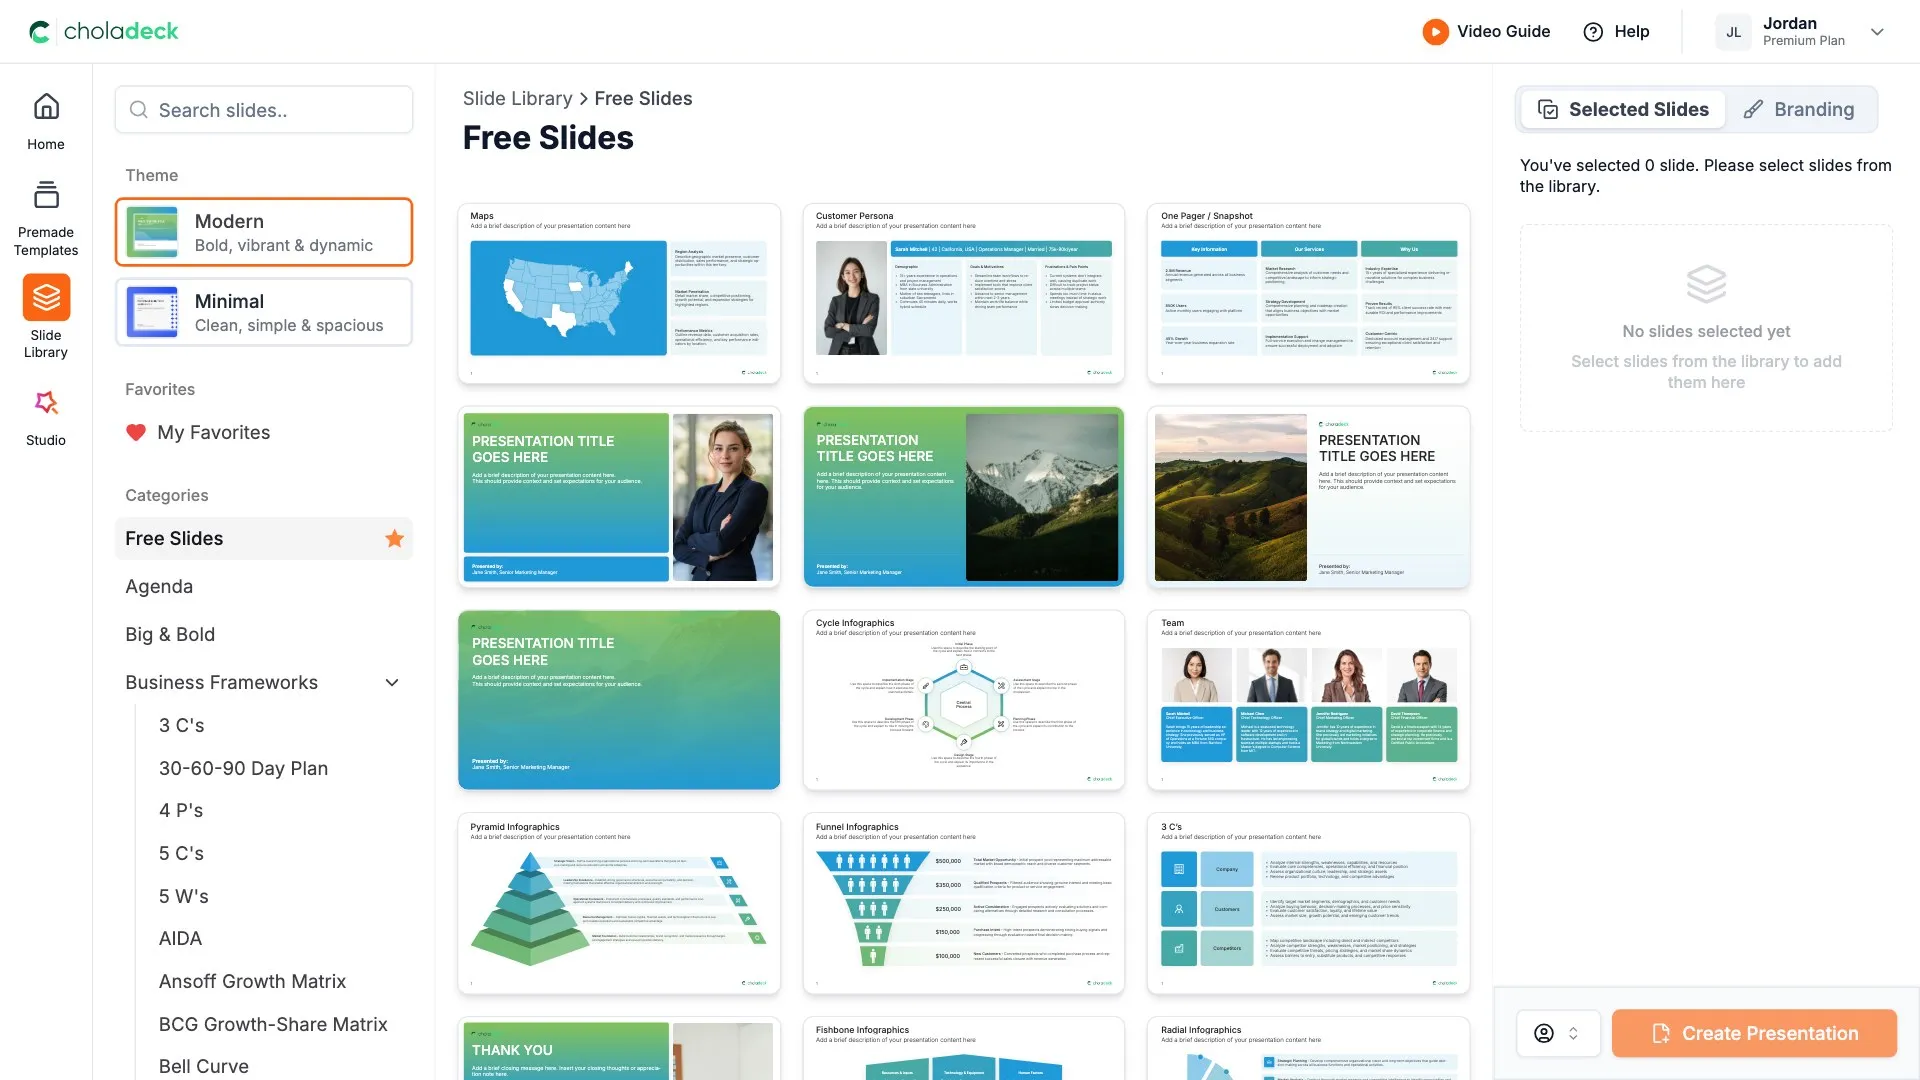
This template is assembled from the same 9,000+ slides. Pick the slides you need, drop them into one file, and brand the whole thing in one click.
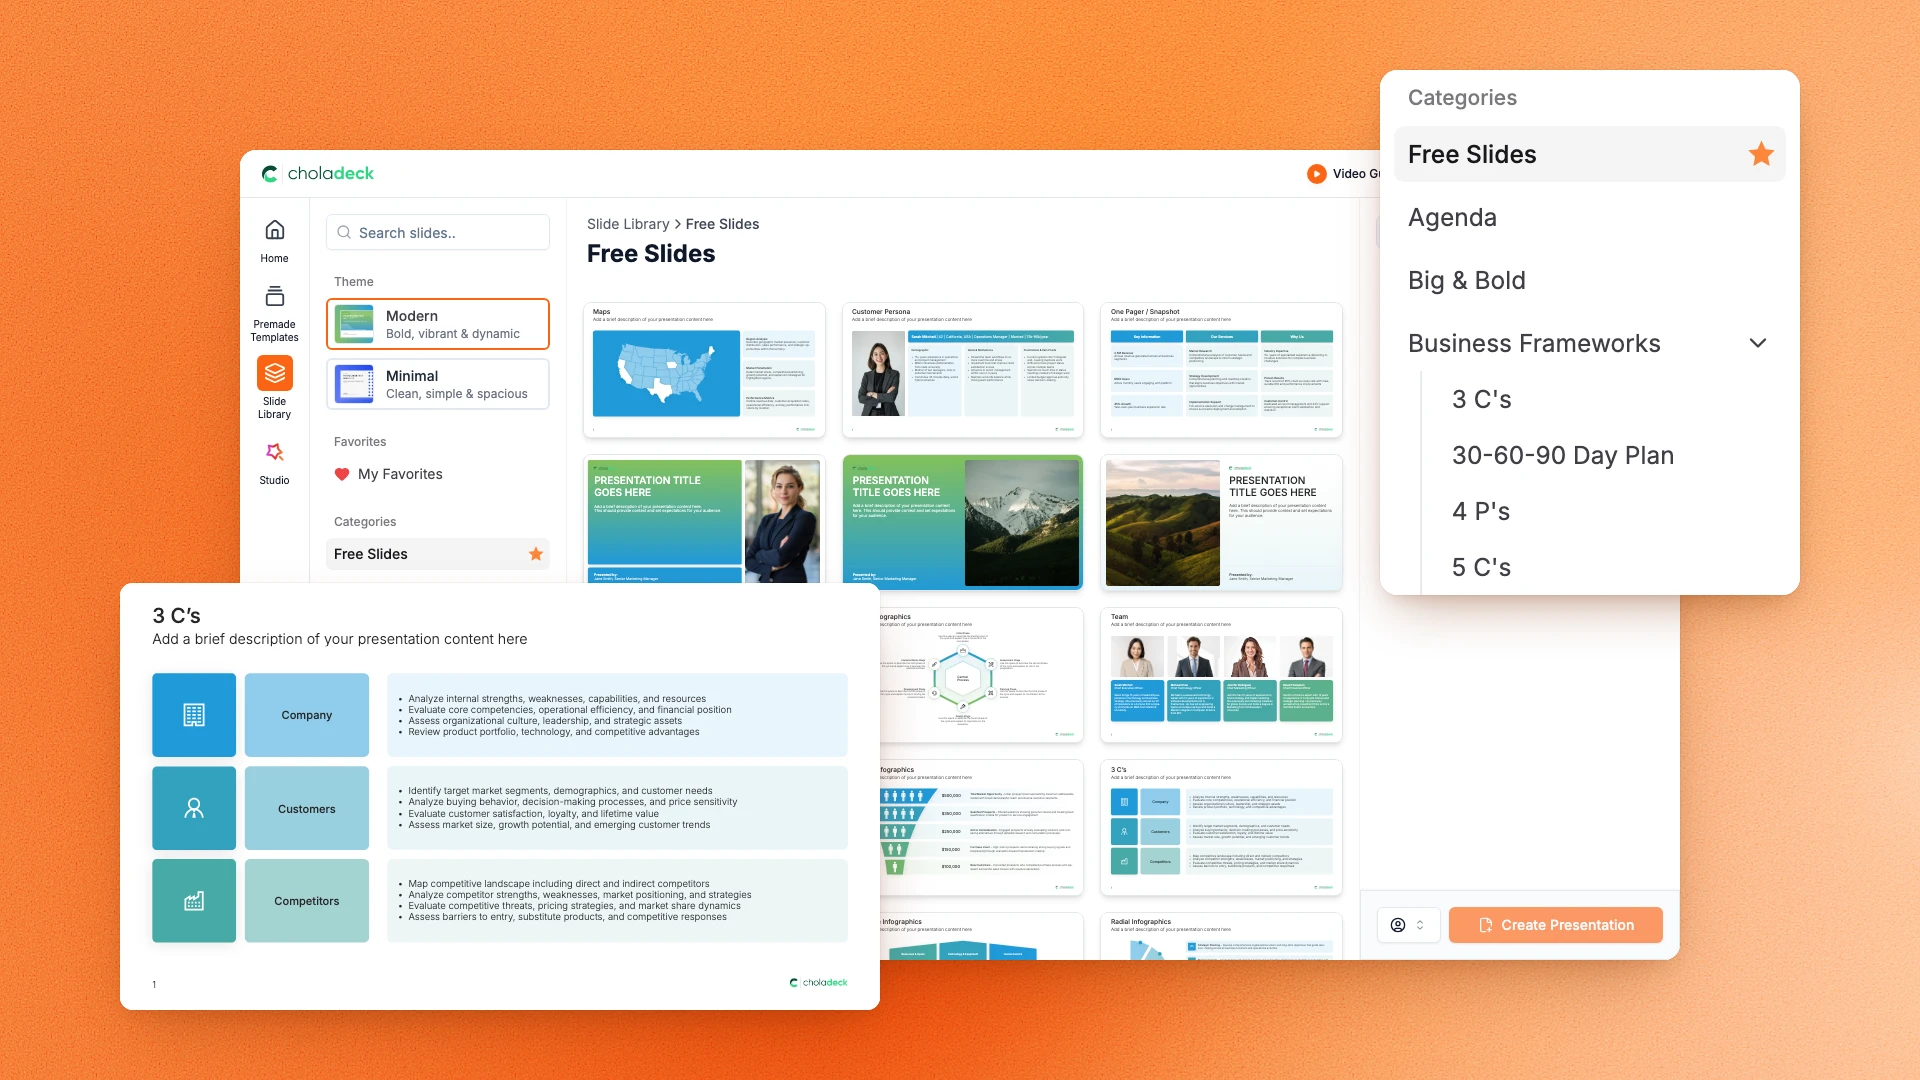
Choladeck slide library on Free Slides, with its category list and the 3 C’s slide shown larger

Questions about the metrics-neutral KPI dashboard template

What's inside the template, and how far you can change it.

Using the template

Is the template fully editable?

+

Yes. Text, tables, charts, icons, and colors on every slide are yours to change. Nothing is locked and nothing is a flat image.

How do I brand it to my organization?

+

Add your logo, colors, fonts, and background once. It applies to the whole presentation and the entire slide library at the same time.

Can I add slides from the slide library?

+

Yes. Add any slide from the library into this one, or swap out one that doesn't fit. Everything works together.

What's included

Which functions does it cover?

+

Revenue and sales, customer, operations and delivery, marketing, and people and culture, each with its own section, plus a scorecard covering all five. Marketing gets two slides: a funnel and a bar chart view.

Can I add or remove a function?

+

Yes. Sections are independent, so delete one you don't report on or add a sixth from the slide library. Update the row list on the scorecard slide to match.

Is placeholder content included?

+

Yes. Every slide comes with realistic text, sample figures, and filled-in charts, so you can see how the metrics-neutral KPI dashboard reads before you put your own numbers in.

Start your metrics-neutral KPI dashboard
from one that's already done

Pick it, brand it, add your content, and export.

Free to start. No credit card required.