Pricing

Comprehensive financial report template

Twenty-two slides for a full-year review that has to stand up to scrutiny. The three statements, then the ratios behind them: profitability, liquidity and efficiency, and debt and leverage. Select it, brand it to your organization in one click, add your figures, and export to PowerPoint, Google Slides, or Keynote.

Free to start. No credit card required.
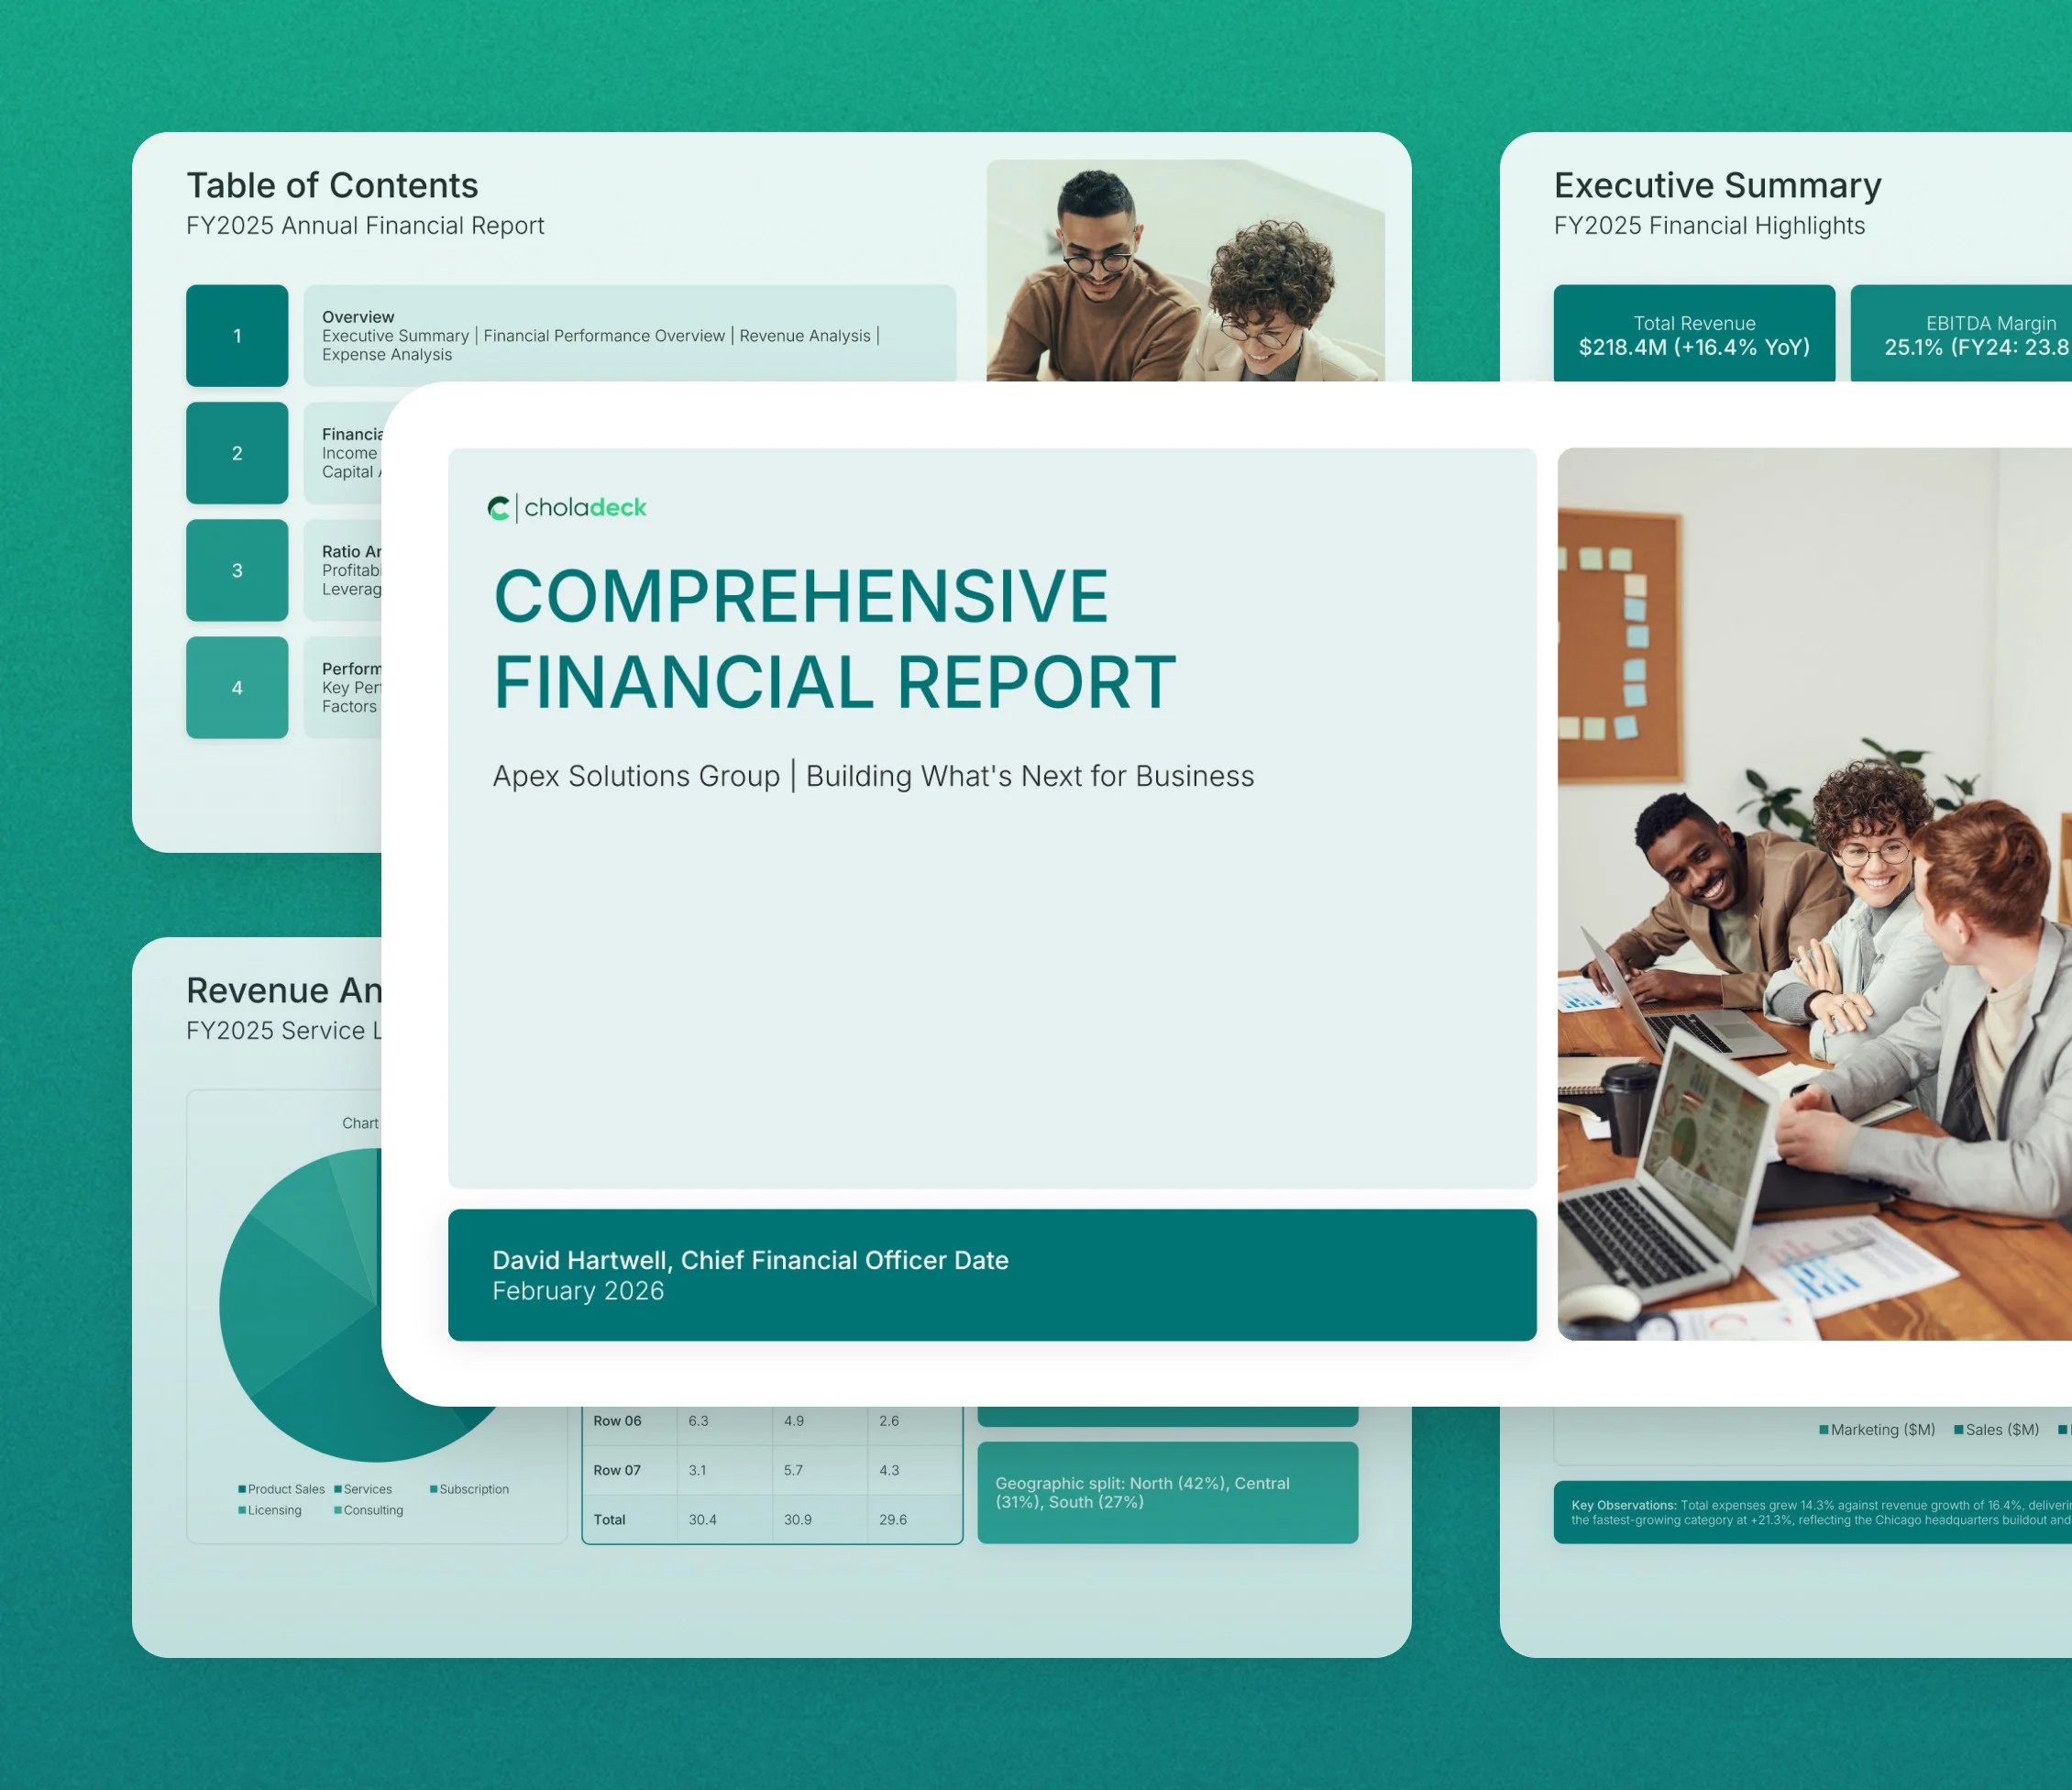
Comprehensive financial report template: the title slide in front of other slides from the 22-slide deck

Every slide in the comprehensive financial report template

Twenty-two slides, in the order you present them.

Comprehensive Financial Report • Premade Template • Slide 01 of 22

Title slide, comprehensive financial report template, organization name and reporting year

Slide 01

Title

Organization name, the reporting year, and who's presenting.

Built using “Title” slide
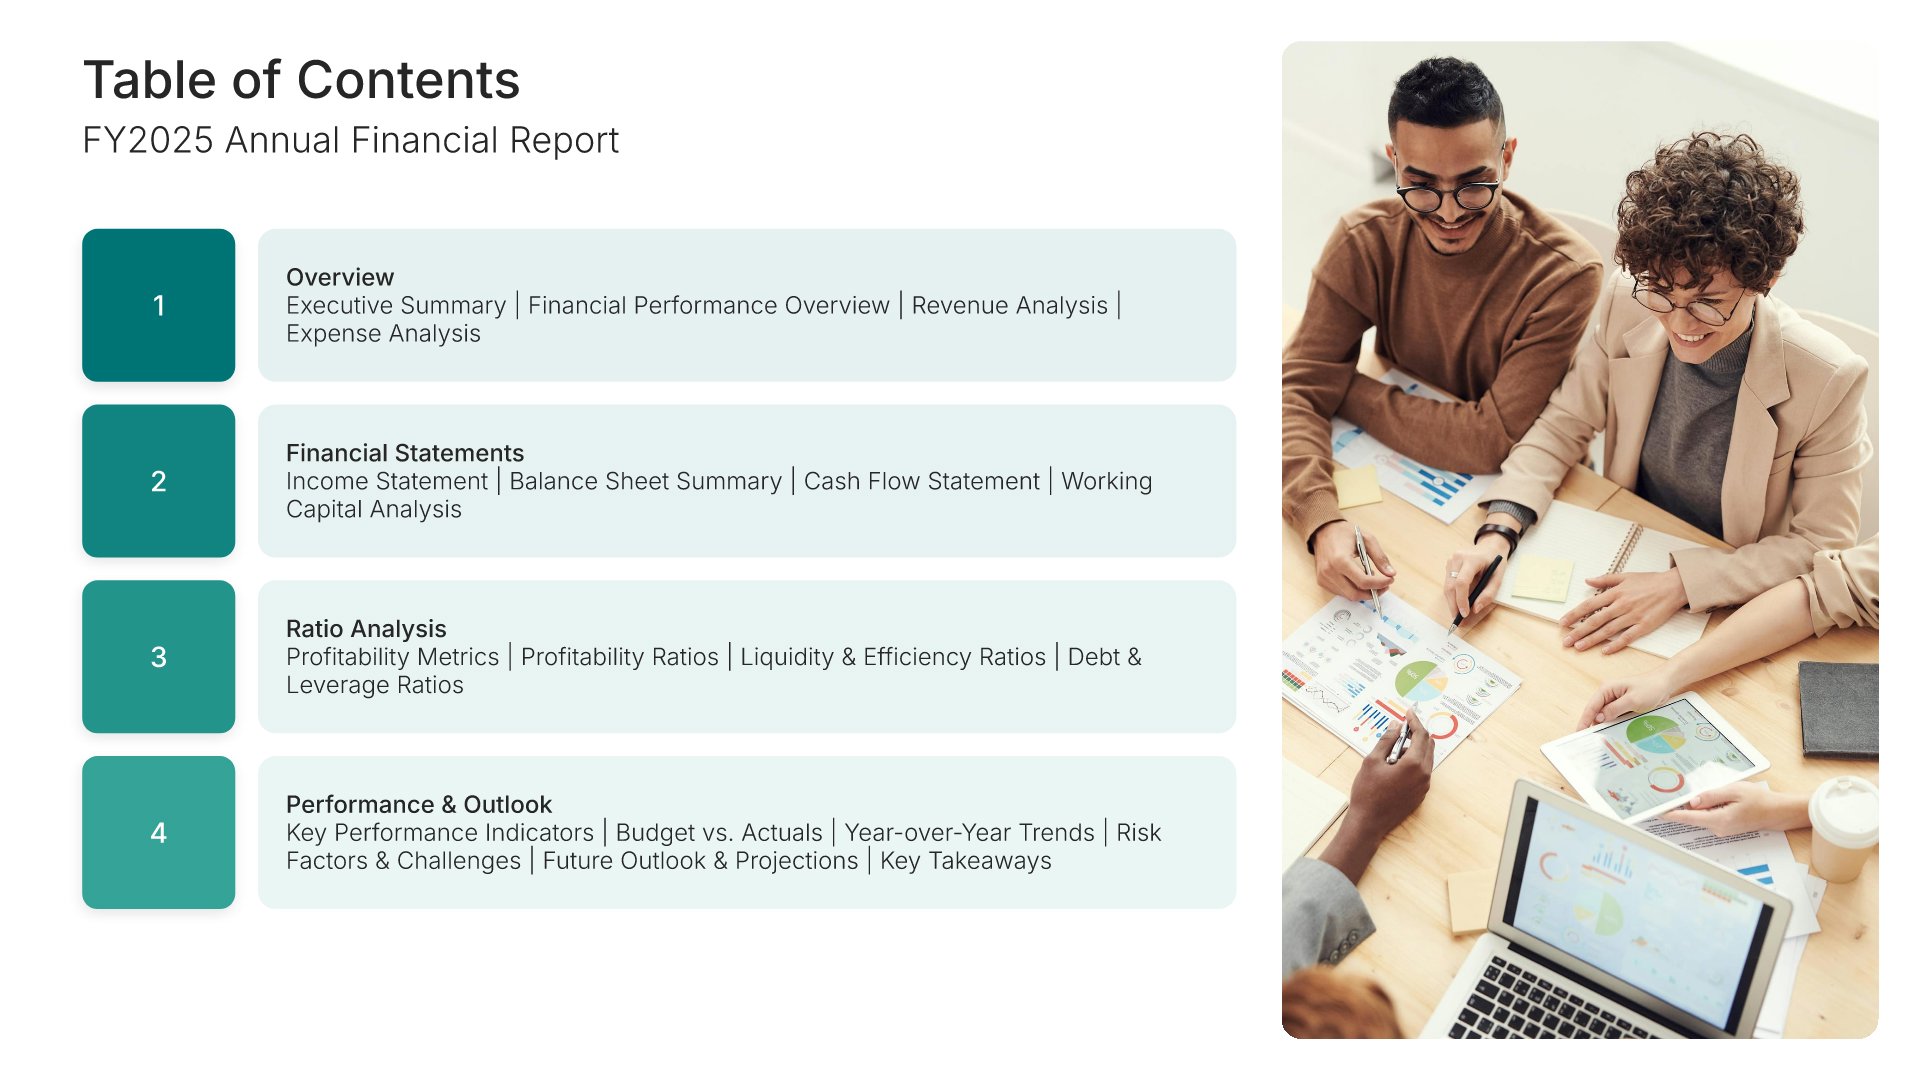
Agenda slide, comprehensive financial report template, report contents in four sections

Slide 02

Agenda

The full report contents, grouped into four sections.

Built using “Agenda” slide
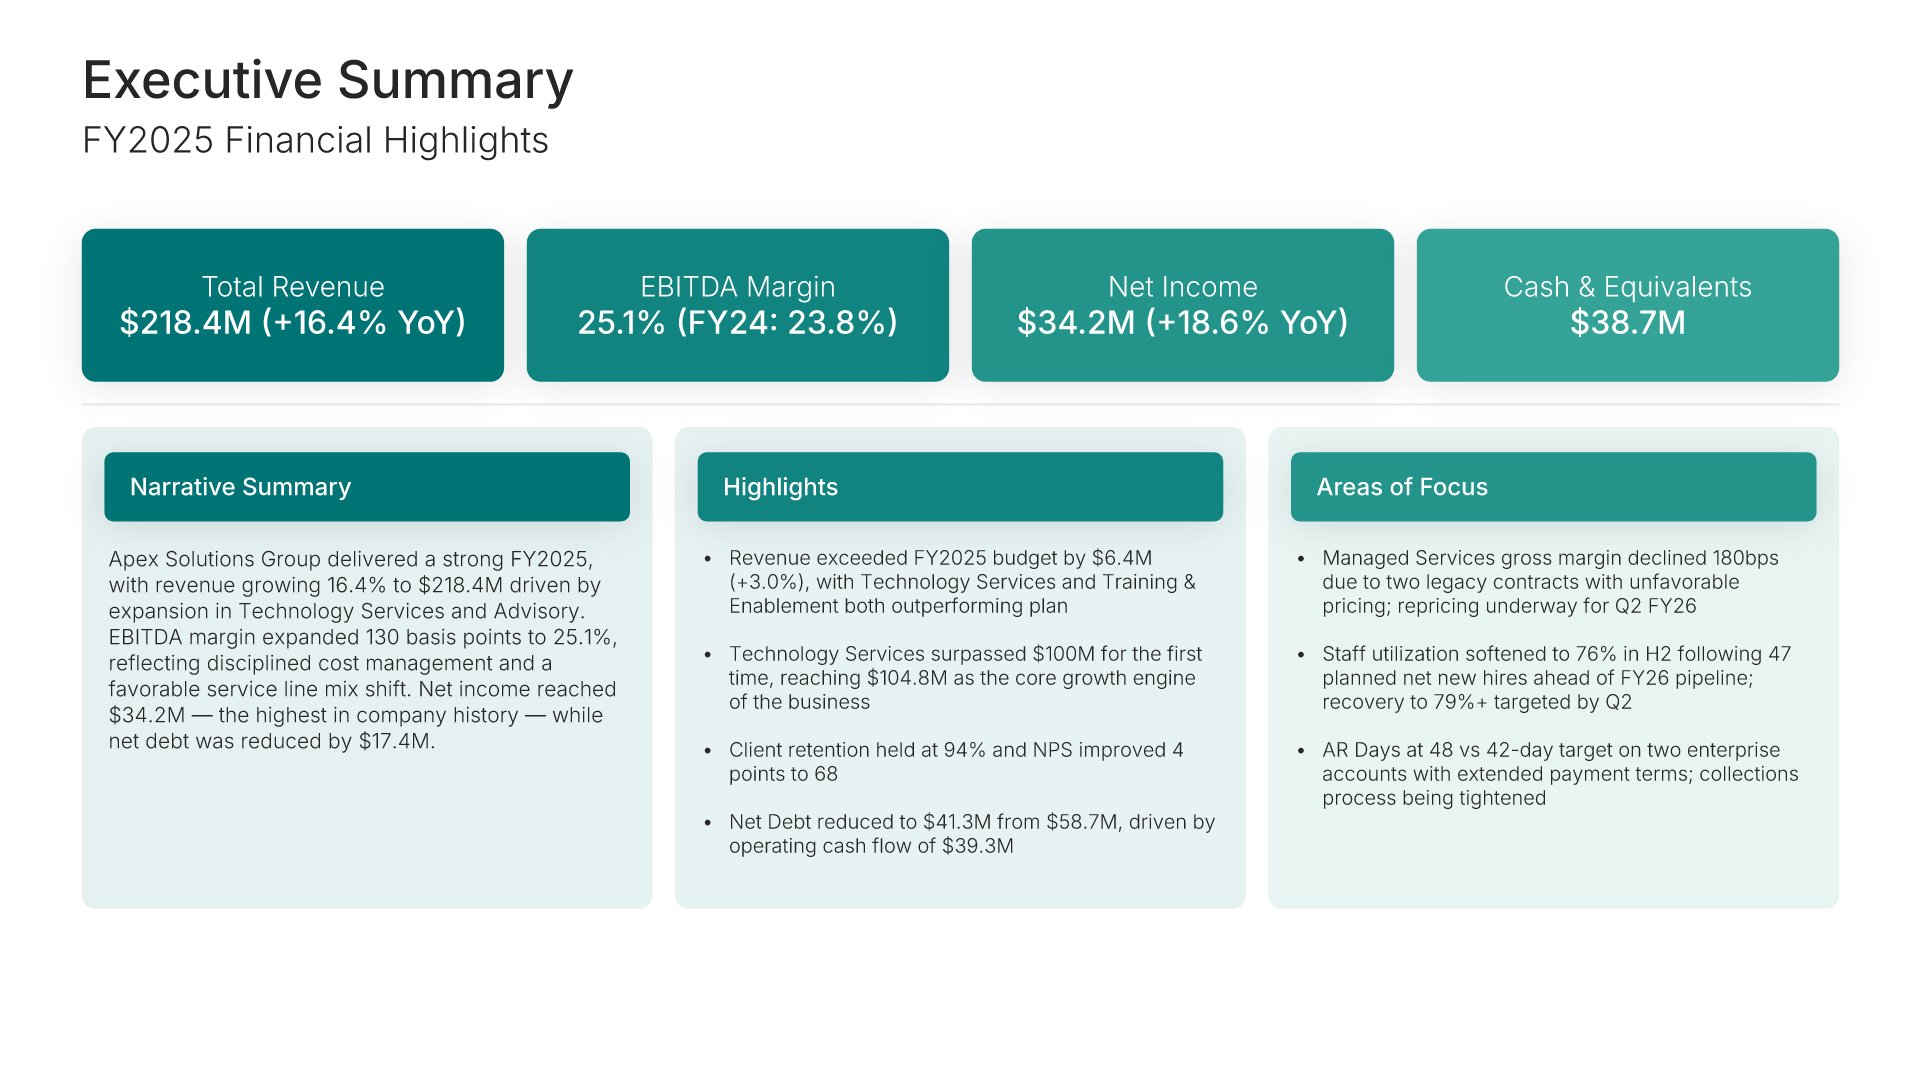
Executive summary slide, comprehensive financial report template, revenue, EBITDA, and cash position

Slide 03

Executive Summary

Revenue, EBITDA, and cash position across the top, then narrative and areas of focus.

Built using “Executive Summary” slide
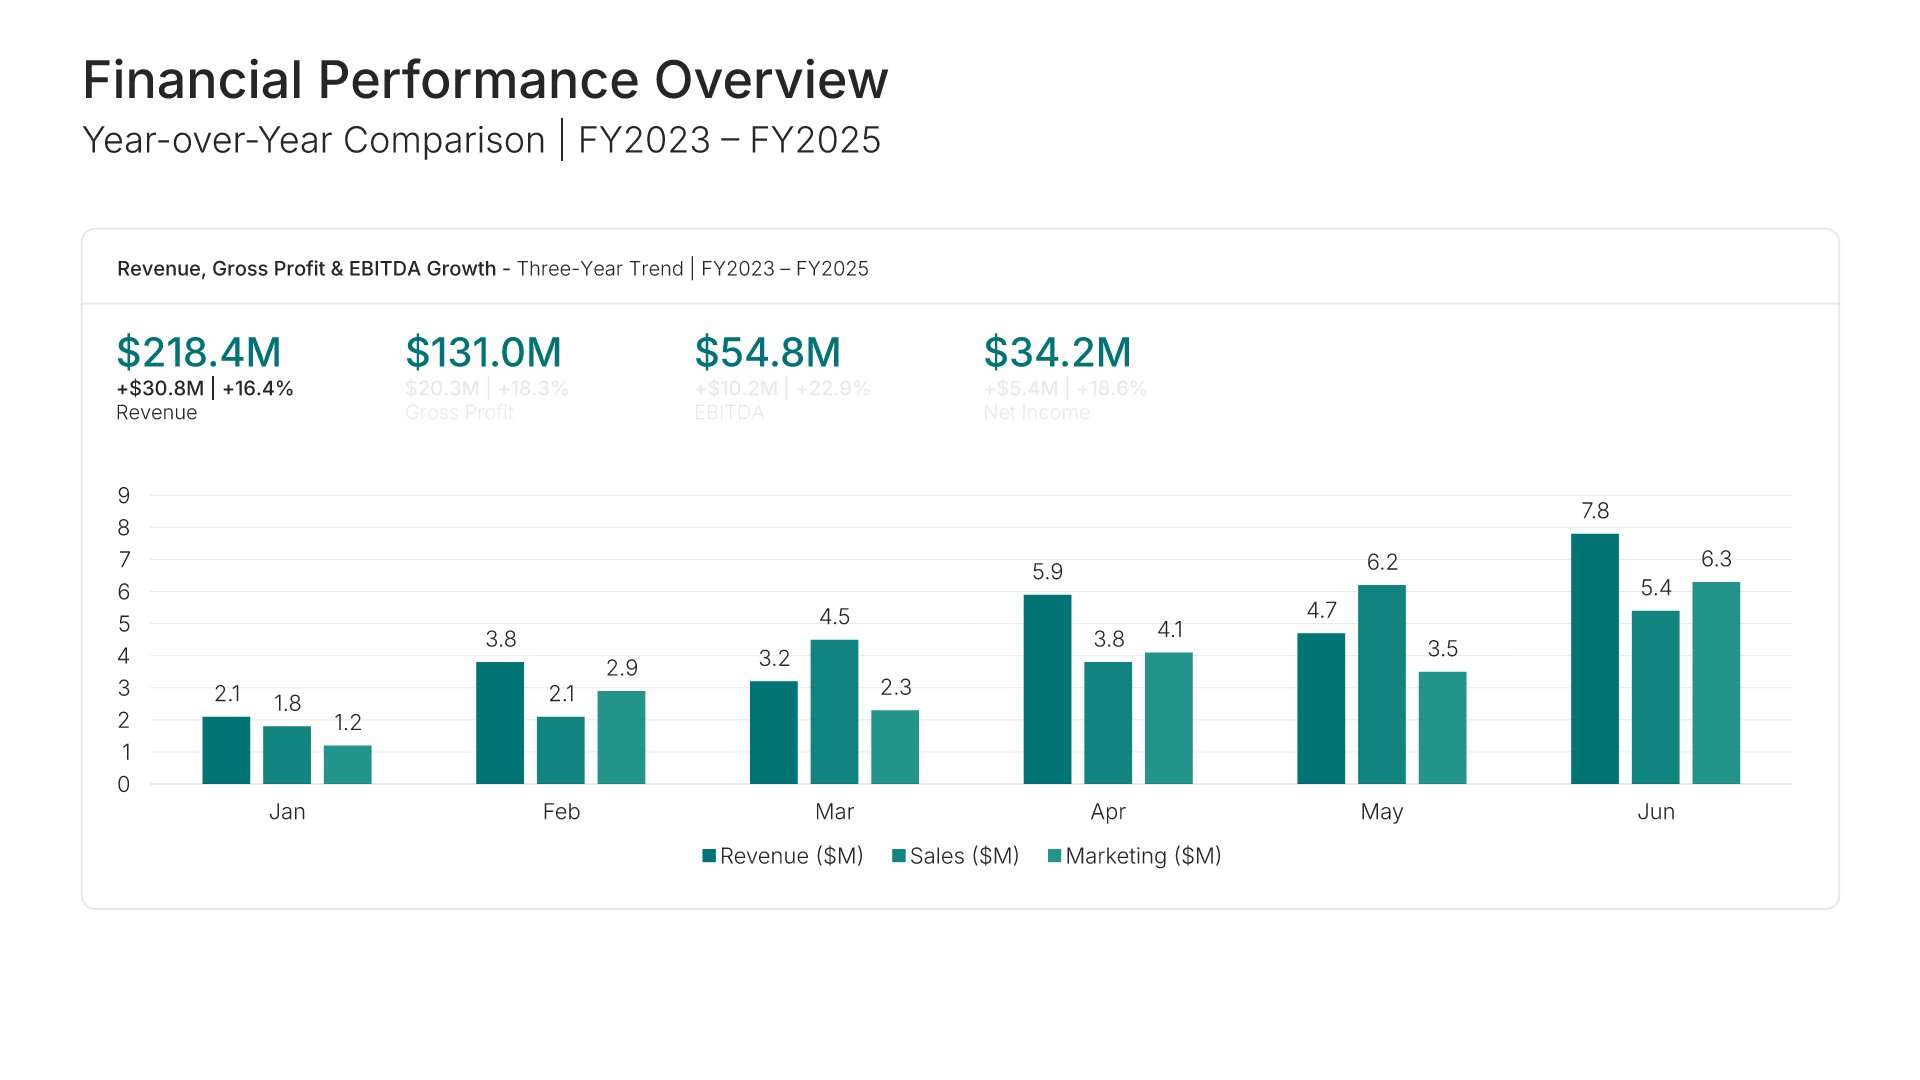
Financial performance overview slide, comprehensive financial report template, four headline figures against prior periods

Slide 04

Financial Performance Overview

Year-over-year comparison, four headline figures charted against prior periods.

Built using “Charts” slide
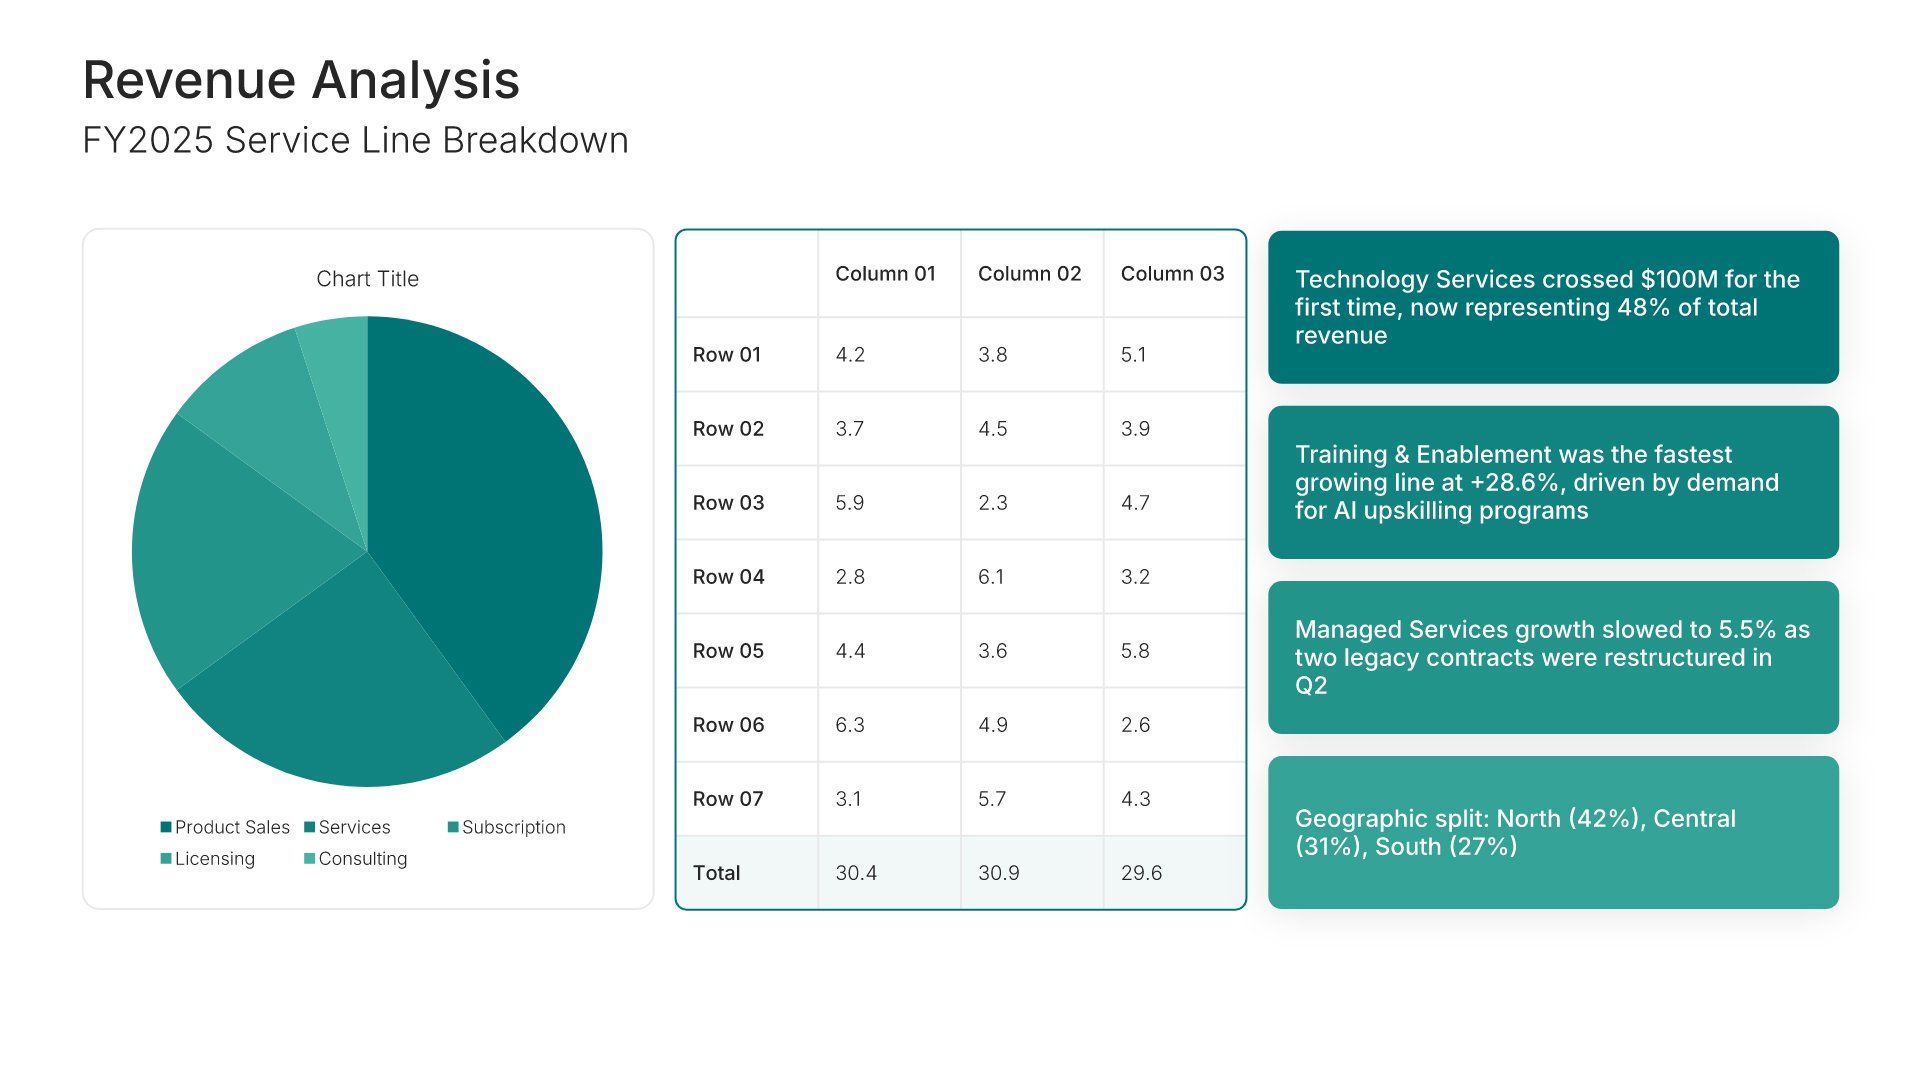
Revenue analysis slide, comprehensive financial report template, revenue by service line on a donut

Slide 05

Revenue Analysis

Revenue by service line on a donut, with each line broken out beside it.

Built using “KPI Dashboard” slide
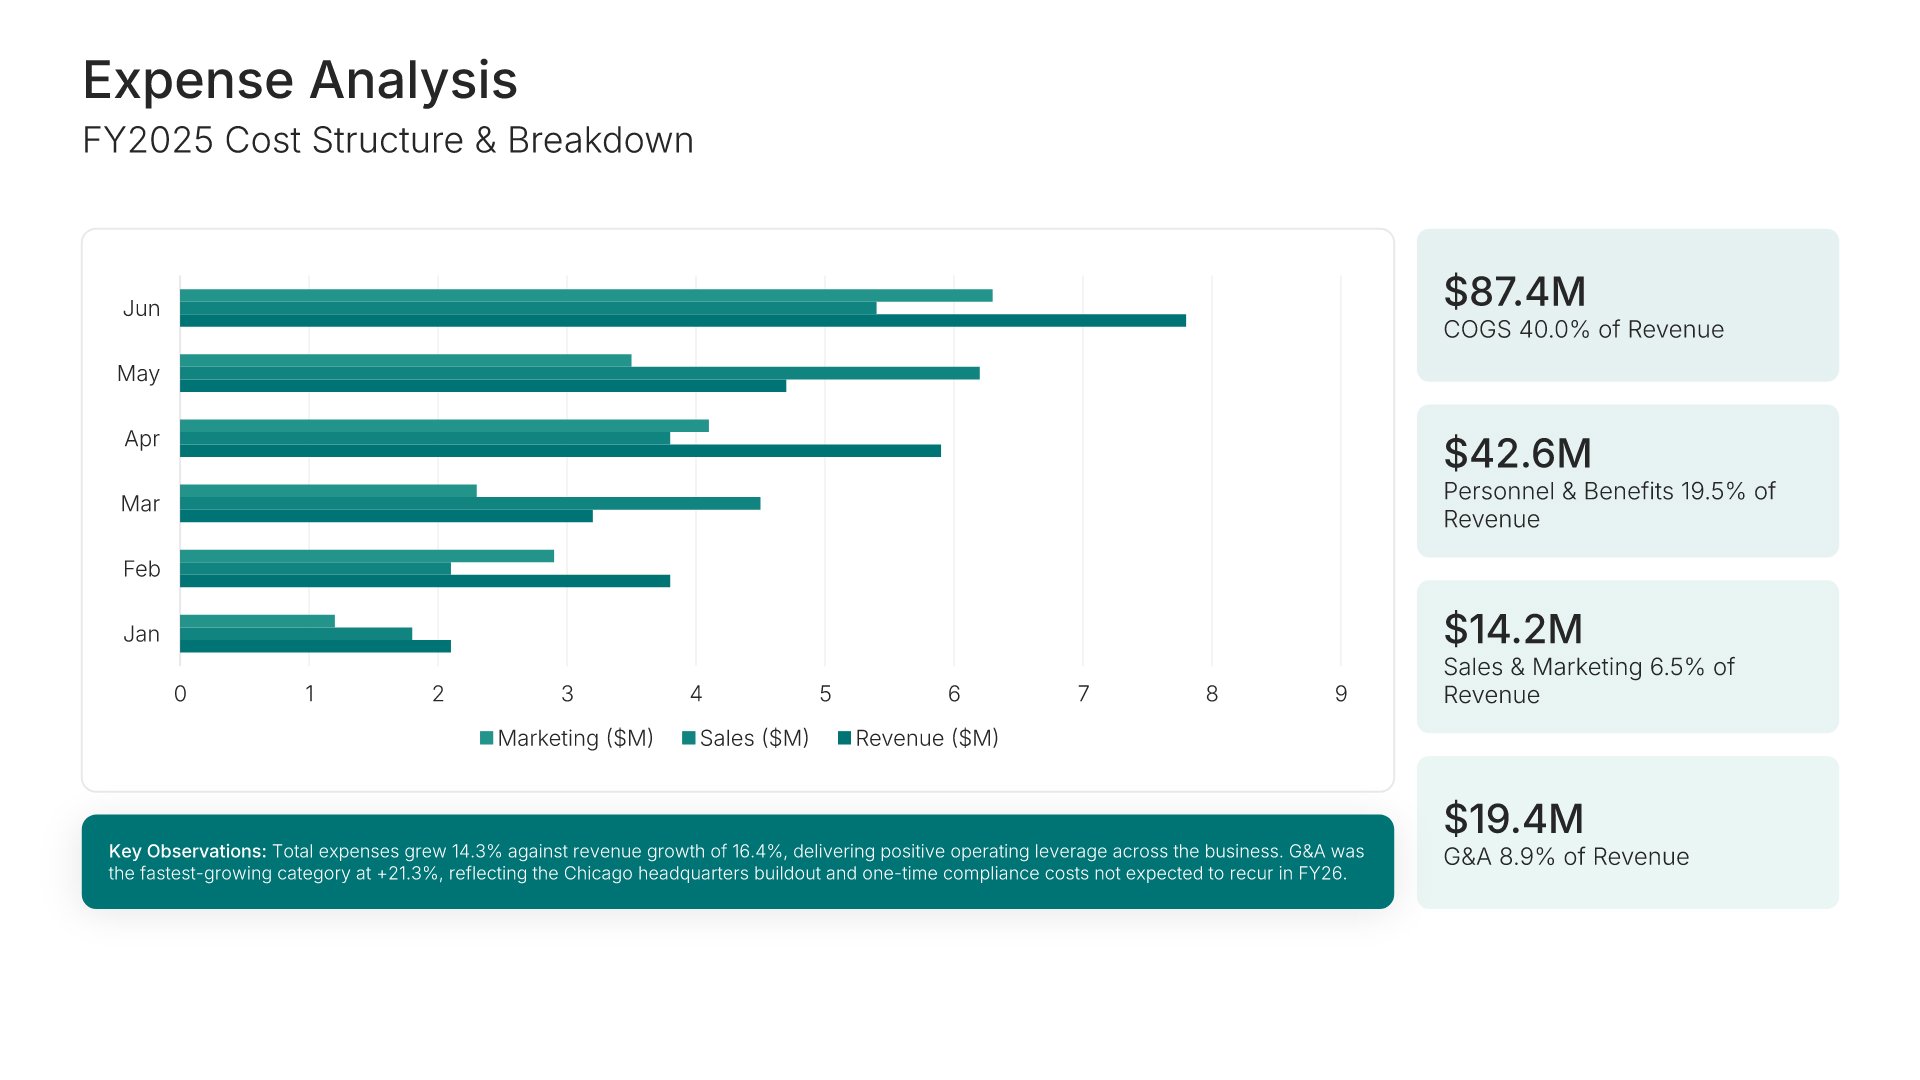
Expense analysis slide, comprehensive financial report template, cost structure with the largest movements

Slide 06

Expense Analysis

Cost structure and breakdown, charted, with the largest movements called out.

Built using “Charts” slide
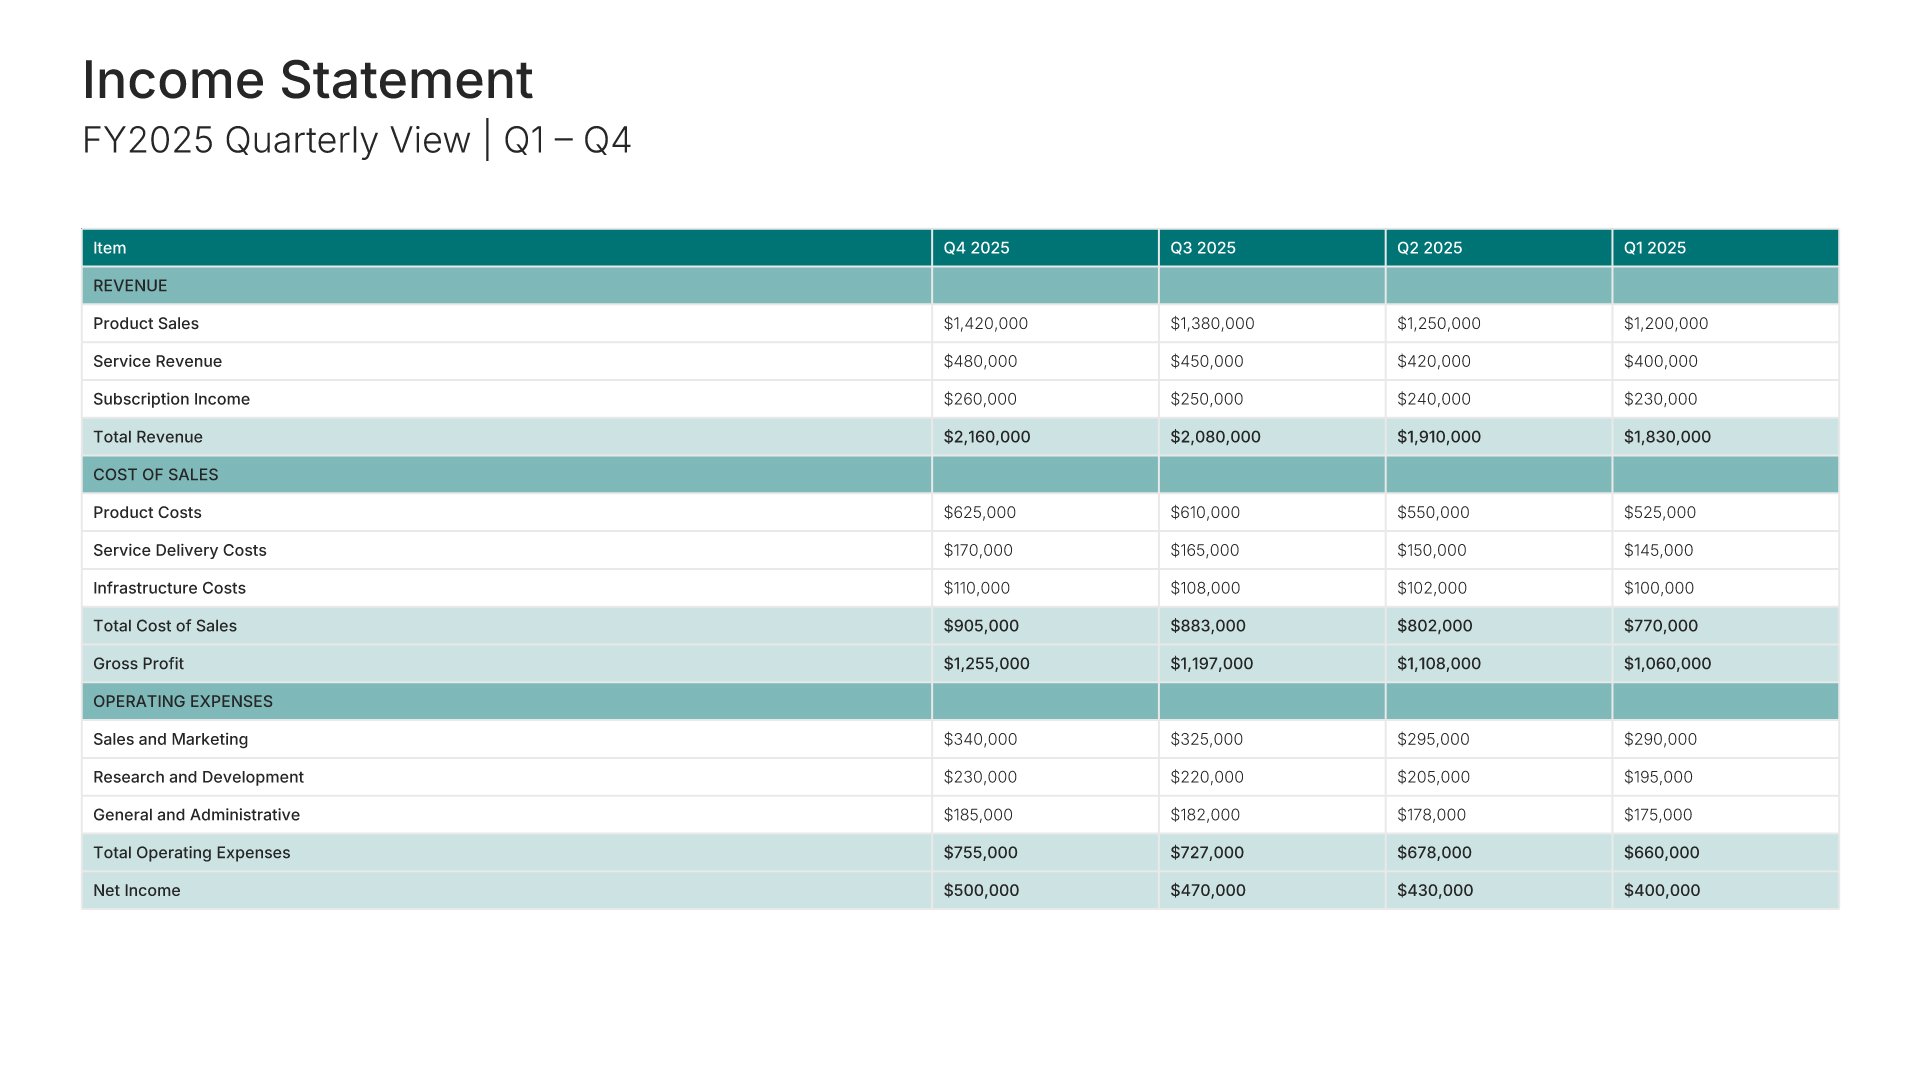
Income statement slide, comprehensive financial report template, all four quarters line by line

Slide 07

Income Statement

Quarterly view across all four quarters, line by line.

Built using “Financial Table” slide
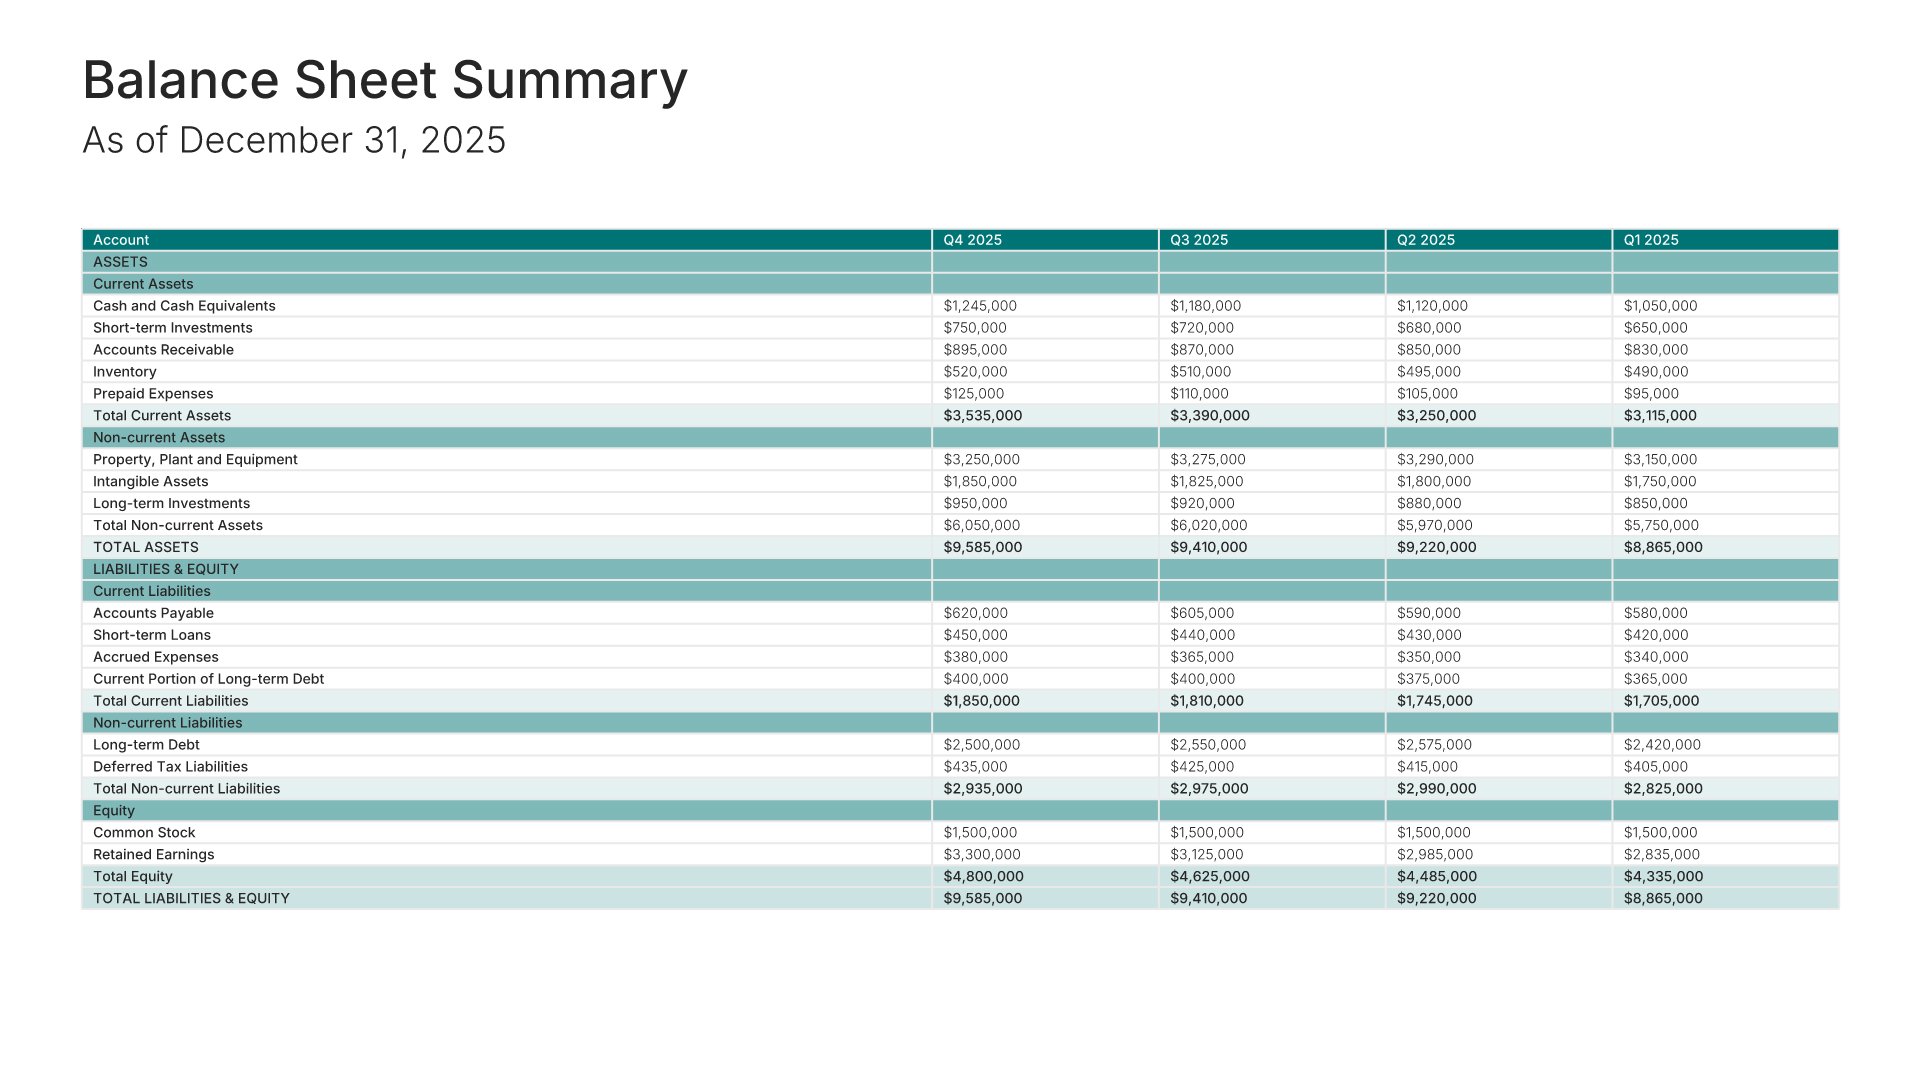
Balance sheet slide, comprehensive financial report template, assets, liabilities, and equity at year end

Slide 08

Balance Sheet

Assets, liabilities, and equity as of the year-end date, totaled.

Built using “Financial Table” slide
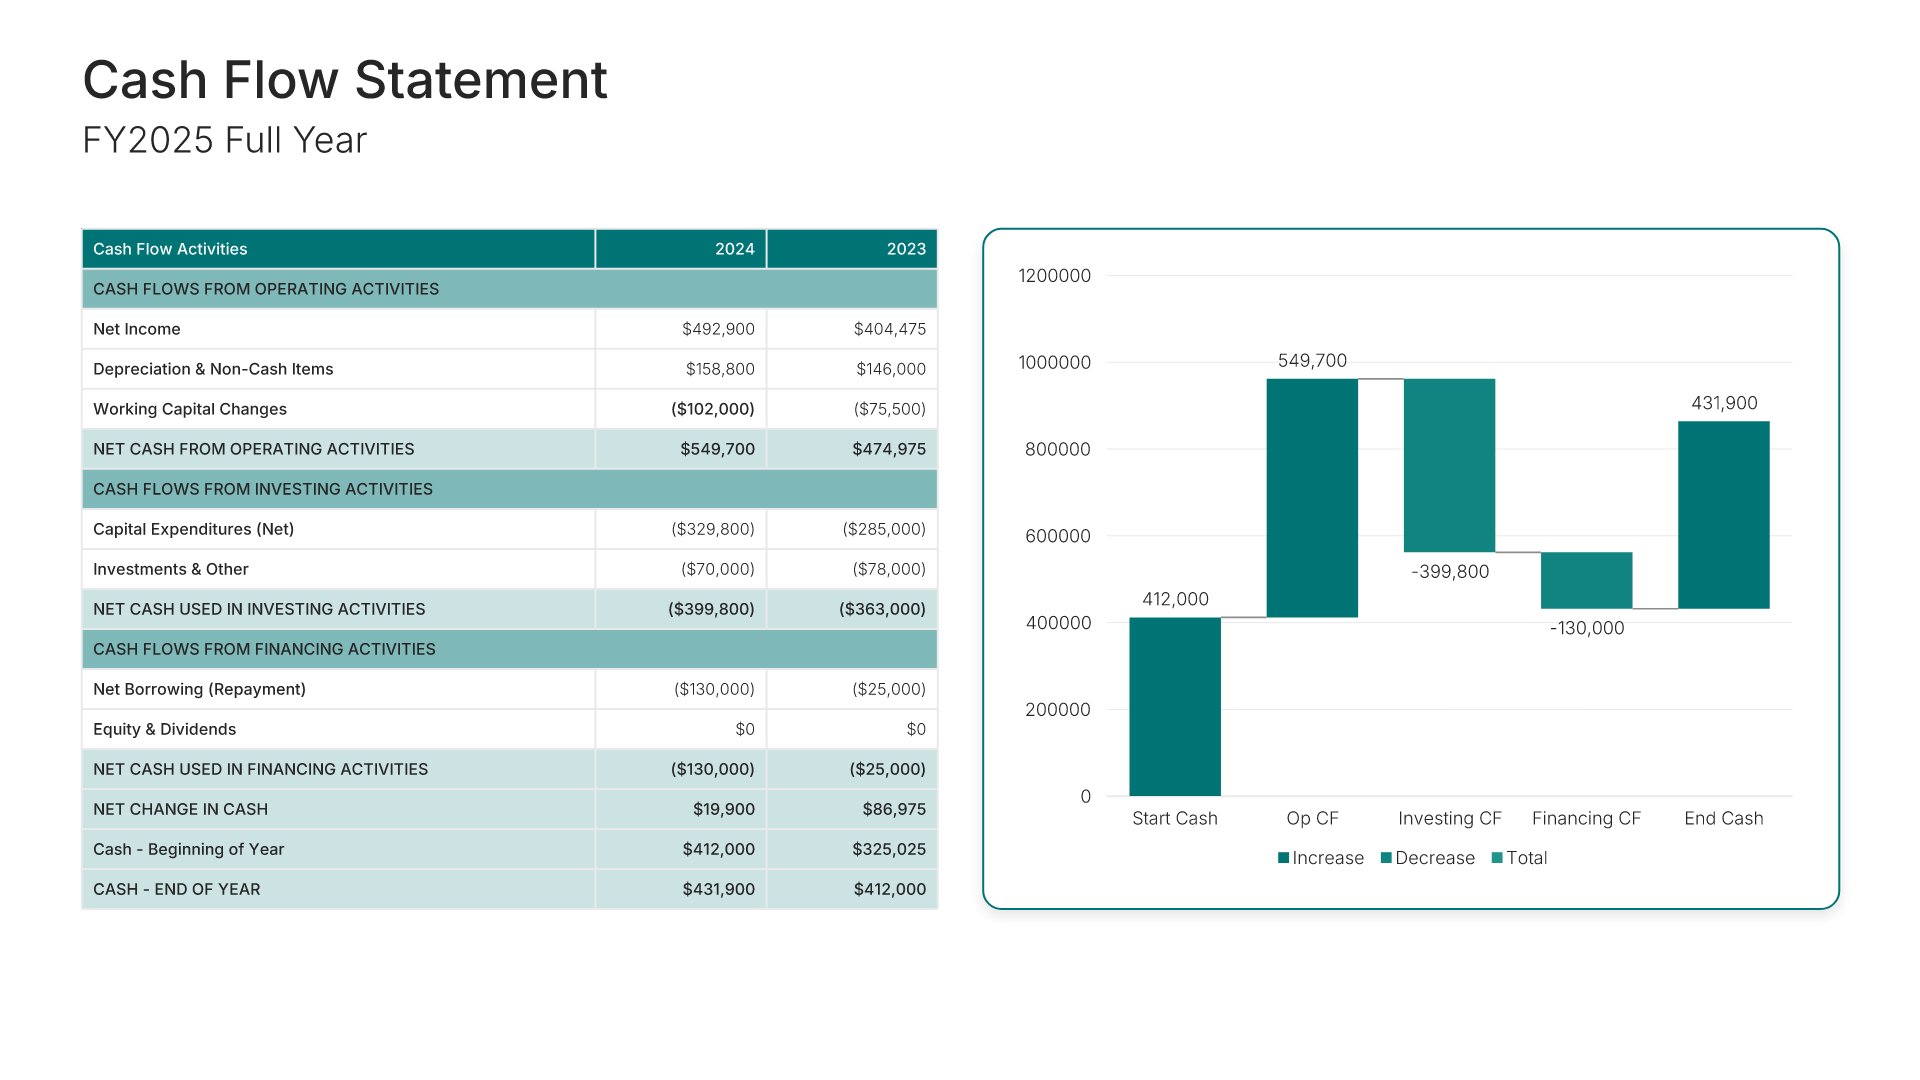
Cash flow statement slide, comprehensive financial report template, operating, investing, and financing for the year

Slide 09

Cash Flow Statement

Operating, investing, and financing for the full year, charted alongside the table.

Built using “Financial Table” slide
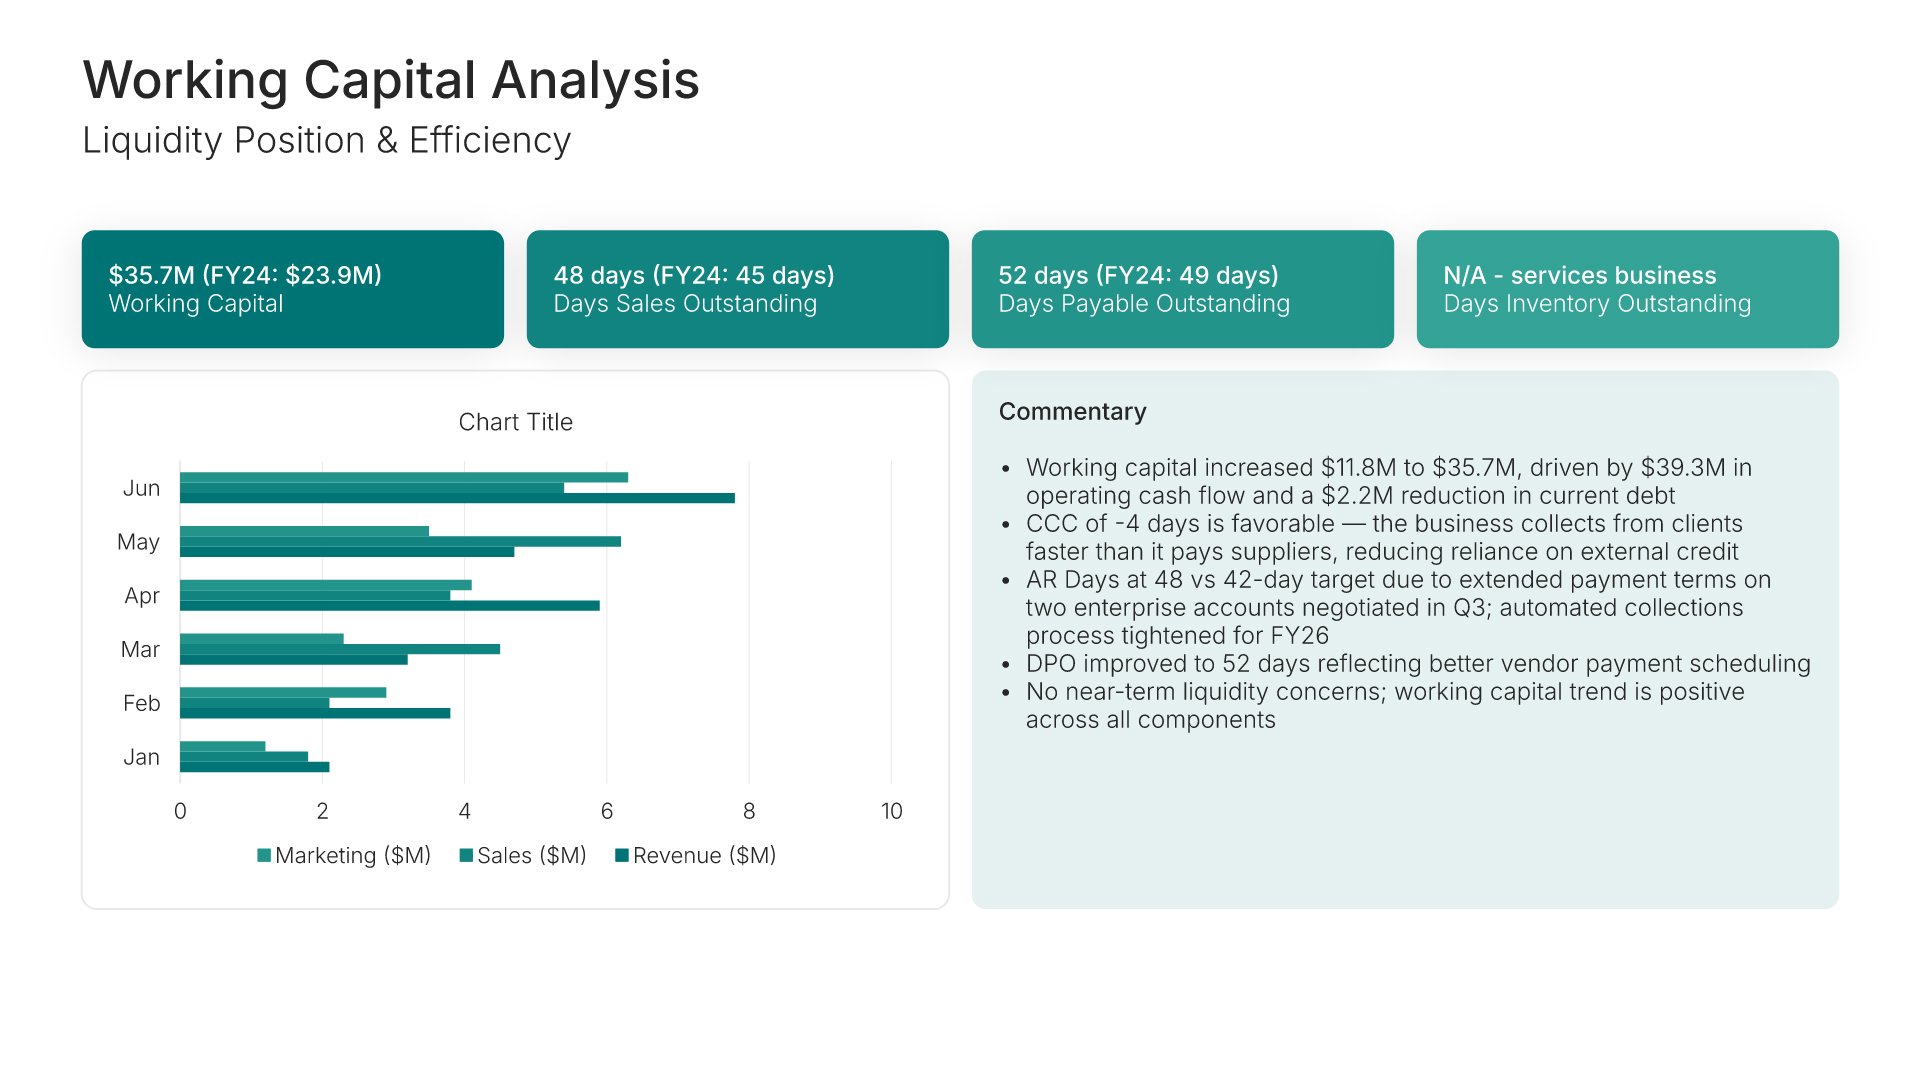
Working capital analysis slide, comprehensive financial report template, liquidity and the cash conversion cycle

Slide 10

Working Capital Analysis

Liquidity position and efficiency, with the cash conversion cycle broken into its parts.

Built using “KPI Dashboard” slide
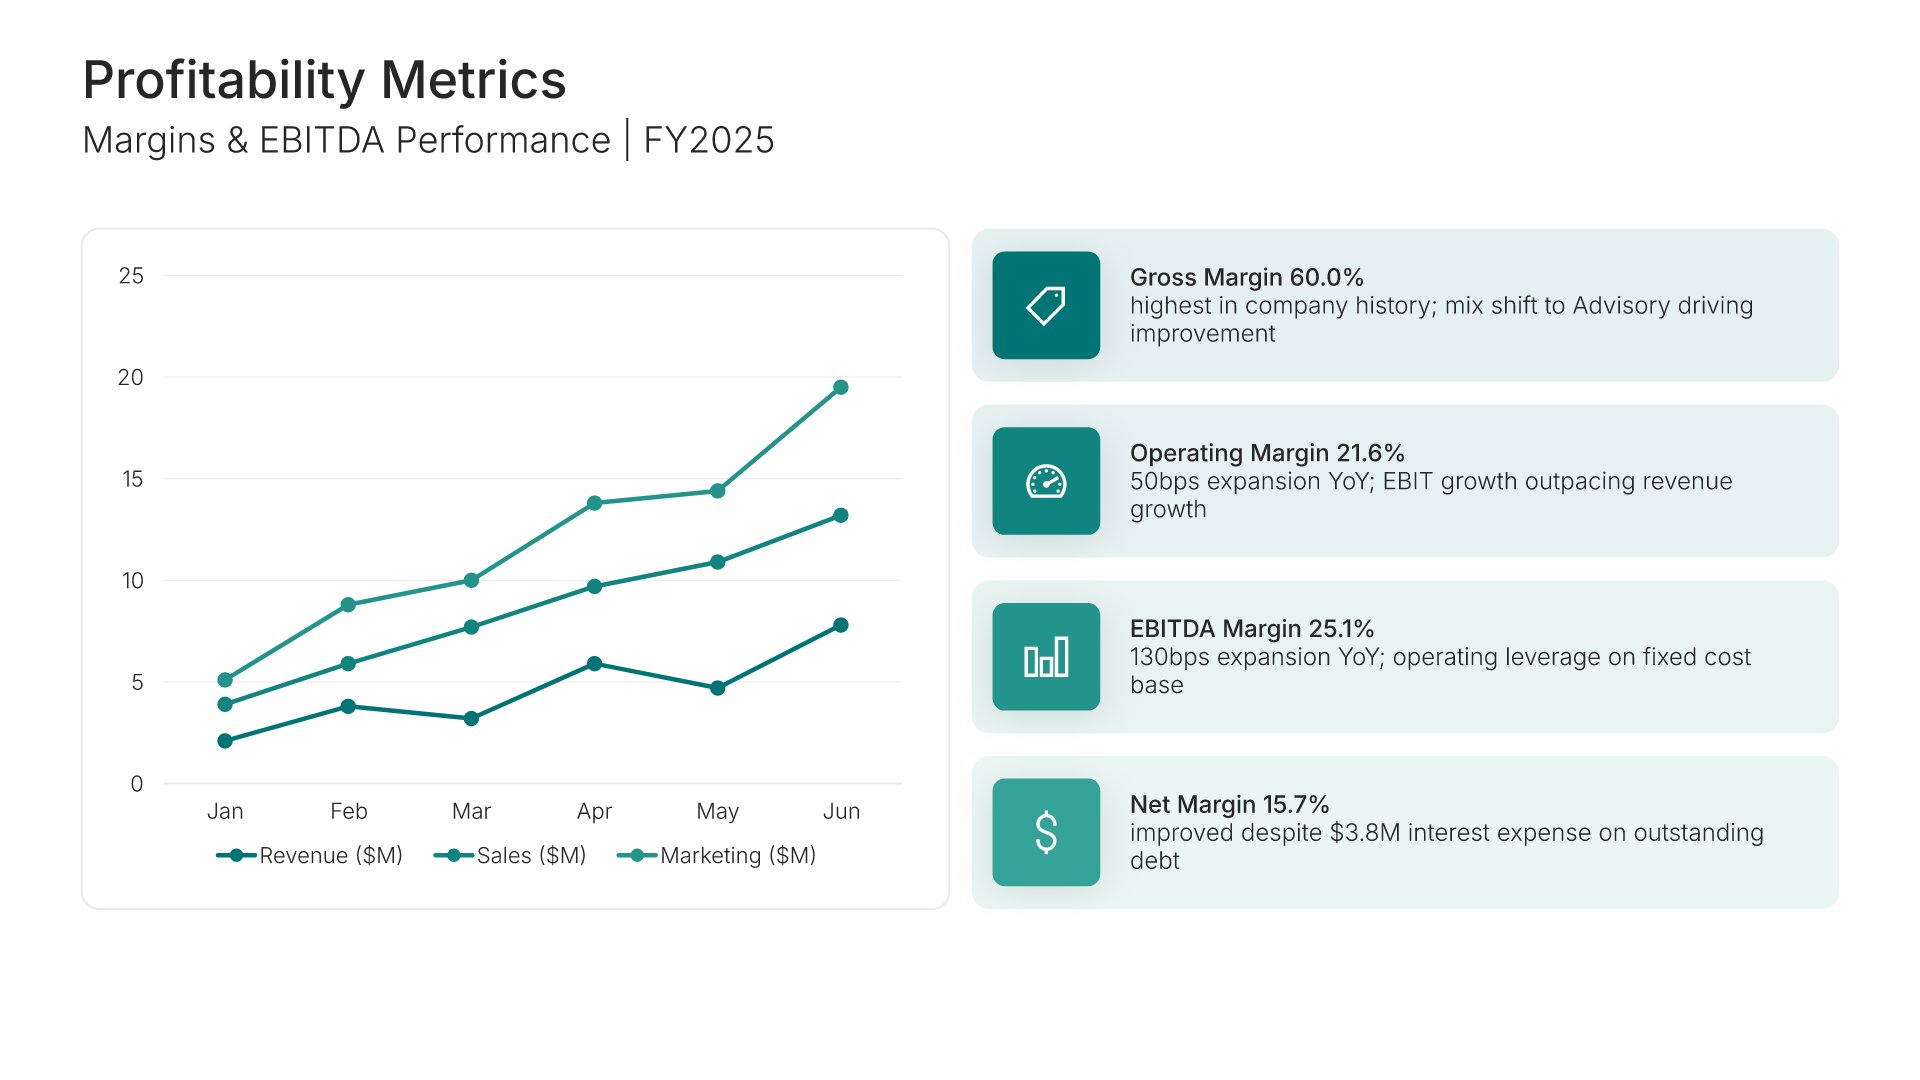
Profitability metrics slide, comprehensive financial report template, margin and EBITDA trended across the year

Slide 11

Profitability Metrics

Margin and EBITDA performance trended across the year.

Built using “Charts” slide
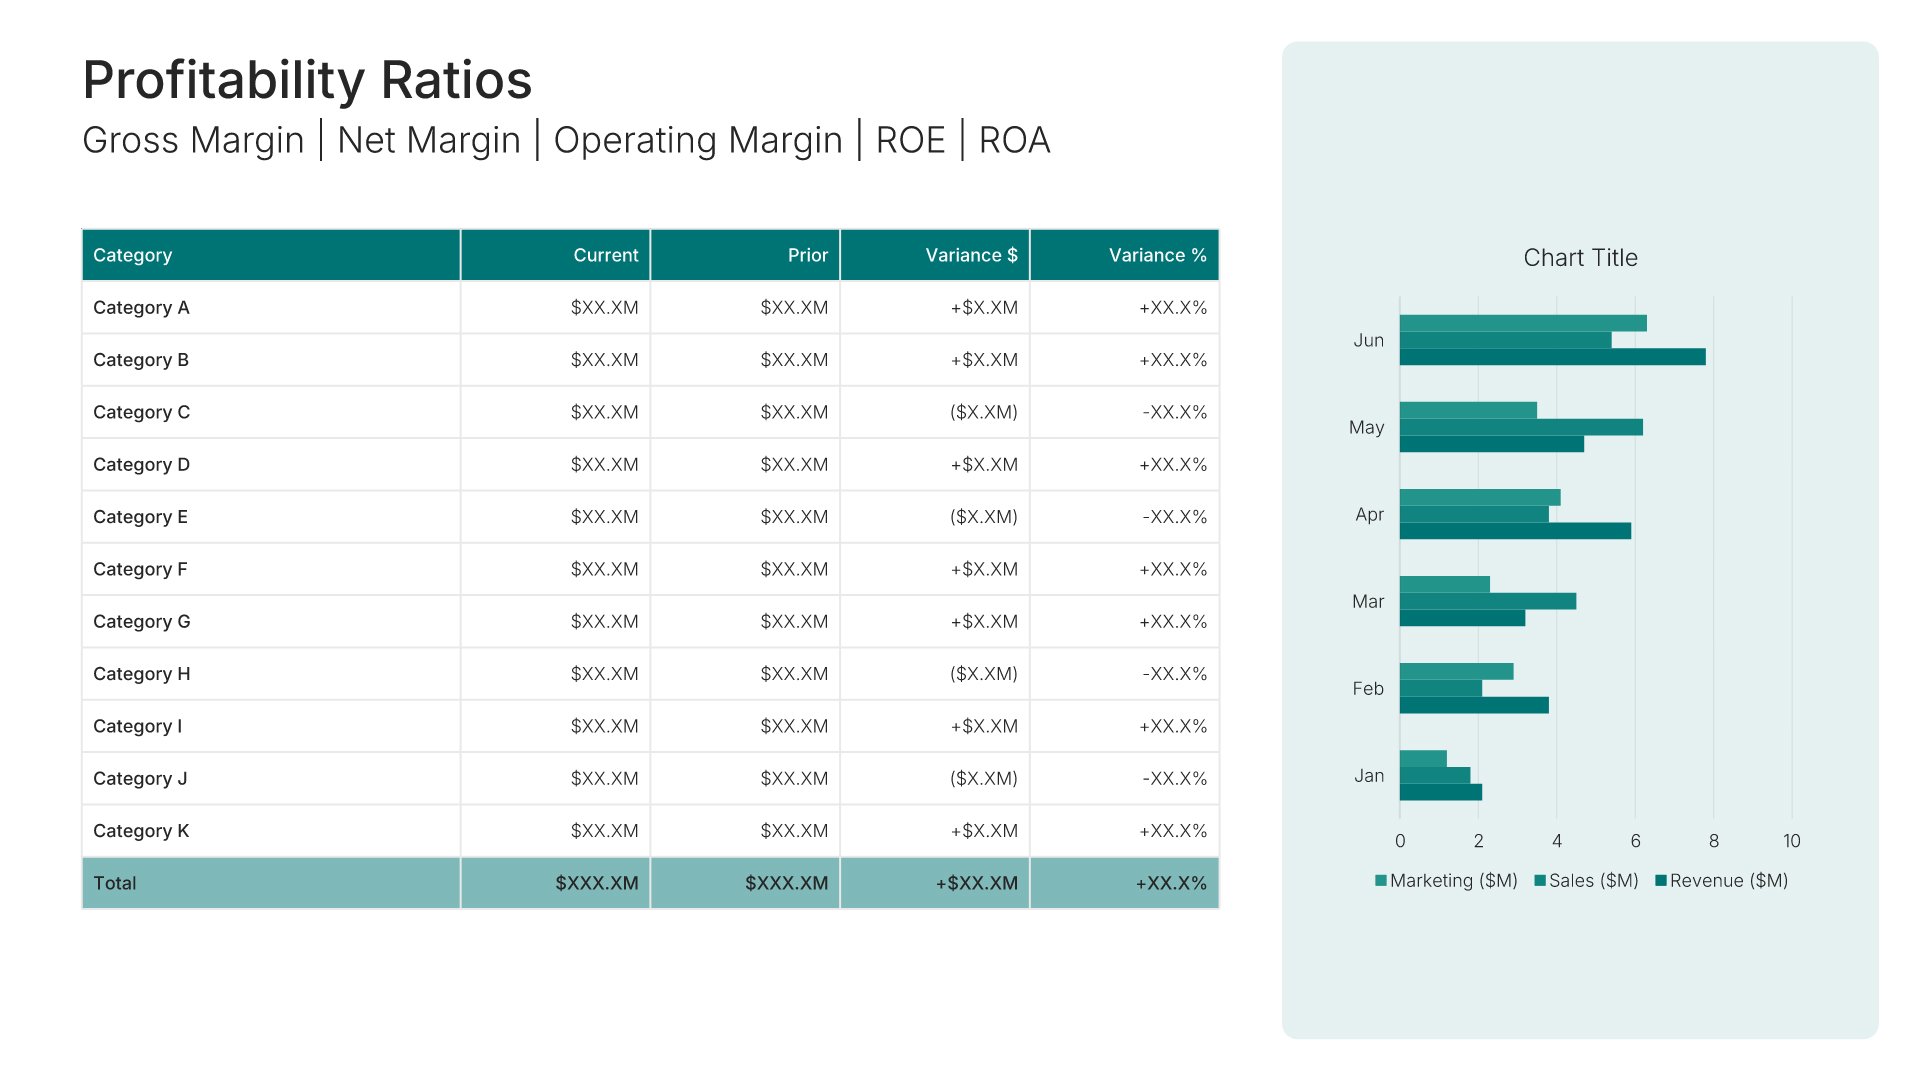
Profitability ratios slide, comprehensive financial report template, margins, return on equity, and return on assets

Slide 12

Profitability Ratios

Gross margin, net margin, operating margin, return on equity, and return on assets.

Built using “Charts” slide
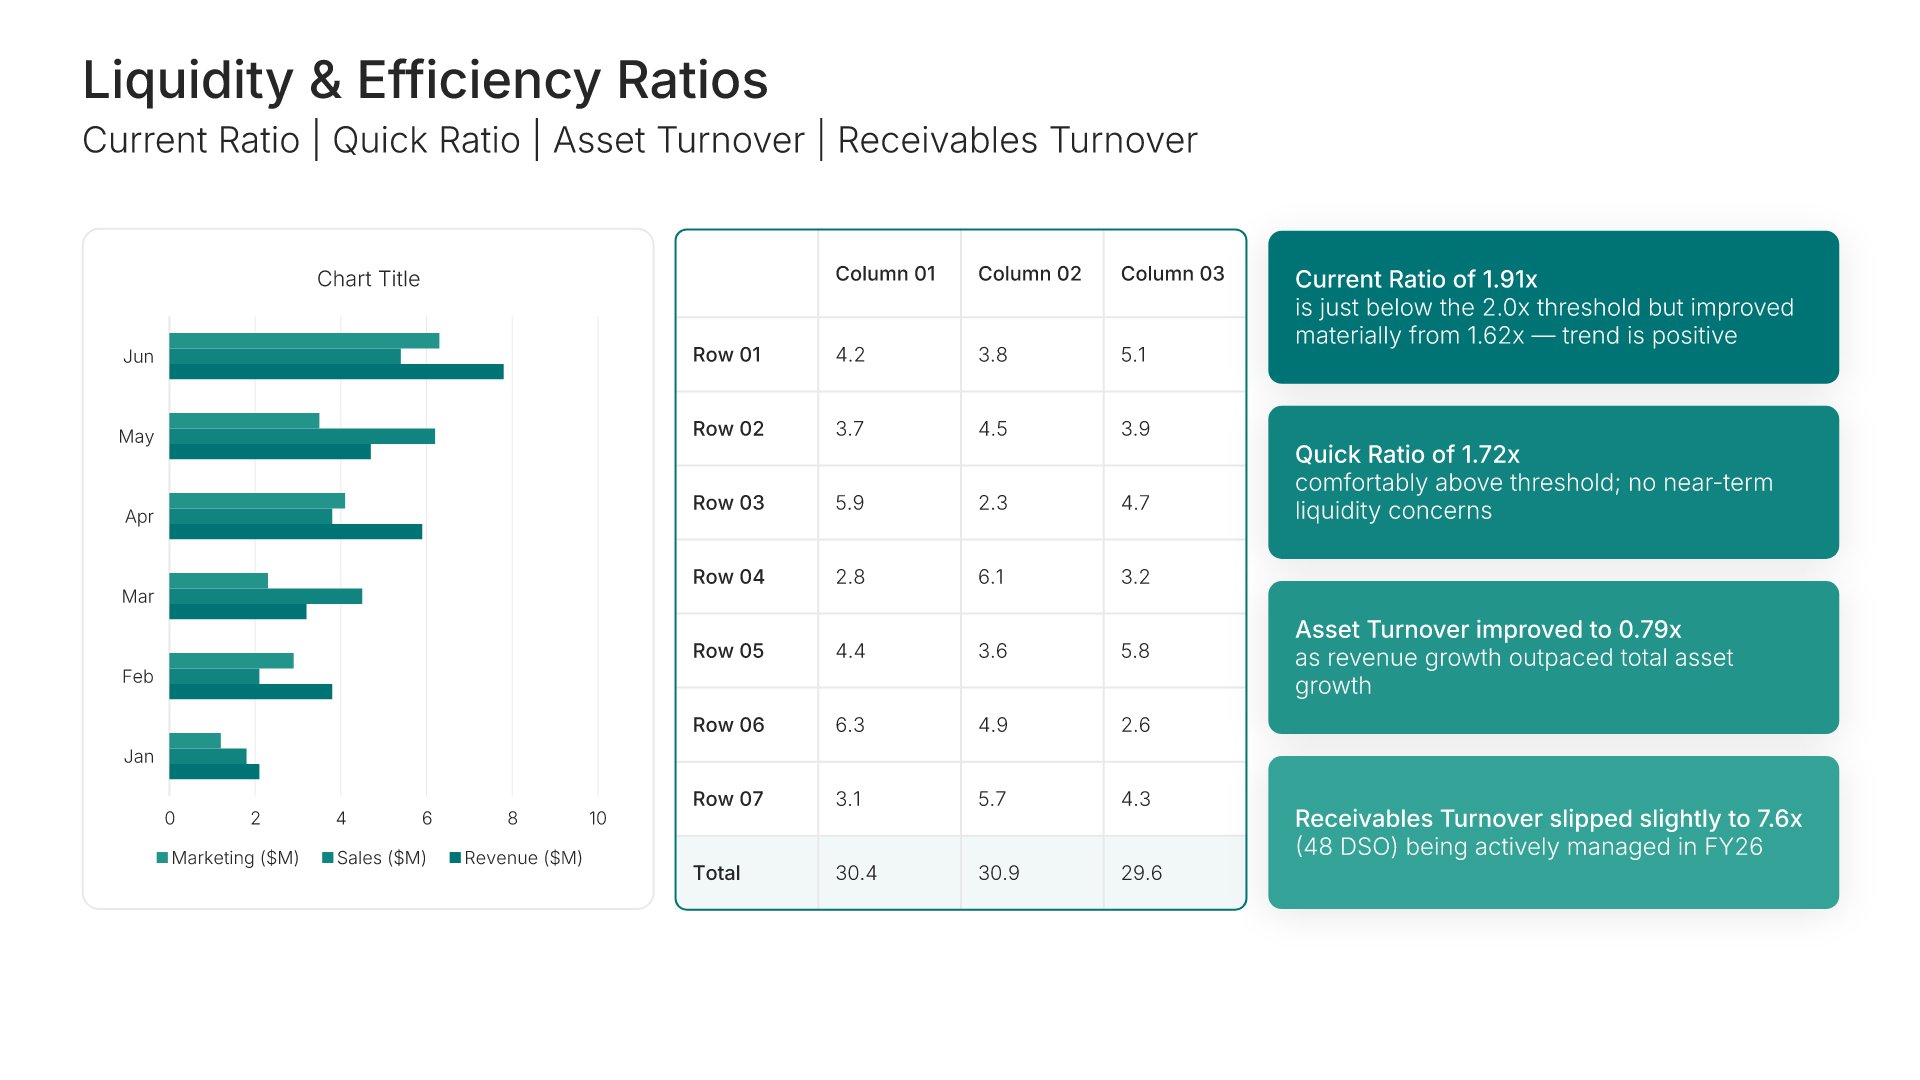
Liquidity and efficiency ratios slide, comprehensive financial report template, current ratio, quick ratio, and turnover

Slide 13

Liquidity & Efficiency Ratios

Current ratio, quick ratio, asset turnover, and receivables turnover, charted and tabled.

Built using “KPI Dashboard” slide
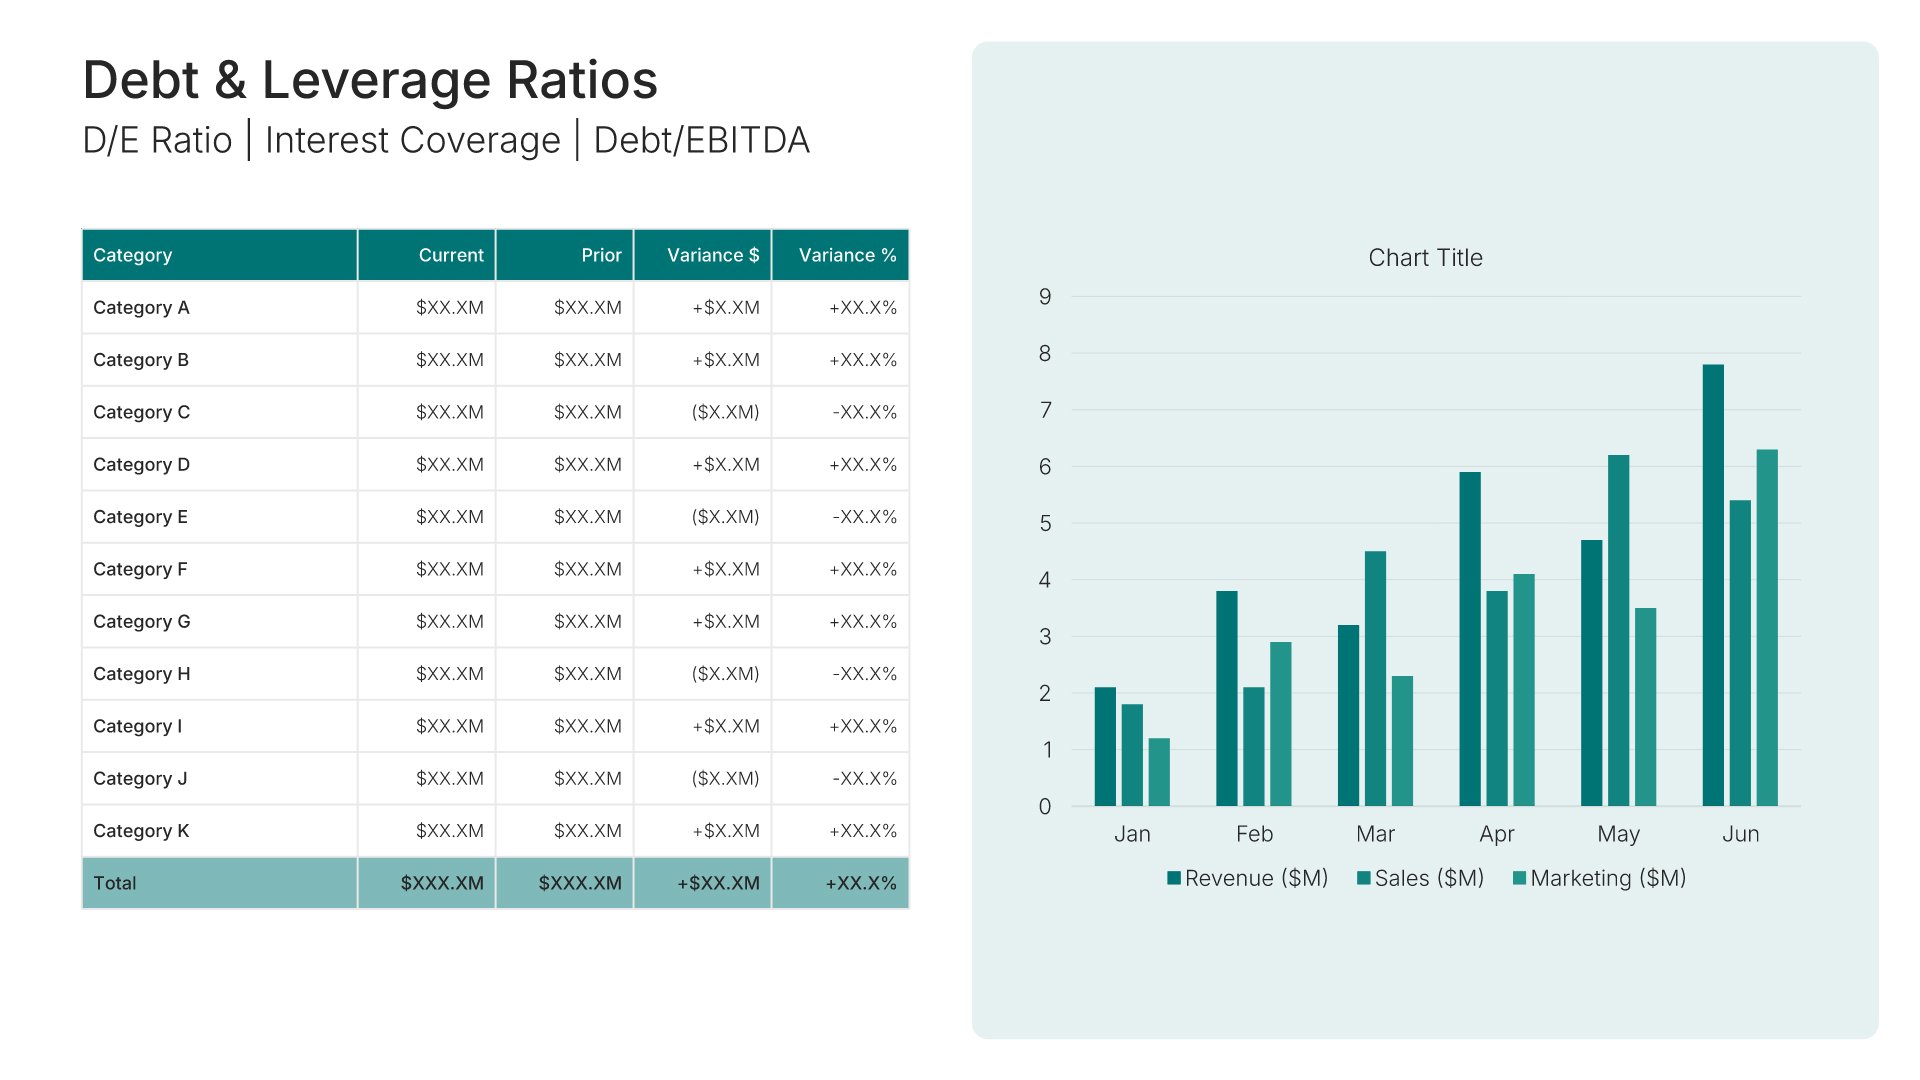
Debt and leverage ratios slide, comprehensive financial report template, debt to equity and interest coverage

Slide 14

Debt & Leverage Ratios

Debt to equity, interest coverage, and debt to EBITDA, against prior year.

Built using “Charts” slide
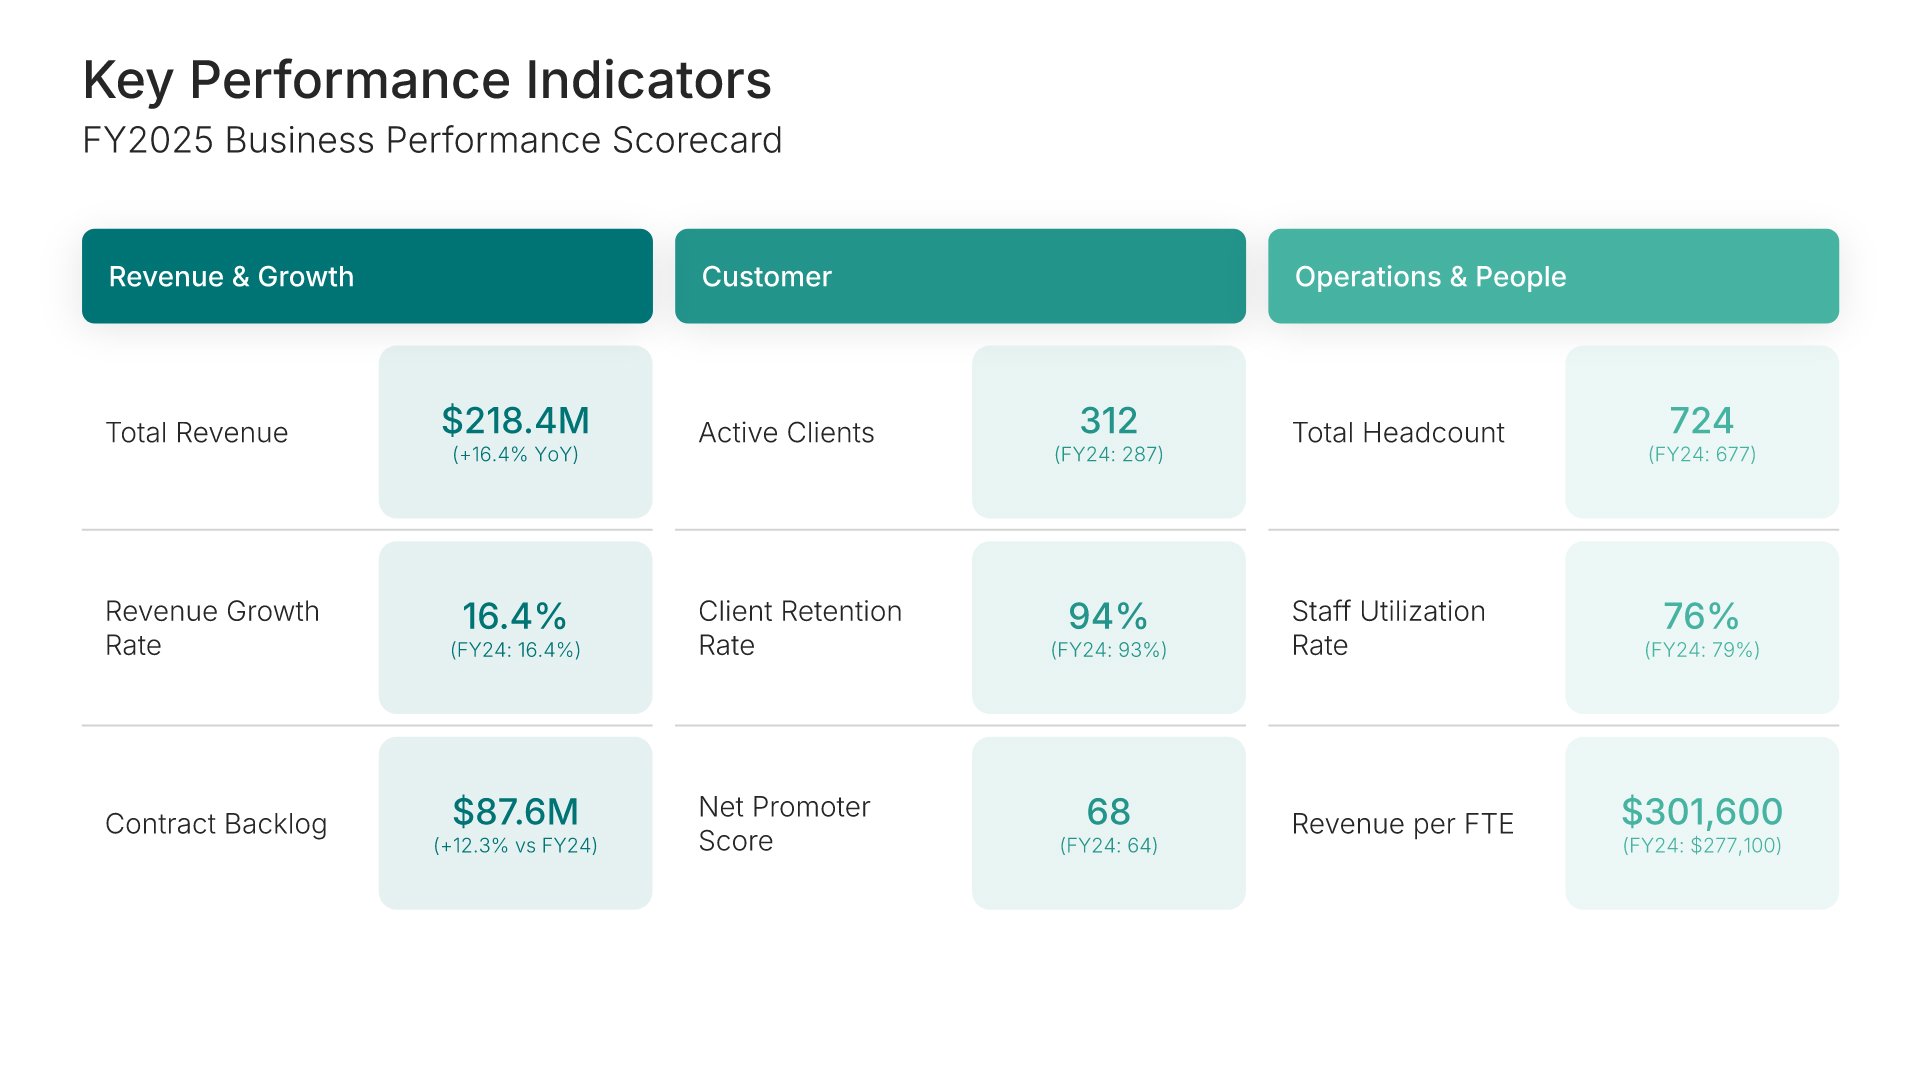
Key performance indicators slide, comprehensive financial report template, business scorecard across five metric groups

Slide 15

Key Performance Indicators

A business scorecard across revenue, growth, customer, operational, and people metrics.

Built using “Simple Numbers” slide
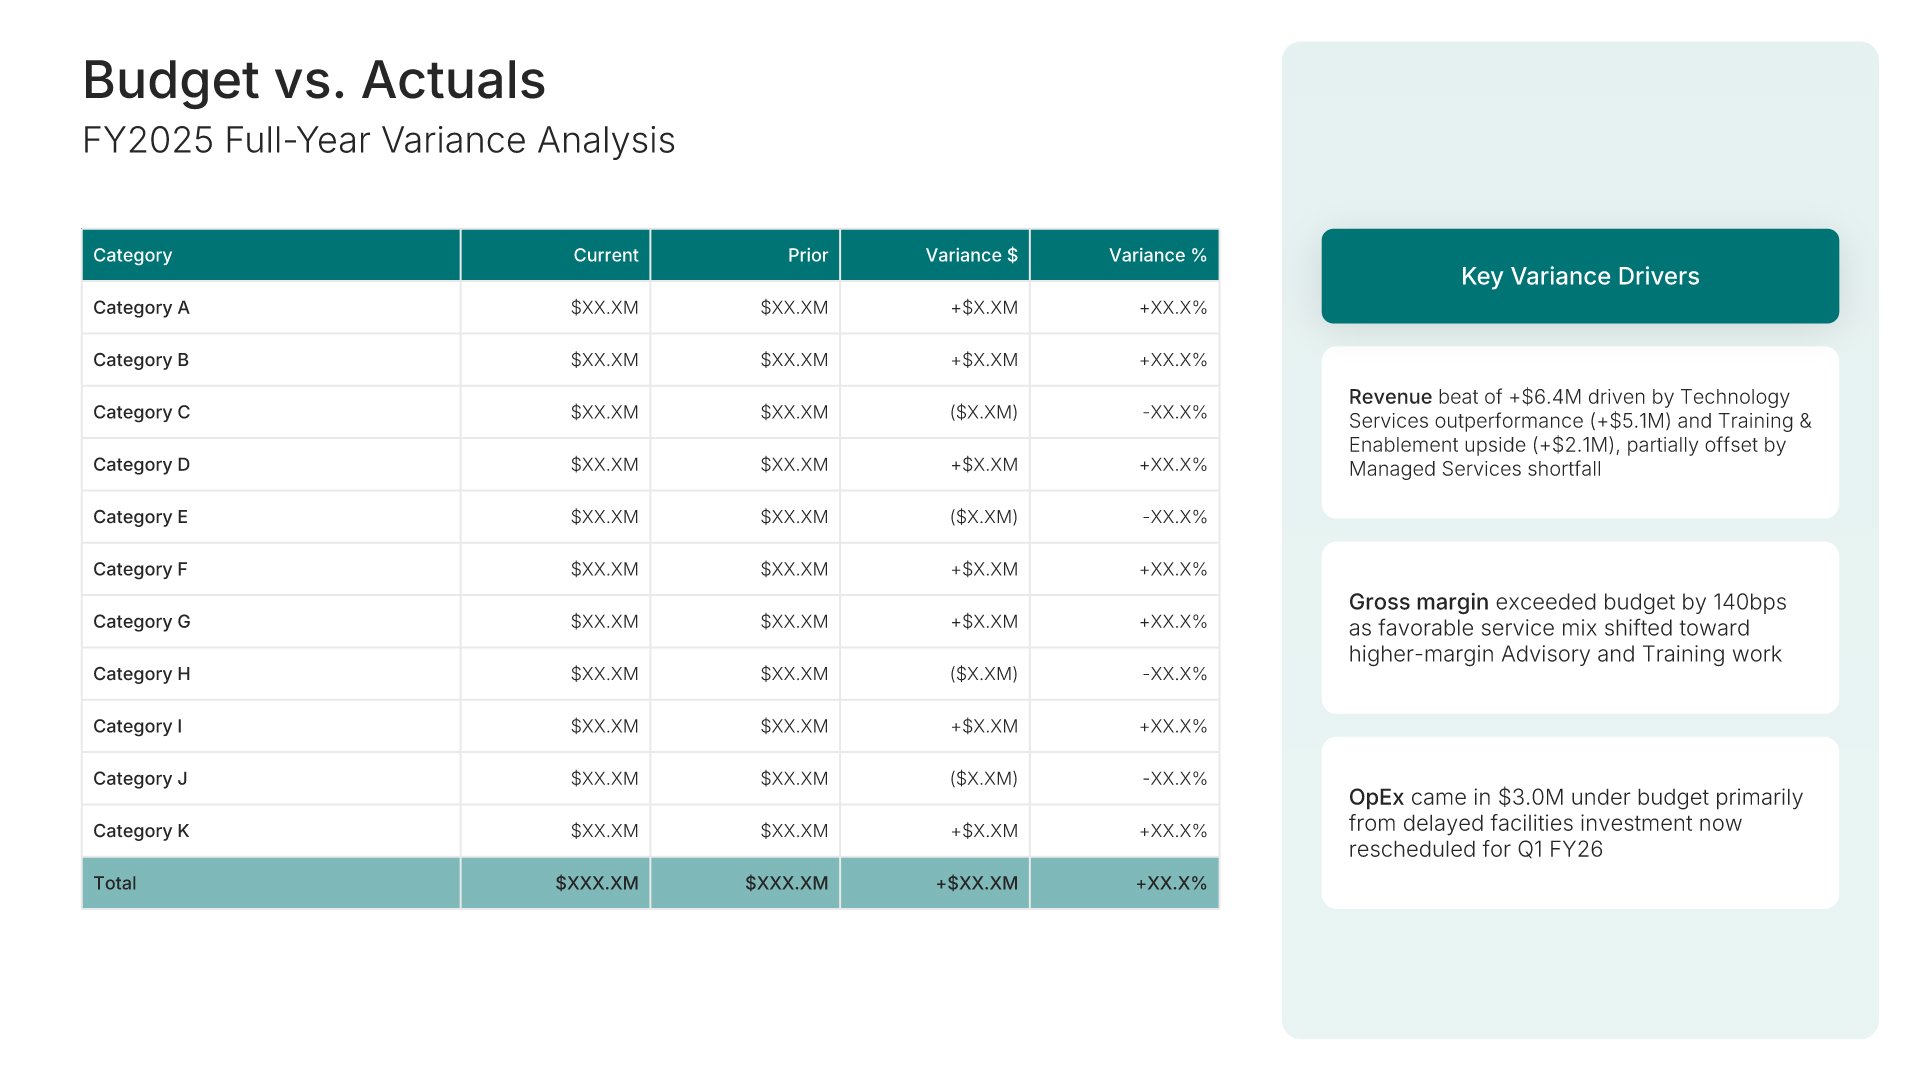
Budget vs. actuals slide, comprehensive financial report template, full-year variance against plan

Slide 16

Budget vs. Actuals

Full-year variance analysis, every line against plan with the reason beside it.

Built using “Financial Table” slide
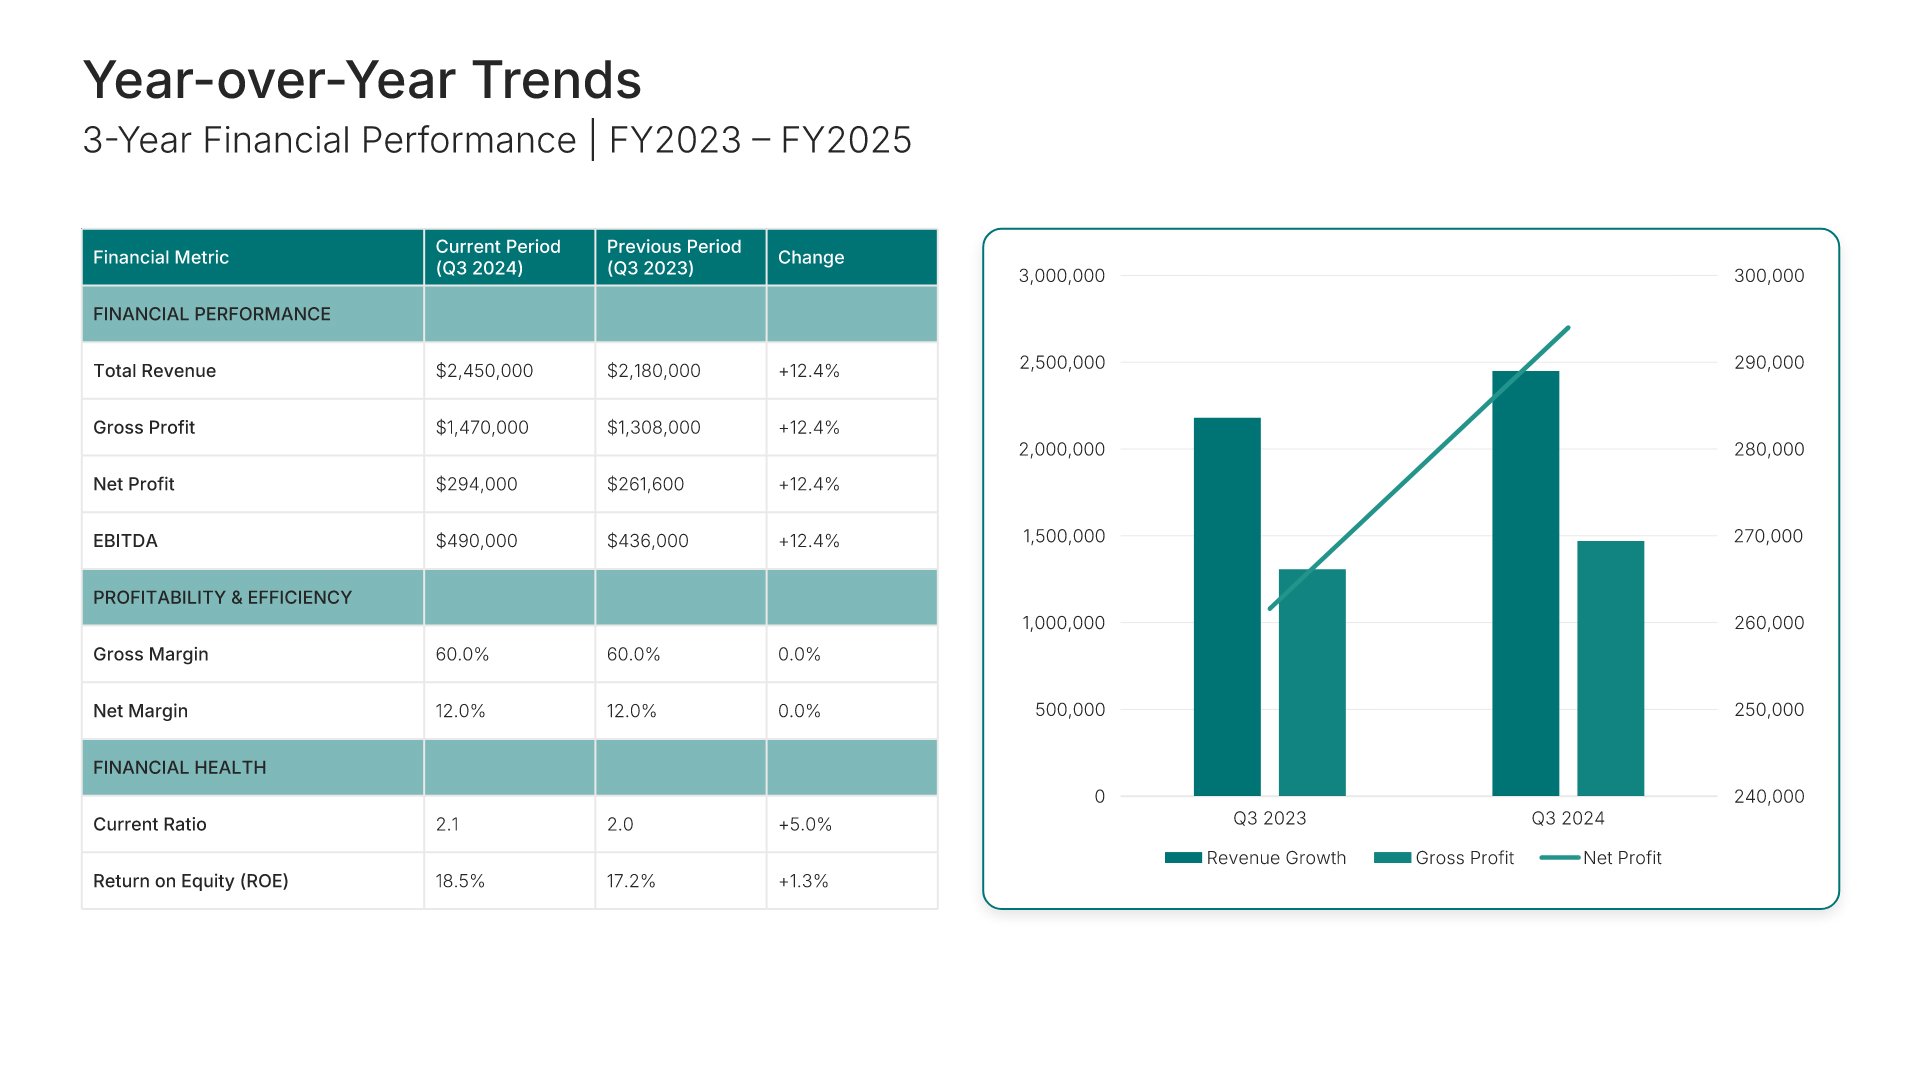
Multi-year trends slide, comprehensive financial report template, three years of headline figures

Slide 17

Multi-Year Trends

Three-year performance across every headline figure, tabled and charted.

Built using “Financial Table” slide
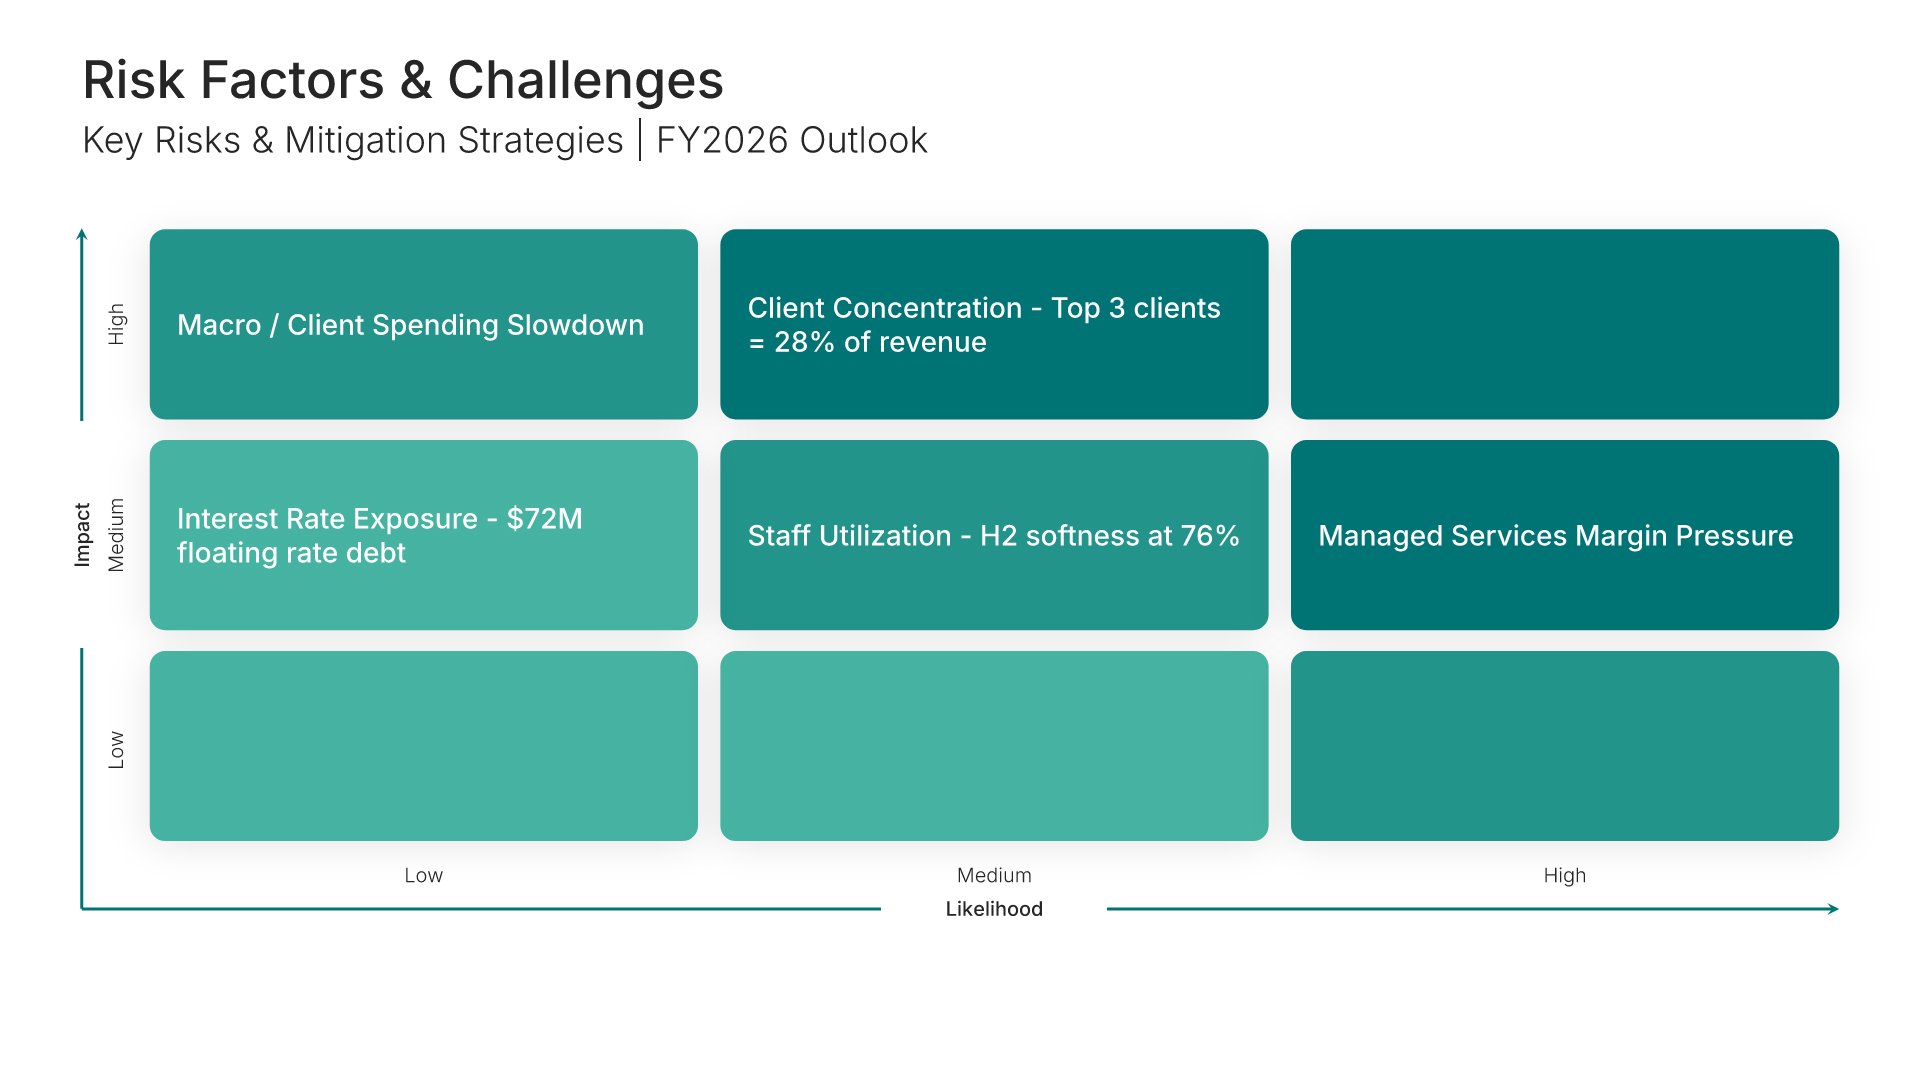
Risk factors and challenges slide, comprehensive financial report template, risks plotted by likelihood and impact

Slide 18

Risk Factors & Challenges

Each risk with its likelihood and impact, plotted.

Built using “Matrix (3×3)” slide
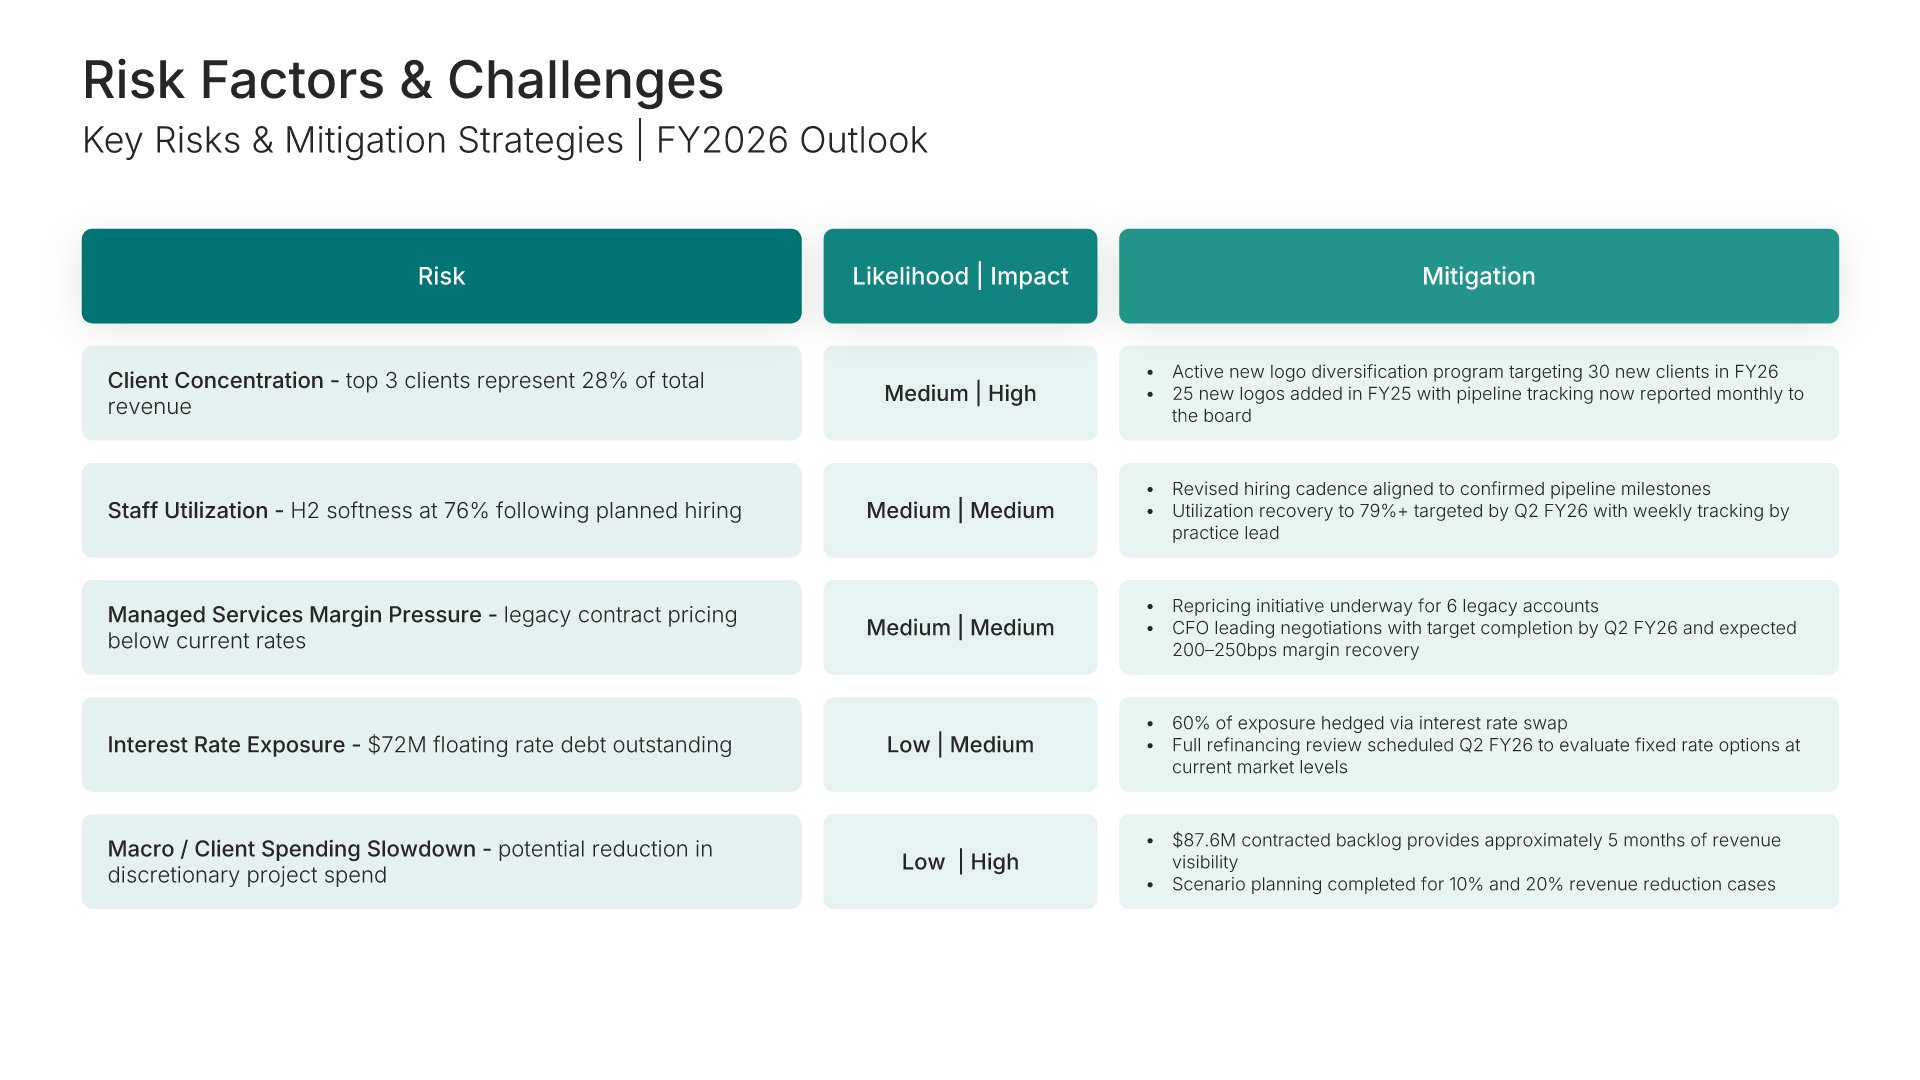
Risk factors and challenges slide, comprehensive financial report template, risks tabled with mitigation strategies

Slide 19

Risk Factors & Challenges

The same risks tabled, with the mitigation strategy against each.

Built using “Table” slide
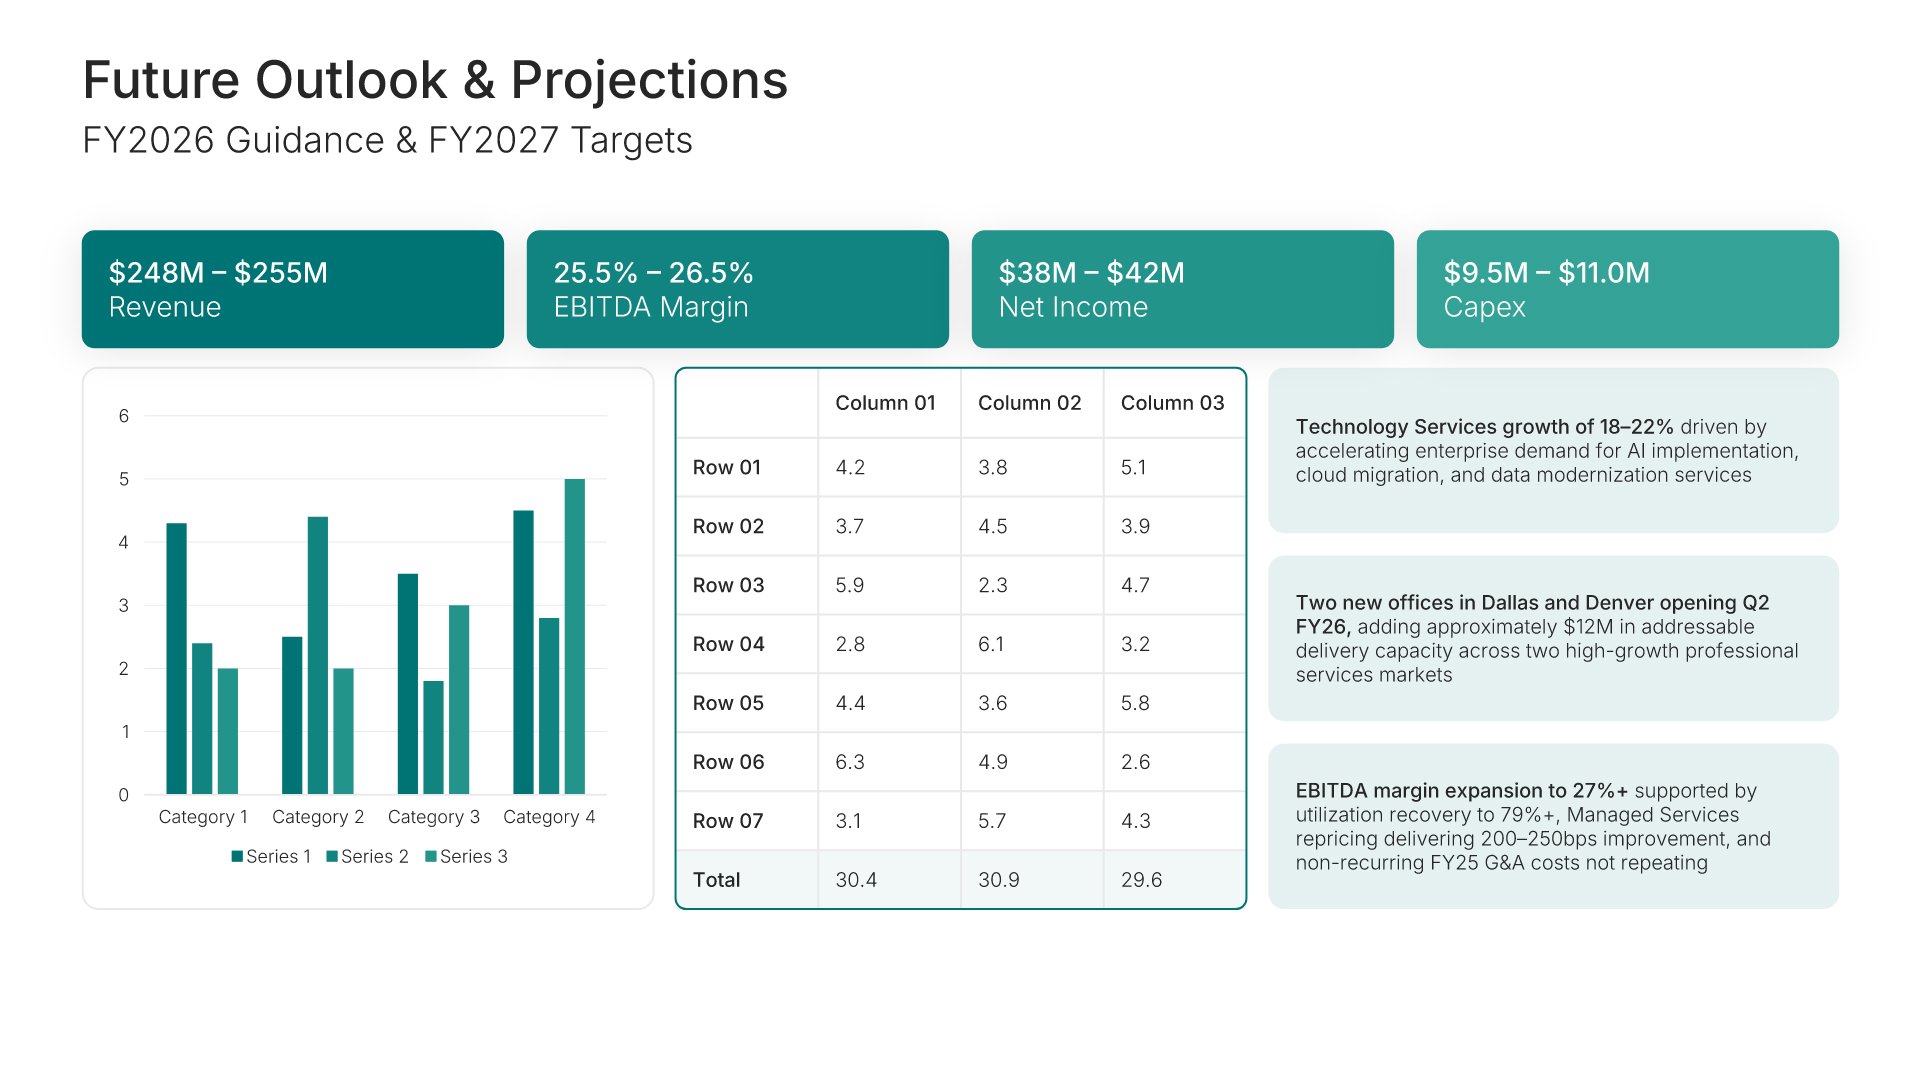
Future outlook slide, comprehensive financial report template, next year's guidance, ranges, and assumptions

Slide 20

Future Outlook

Next year's guidance and targets, with the ranges and the assumptions behind them.

Built using “KPI Dashboard” slide
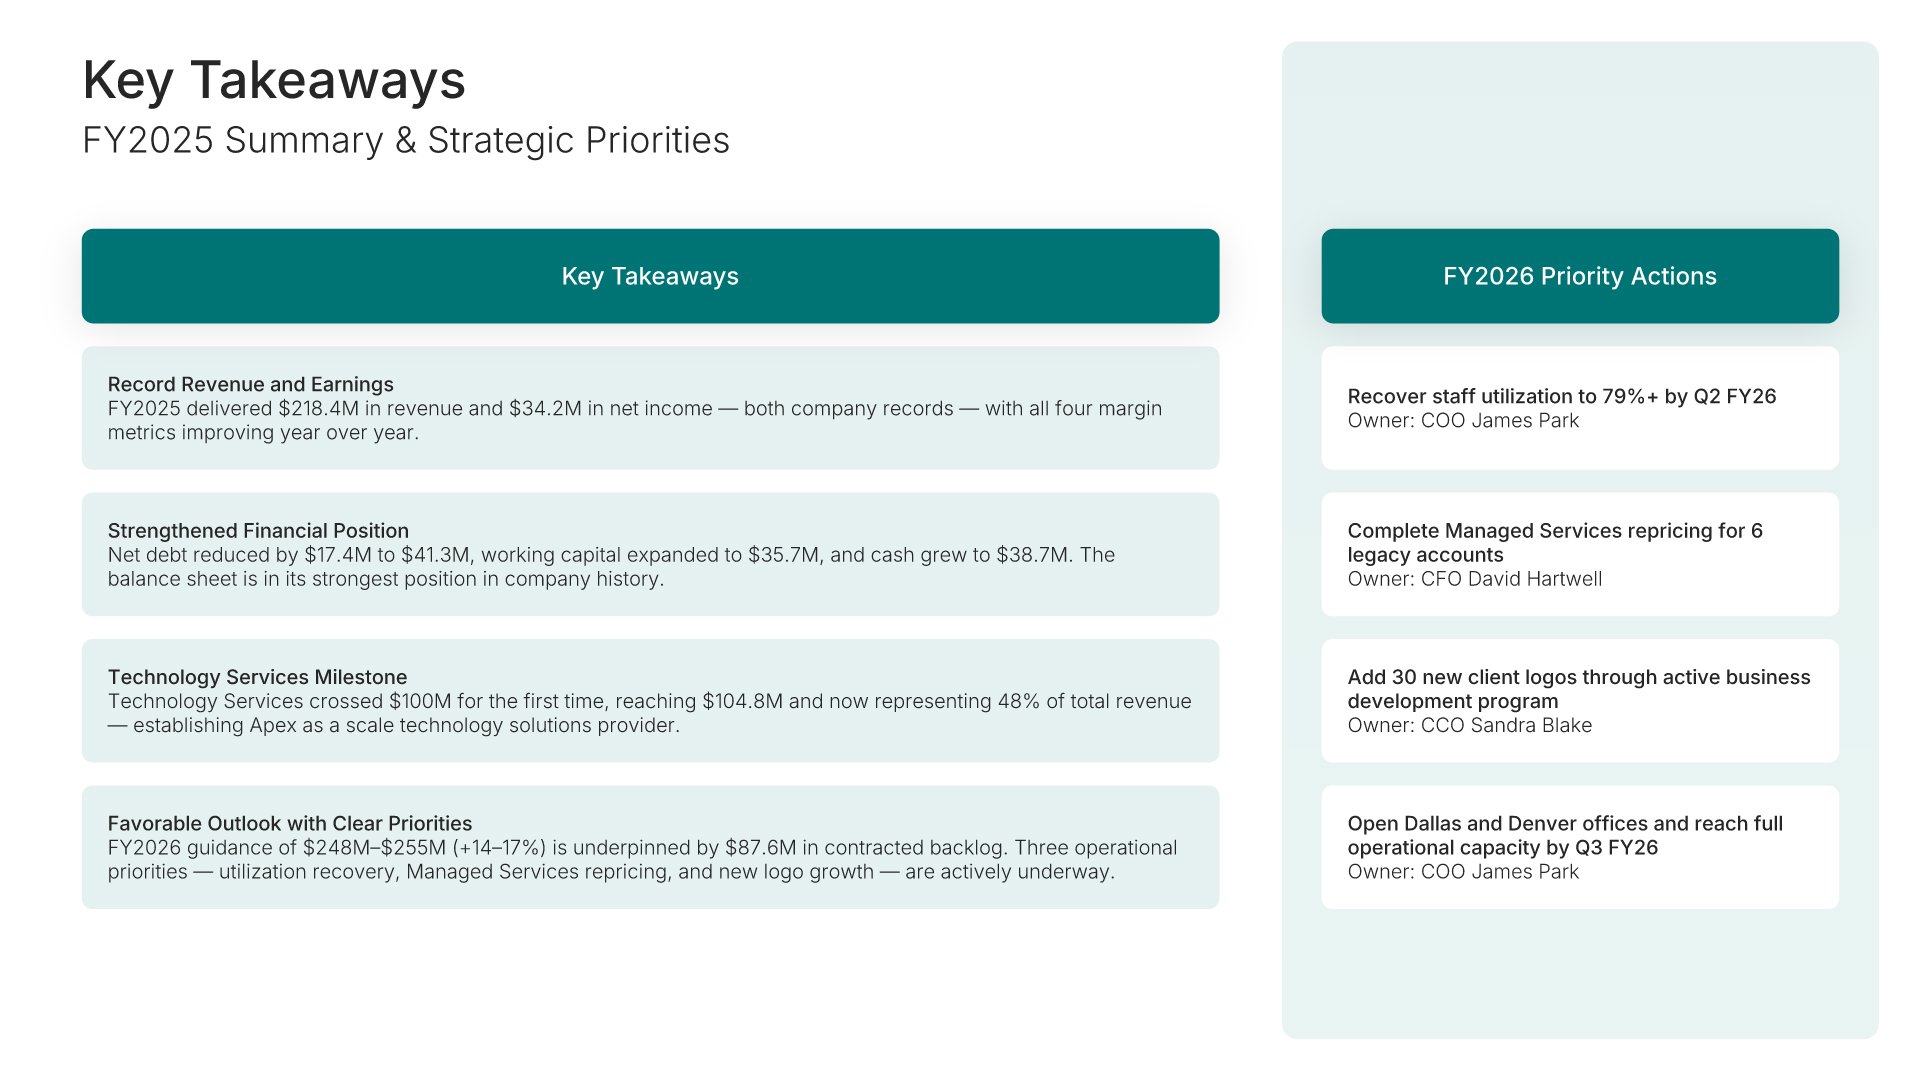
Key takeaways slide, comprehensive financial report template, the year summarized with strategic priorities

Slide 21

Key Takeaways

The year summarized, with the strategic priorities that follow from it.

Built using “One Pager / Snapshot” slide

Thank you slide, comprehensive financial report template, contact details and close

Slide 22

Thank You

Contact details and a clean close.

Built using “Thank You” slide

About the comprehensive financial report template

The structure, the slides, your brand, and a file you can edit anywhere.

Built for the ratios a lender reads after the statements

Statements tell you what happened. Ratios tell you whether it was any good. This is the only report in the set that carries both in full: the three statements, then three dedicated ratio slides covering profitability, liquidity and efficiency, and debt and leverage. It’s built for an audit committee, a lender, or anyone who reads past the headline.

Built from 9,000+ slides across 134+ categories

Every slide here comes from the same library. Financial tables, ratio charts, KPI dashboards, and comparison layouts are already in it, so adding a fourth ratio group or another year of trends takes a minute. Everything sits on the same grid, so the layout still holds.

Brand the whole presentation in one click

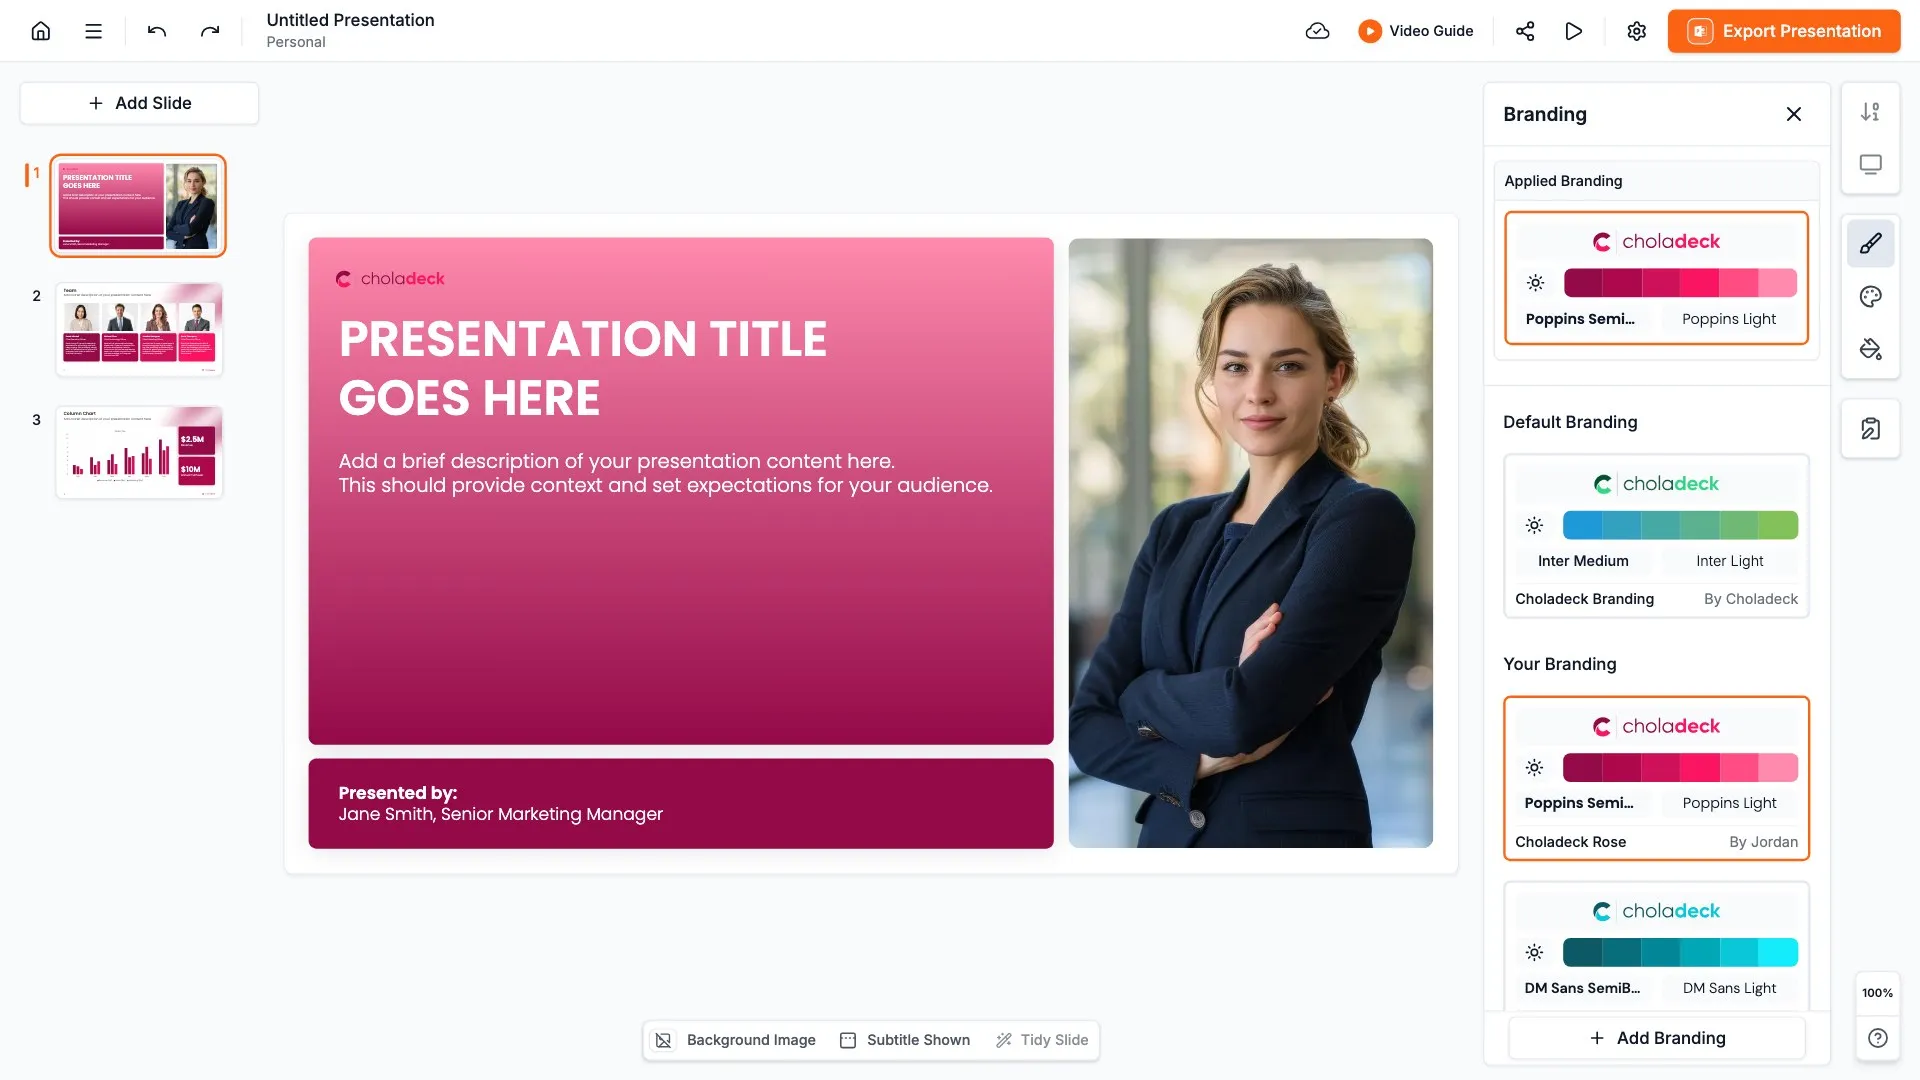
Add your logo, colors, fonts, and background once. It applies to the whole presentation and the entire slide library at the same time. Your financial report, lender updates, and audit committee papers all look like they came from one organization.

Export to PowerPoint, Google Slides, or Keynote

You get a real file, not a locked link. Export it and keep editing in the tool you already use. Every table and chart stays editable, so the figures can move through audit without a rebuild.

How Choladeck works

From blank page to finished presentation in four steps.

STEP 01

Browse 9,000+ slides across 134+ categories, or open one of the 74 premade presentations.

STEP 02

Add your logo, colors, and fonts in one click. The whole presentation instantly matches your company.

STEP 03

Add your text, numbers, charts, and tables. Everything on the slide is editable.

STEP 04

Send it to PowerPoint, Google Slides, or Keynote, and present.
Build your own

Nothing here fits? Build your own comprehensive financial report

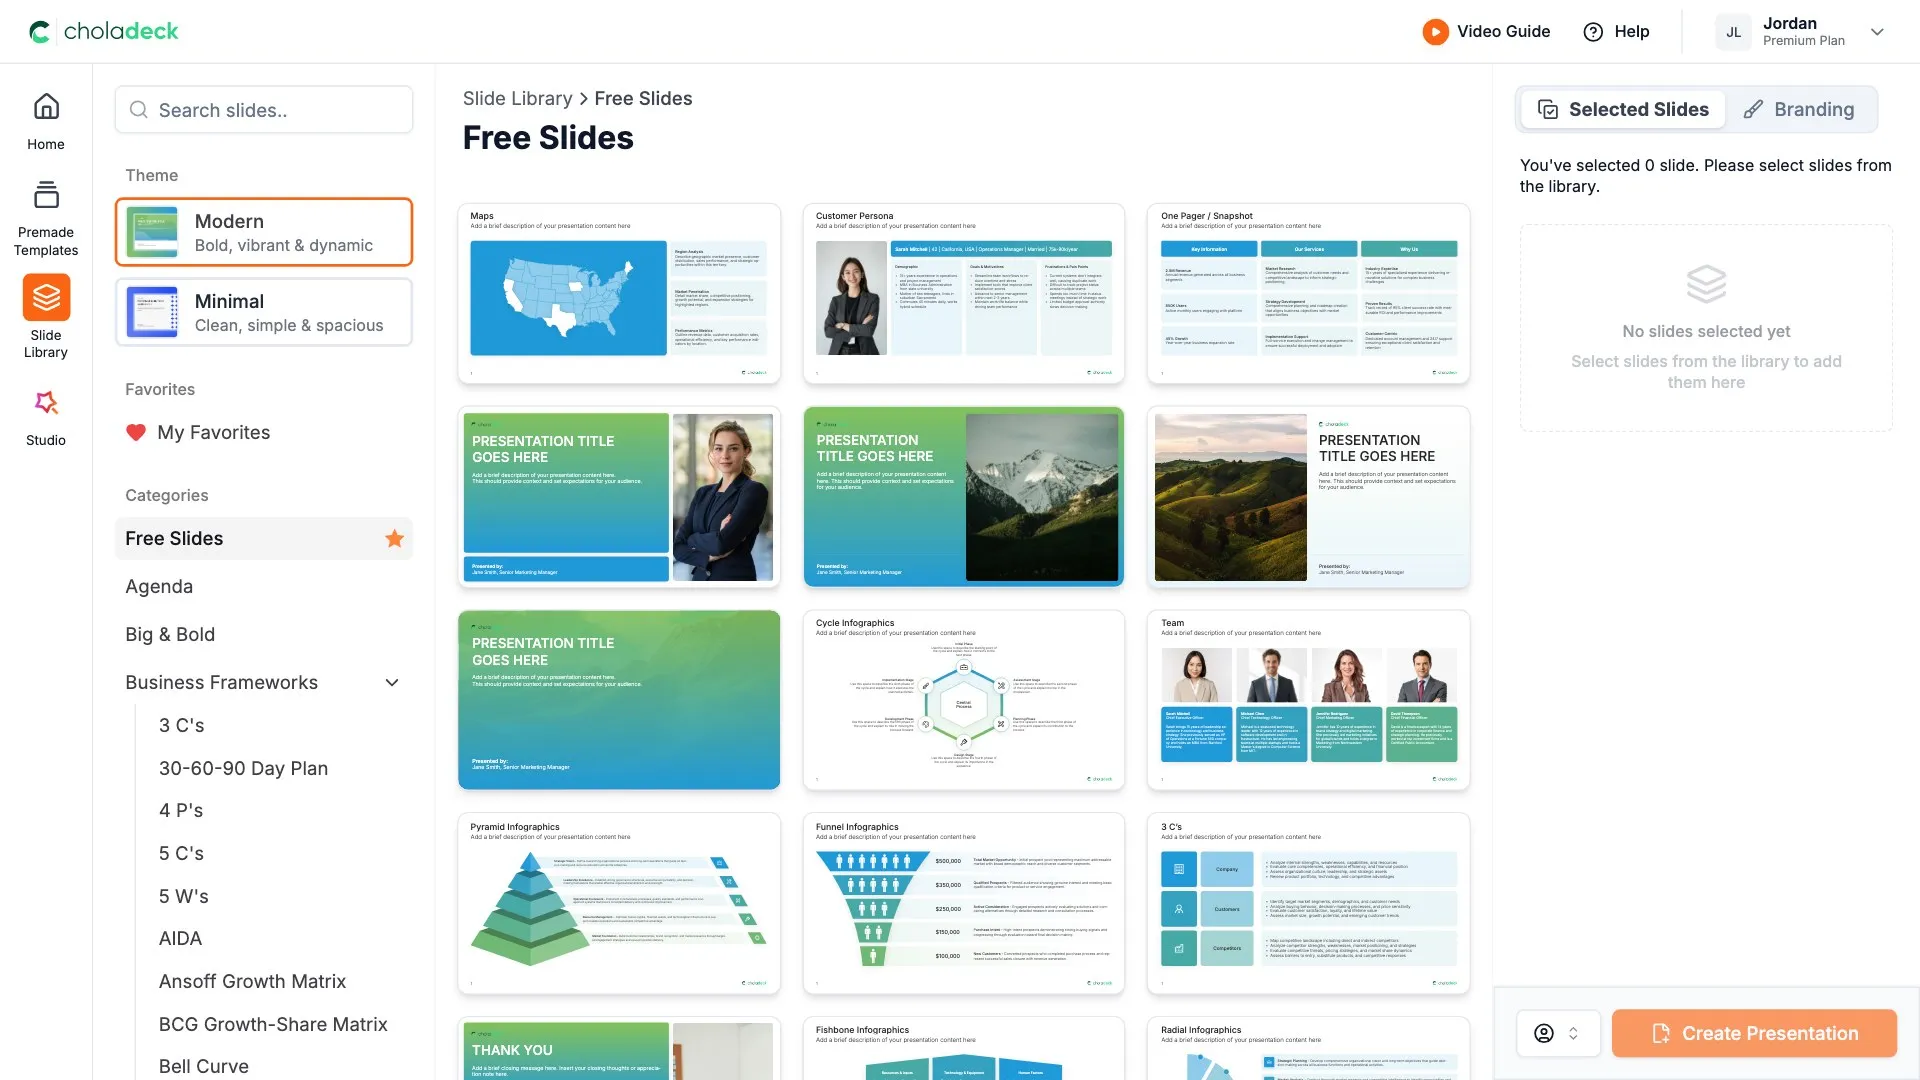
This template is assembled from the same 9,000+ slides. Pick the slides you need, drop them into one file, and brand the whole thing in one click.
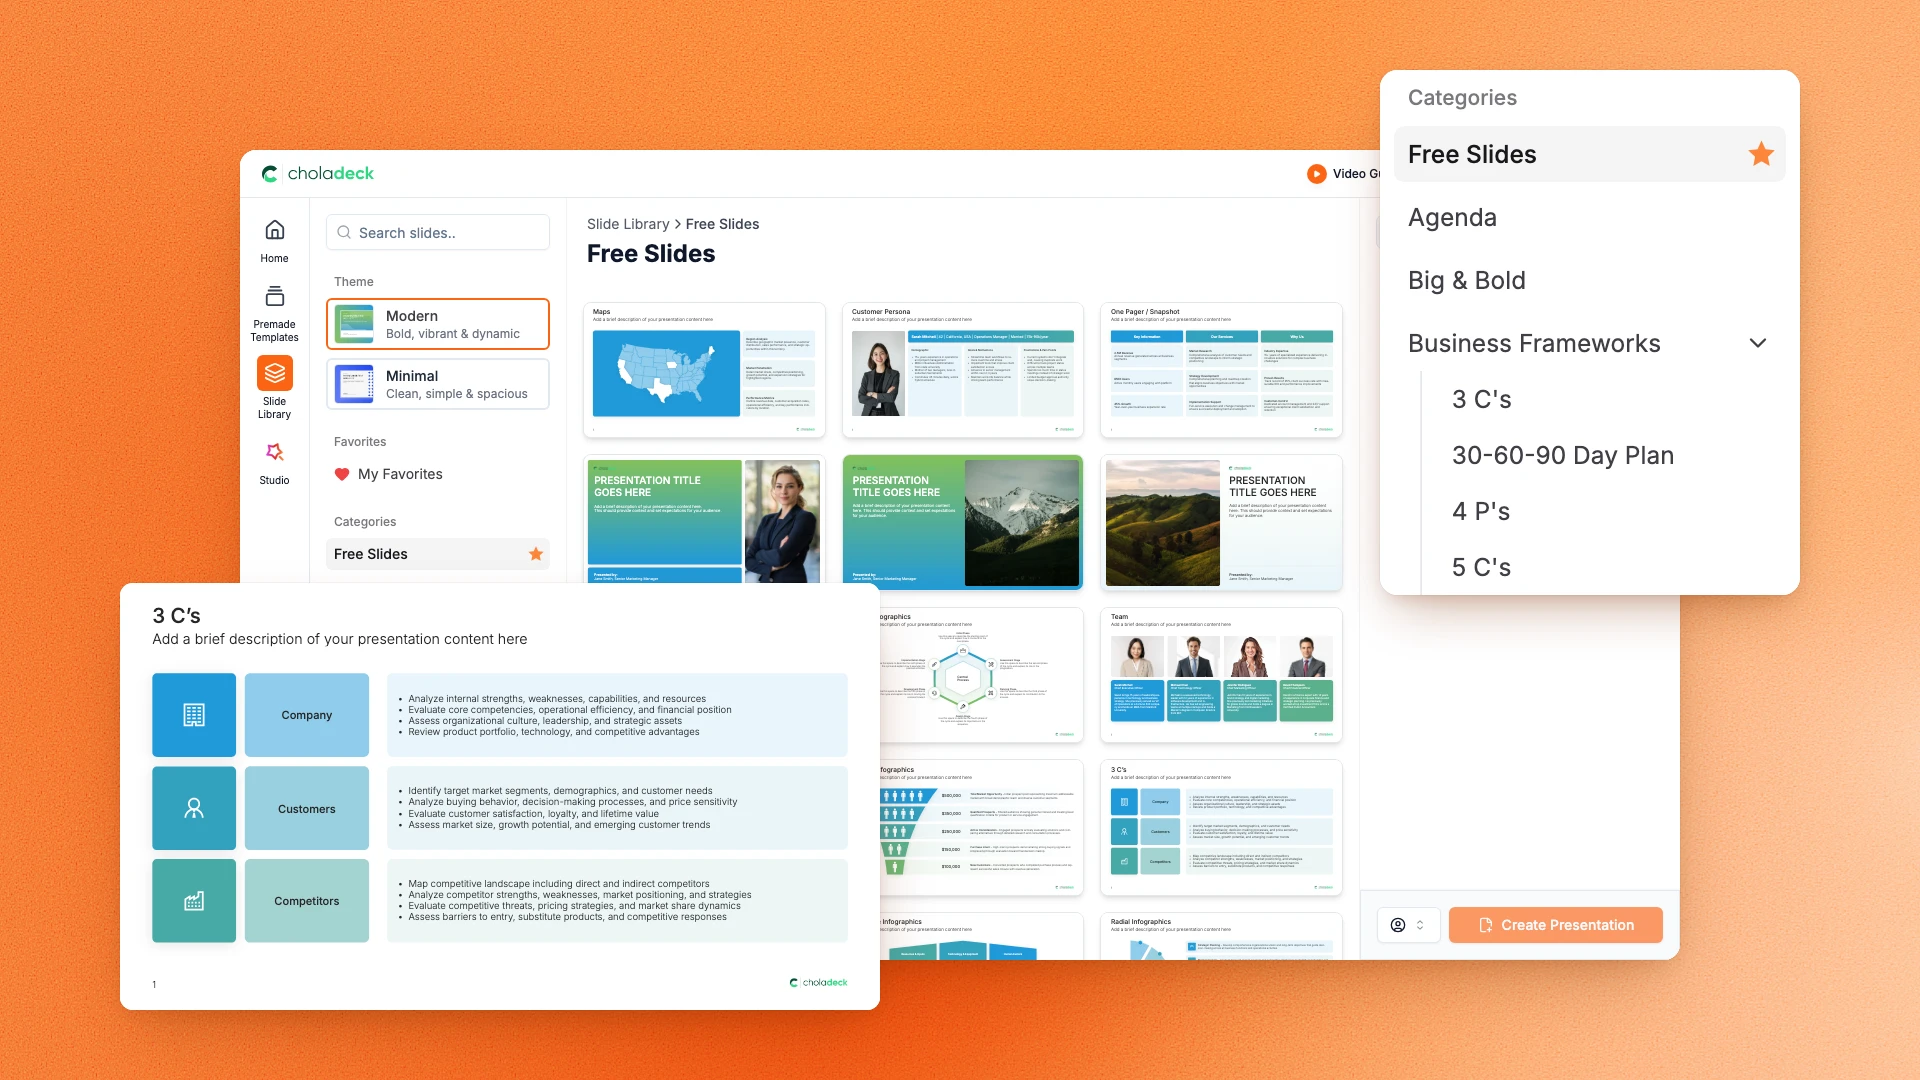
Choladeck slide library on Free Slides, with its category list and the 3 C’s slide shown larger

Questions about the comprehensive financial report template

What's inside the template, and how far you can change it.

Using the template

Is the template fully editable?

+

Yes. Text, tables, charts, icons, and colors on every slide are yours to change. Nothing is locked and nothing is a flat image.

How do I brand it to my organization?

+

Add your logo, colors, fonts, and background once. It applies to the whole presentation and the entire slide library at the same time.

Can I add slides from the slide library?

+

Yes. Add any slide from the library into this one, or swap out one that doesn't fit. Everything works together.

What's included

Which ratios are covered?

+

Three slides. Profitability covers gross, net, and operating margin, plus return on equity and assets. Liquidity and efficiency covers current ratio, quick ratio, and turnover. Debt and leverage covers debt to equity, interest coverage, and debt to EBITDA.

How far back do the trends go?

+

Three years on the multi-year trends slide, with room to extend it. Budget versus actuals runs the full year against plan.

Is placeholder content included?

+

Yes. Every slide comes with realistic text, sample figures, and filled-in charts, so you can see how the comprehensive financial report reads before you put your own numbers in.

Start your comprehensive financial report
from one that's already done

Pick it, brand it, add your content, and export.

Free to start. No credit card required.