Try Choladeck Free: Download Personalized Business Slides Today

Comprehensive Financial Report Premade Template

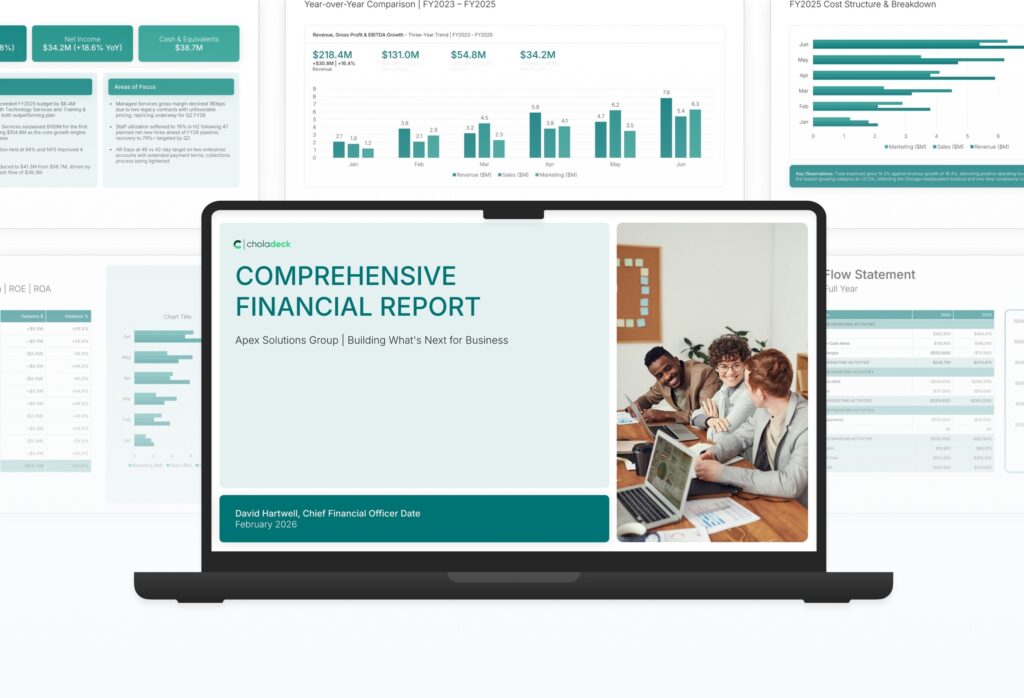
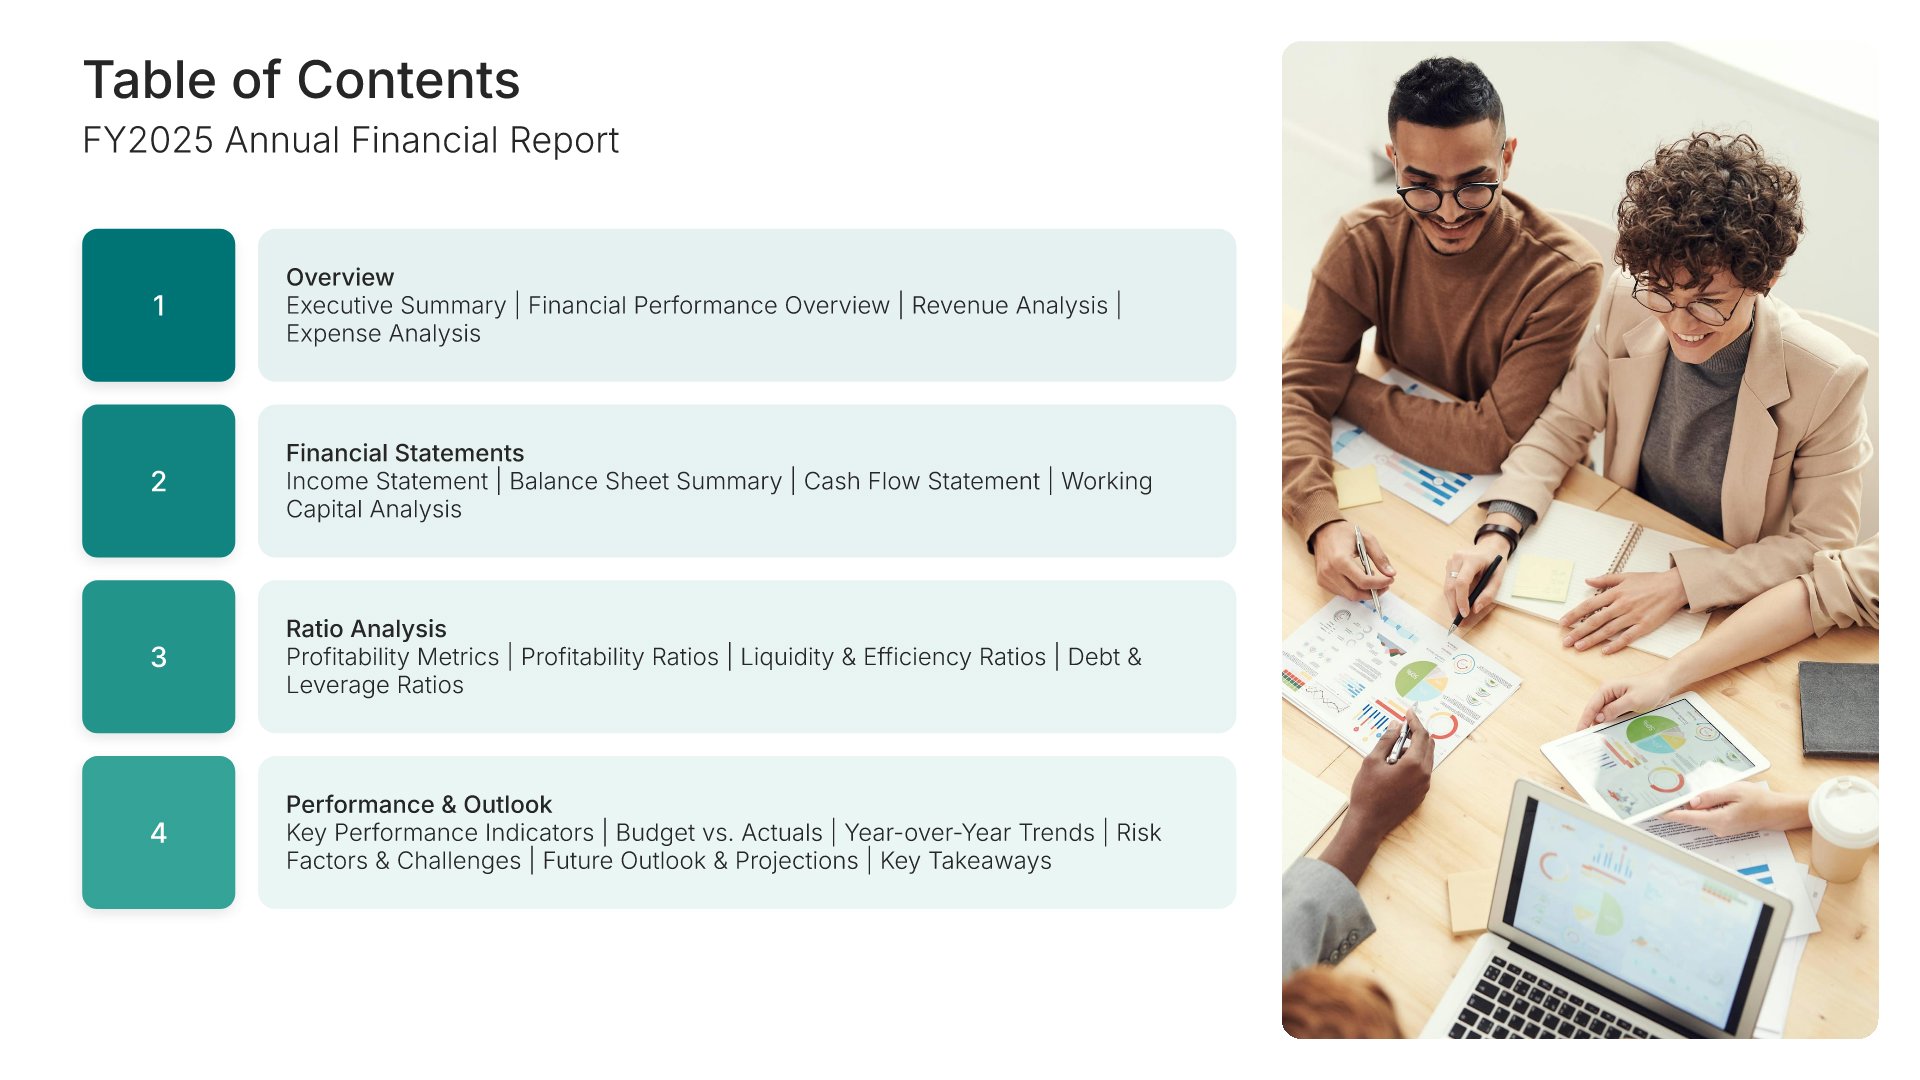
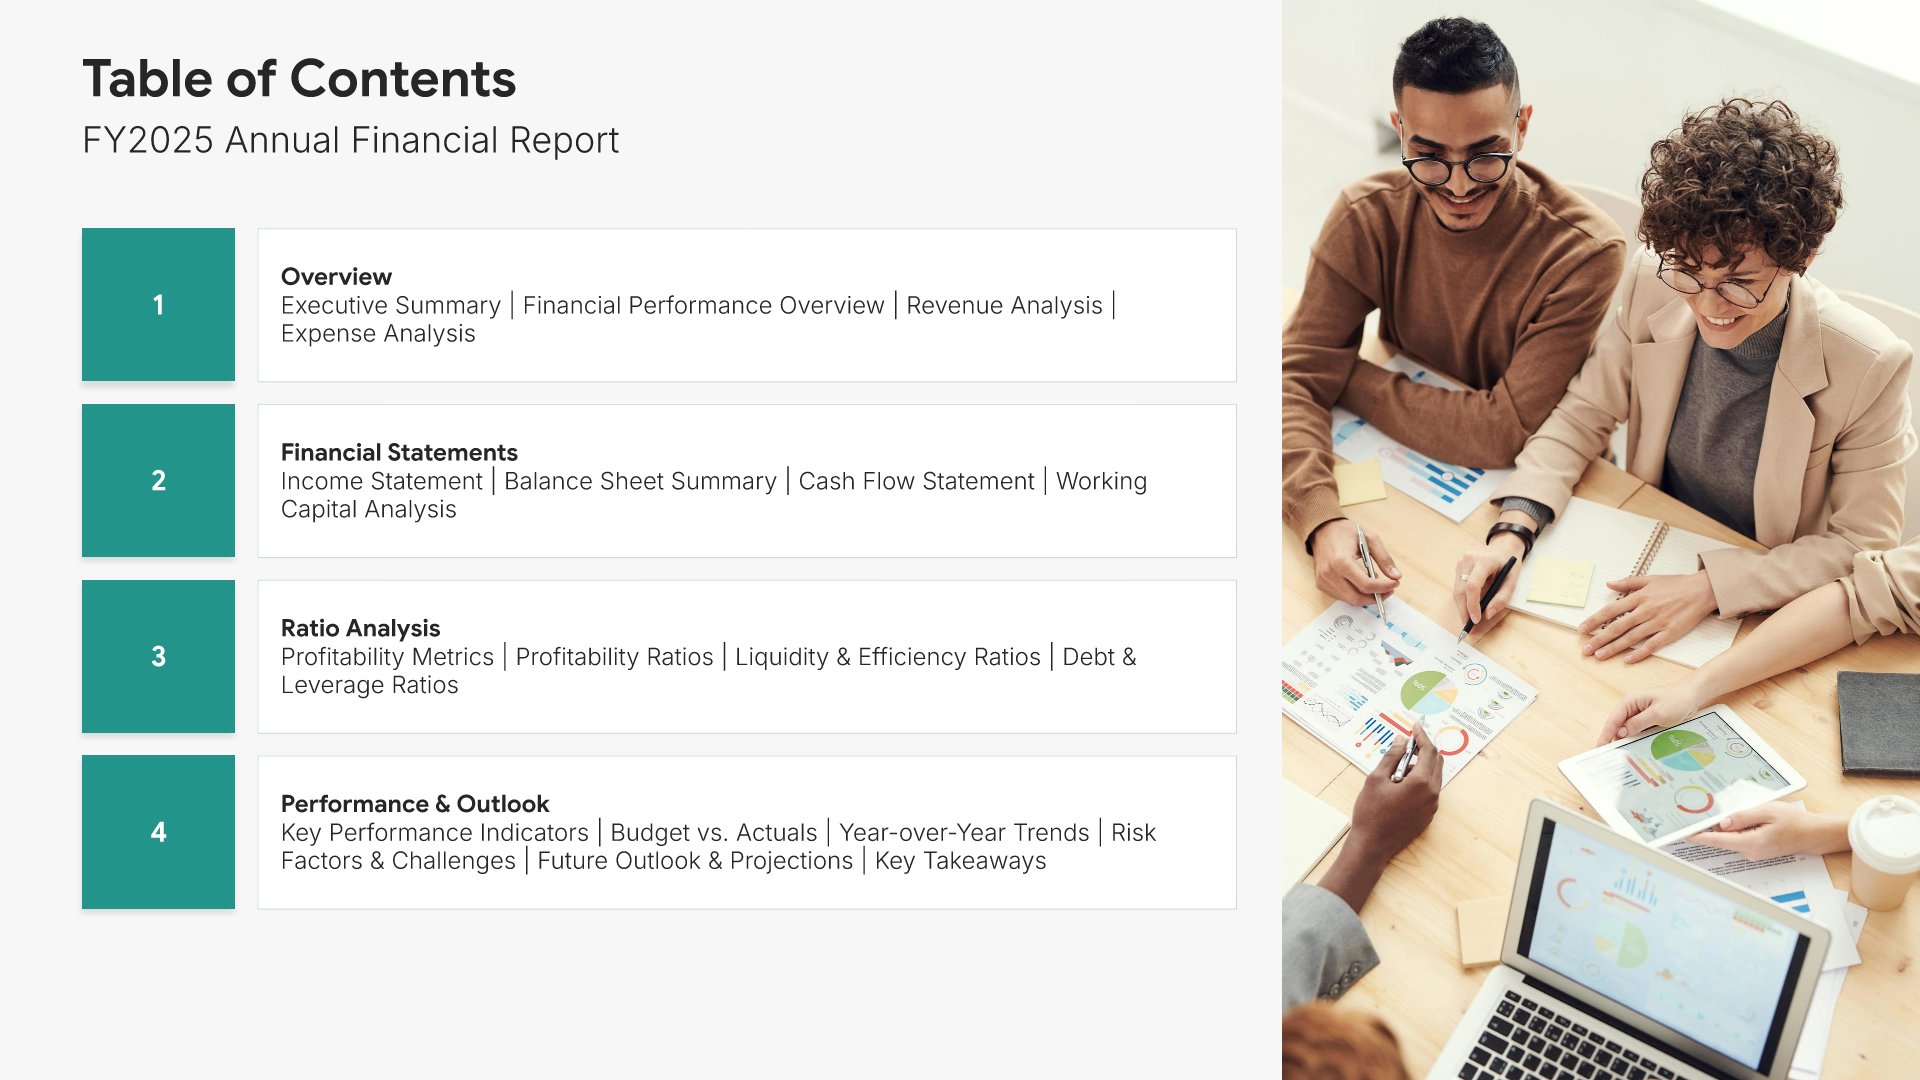
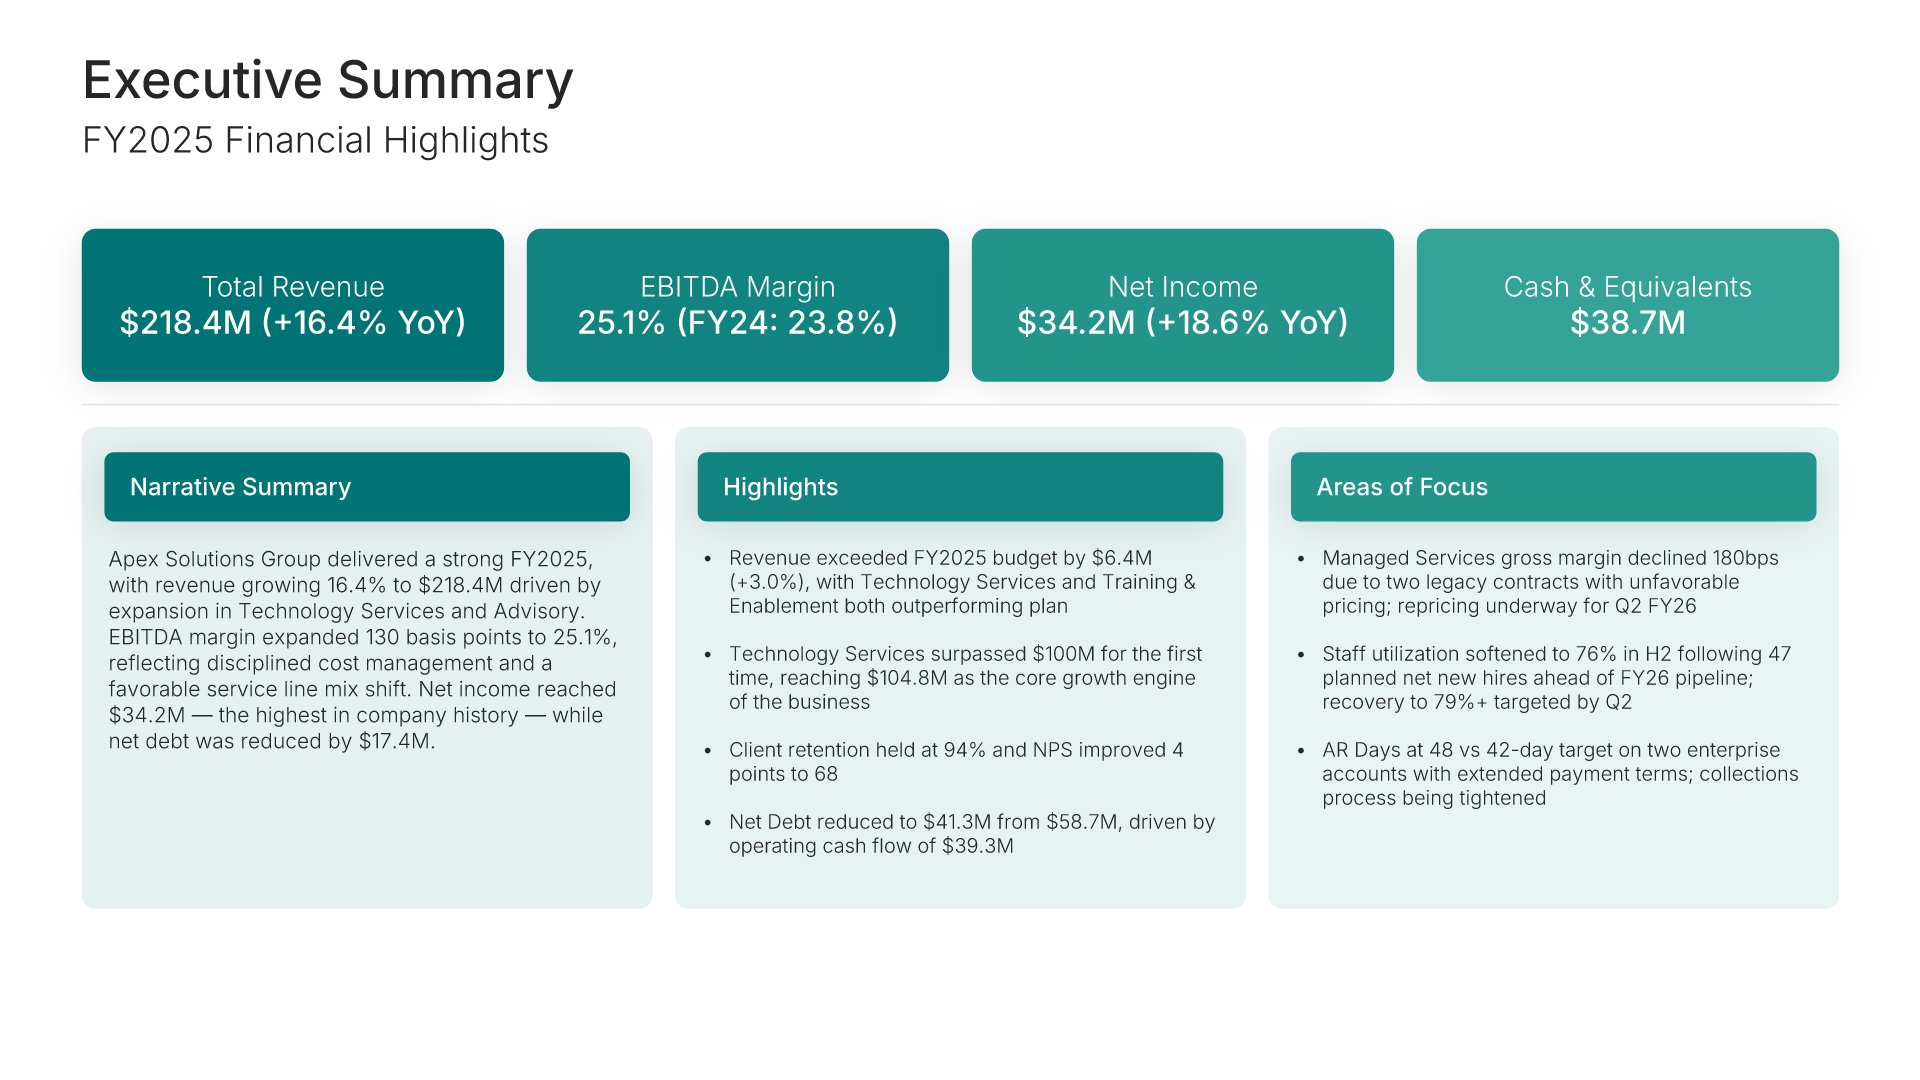
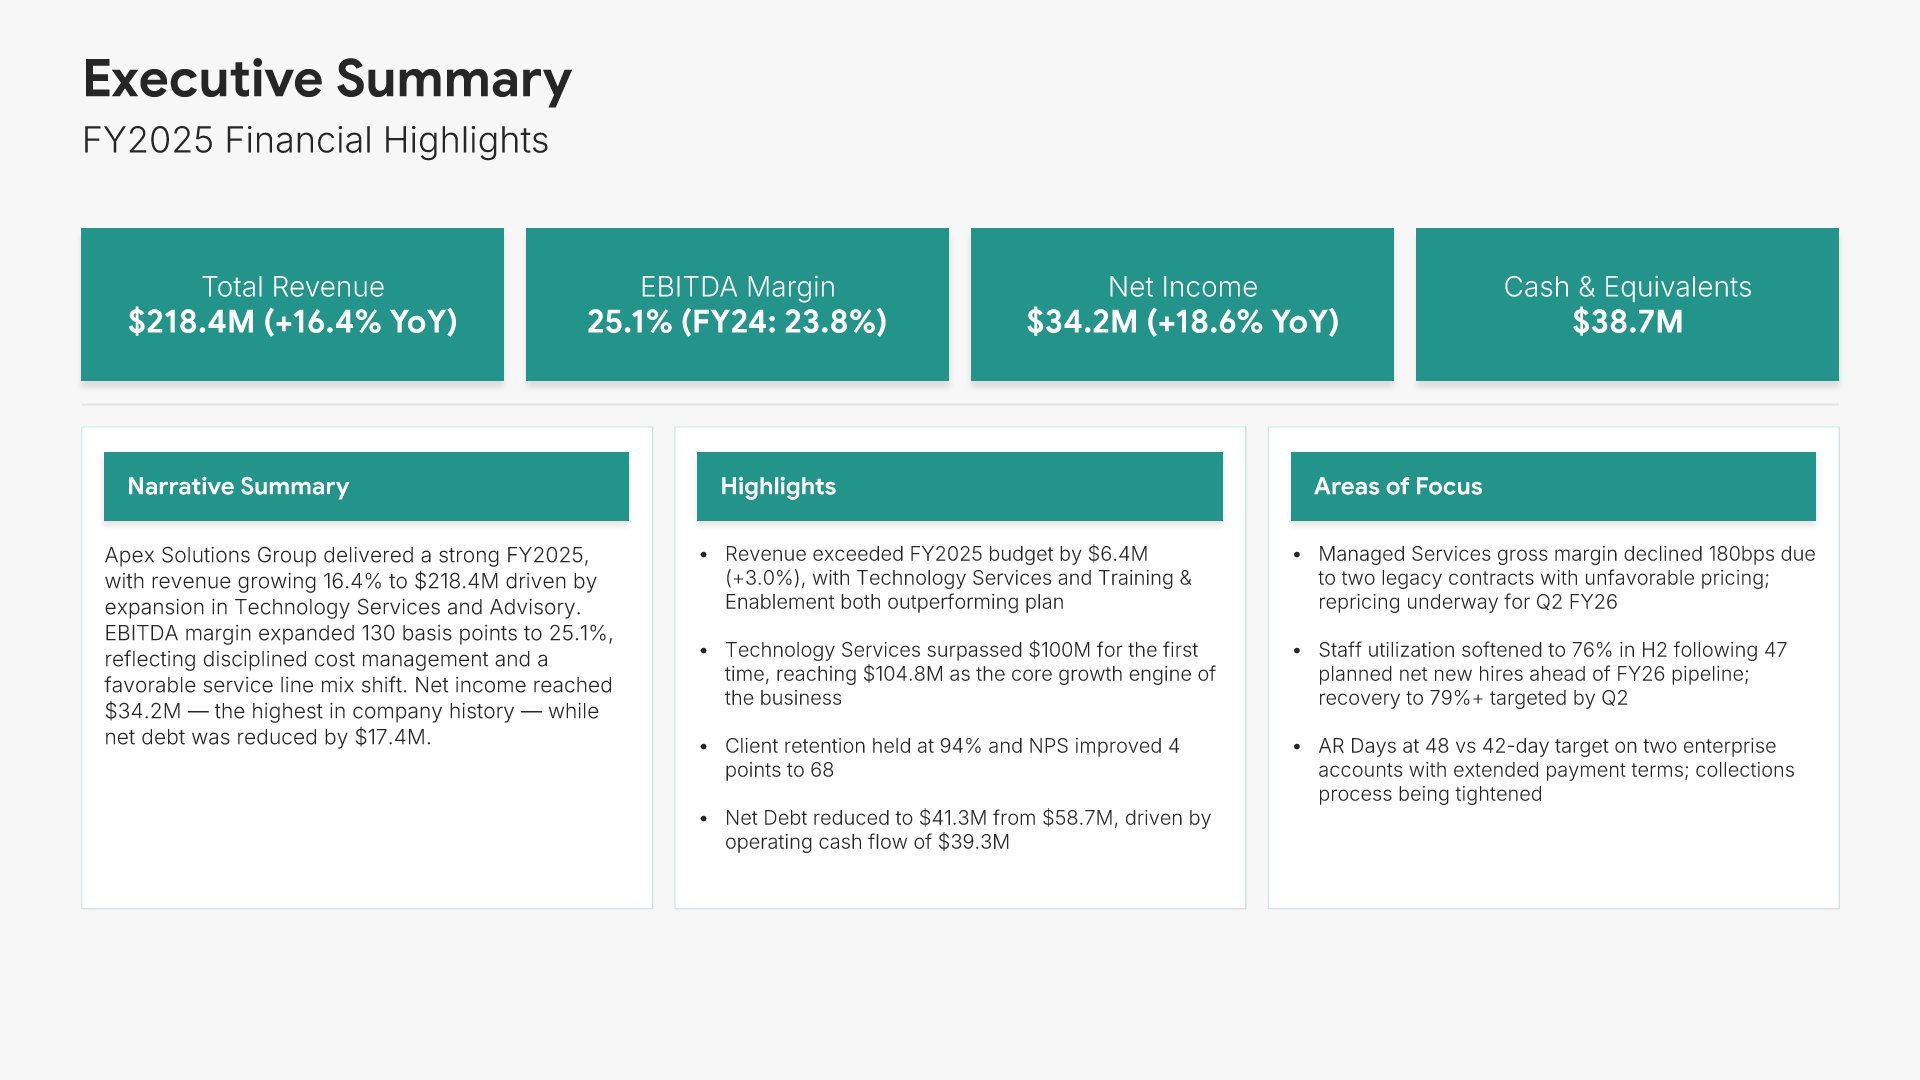
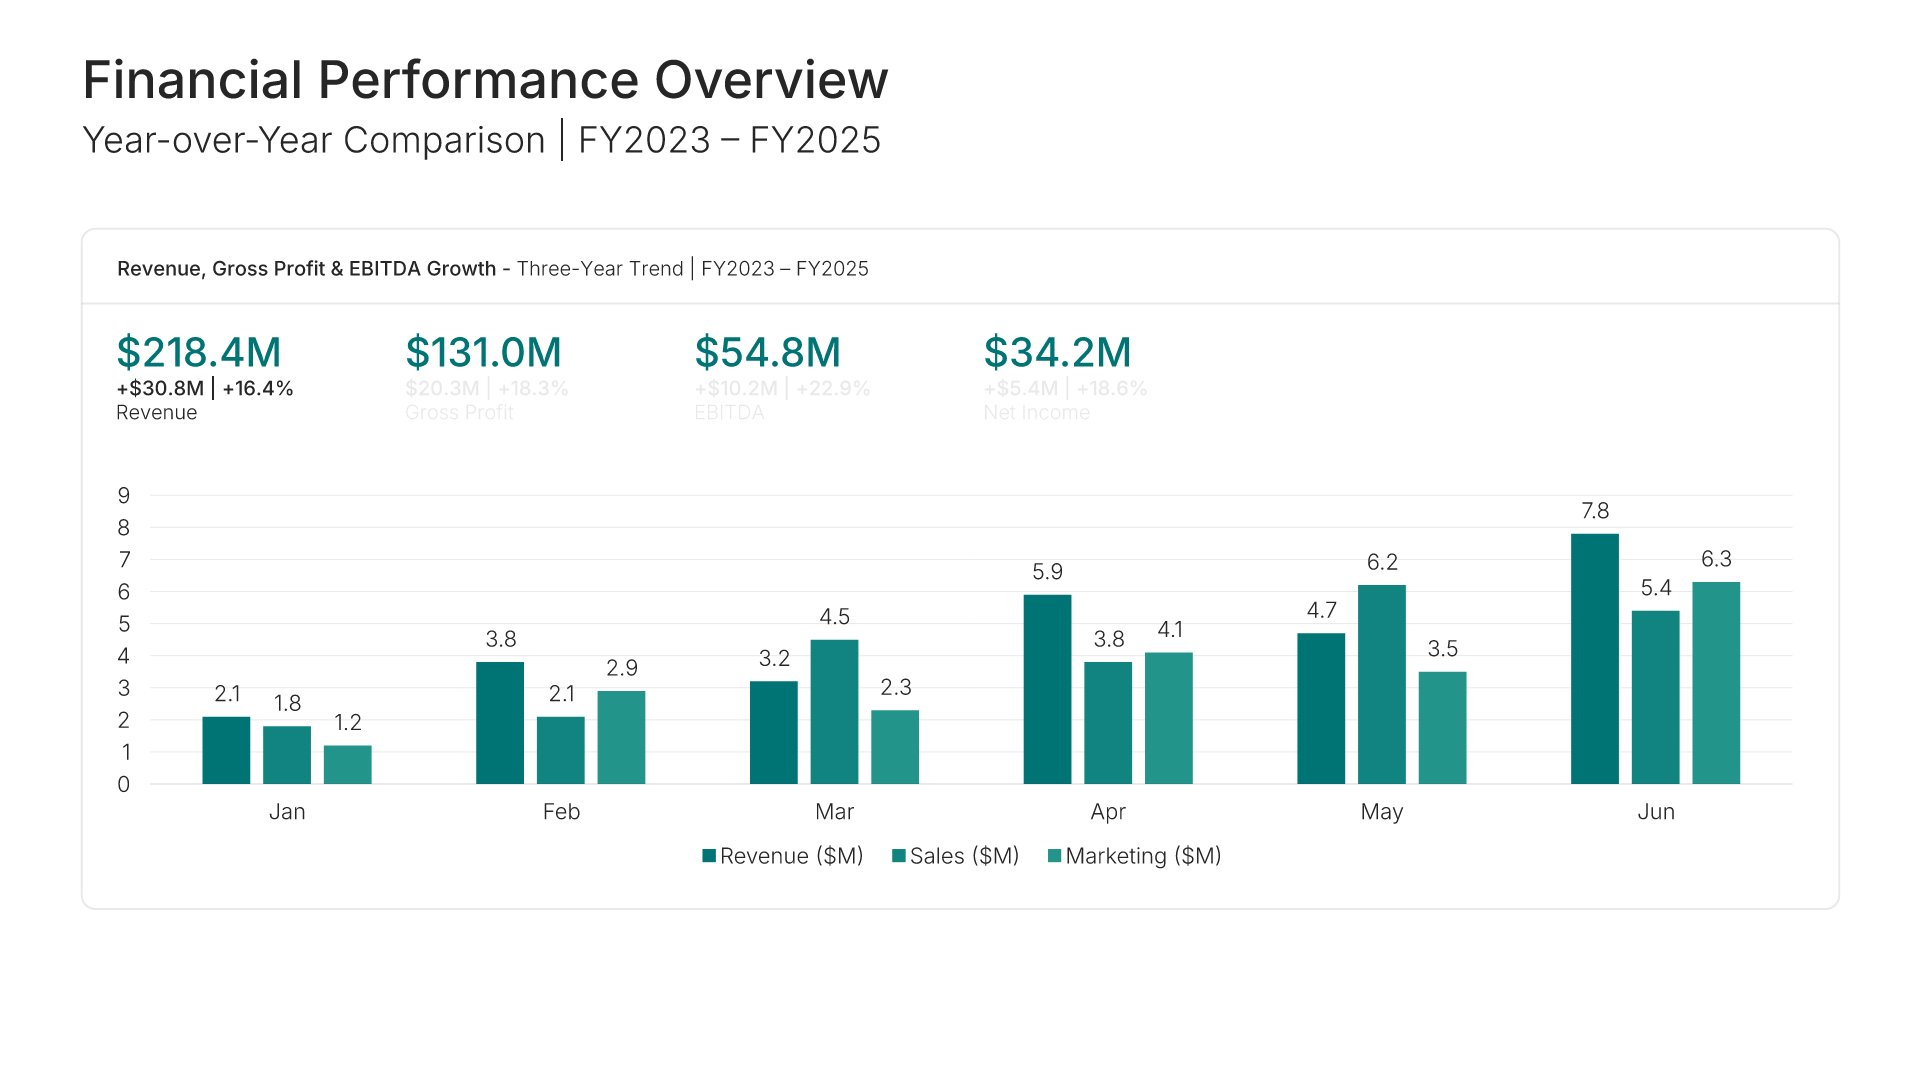
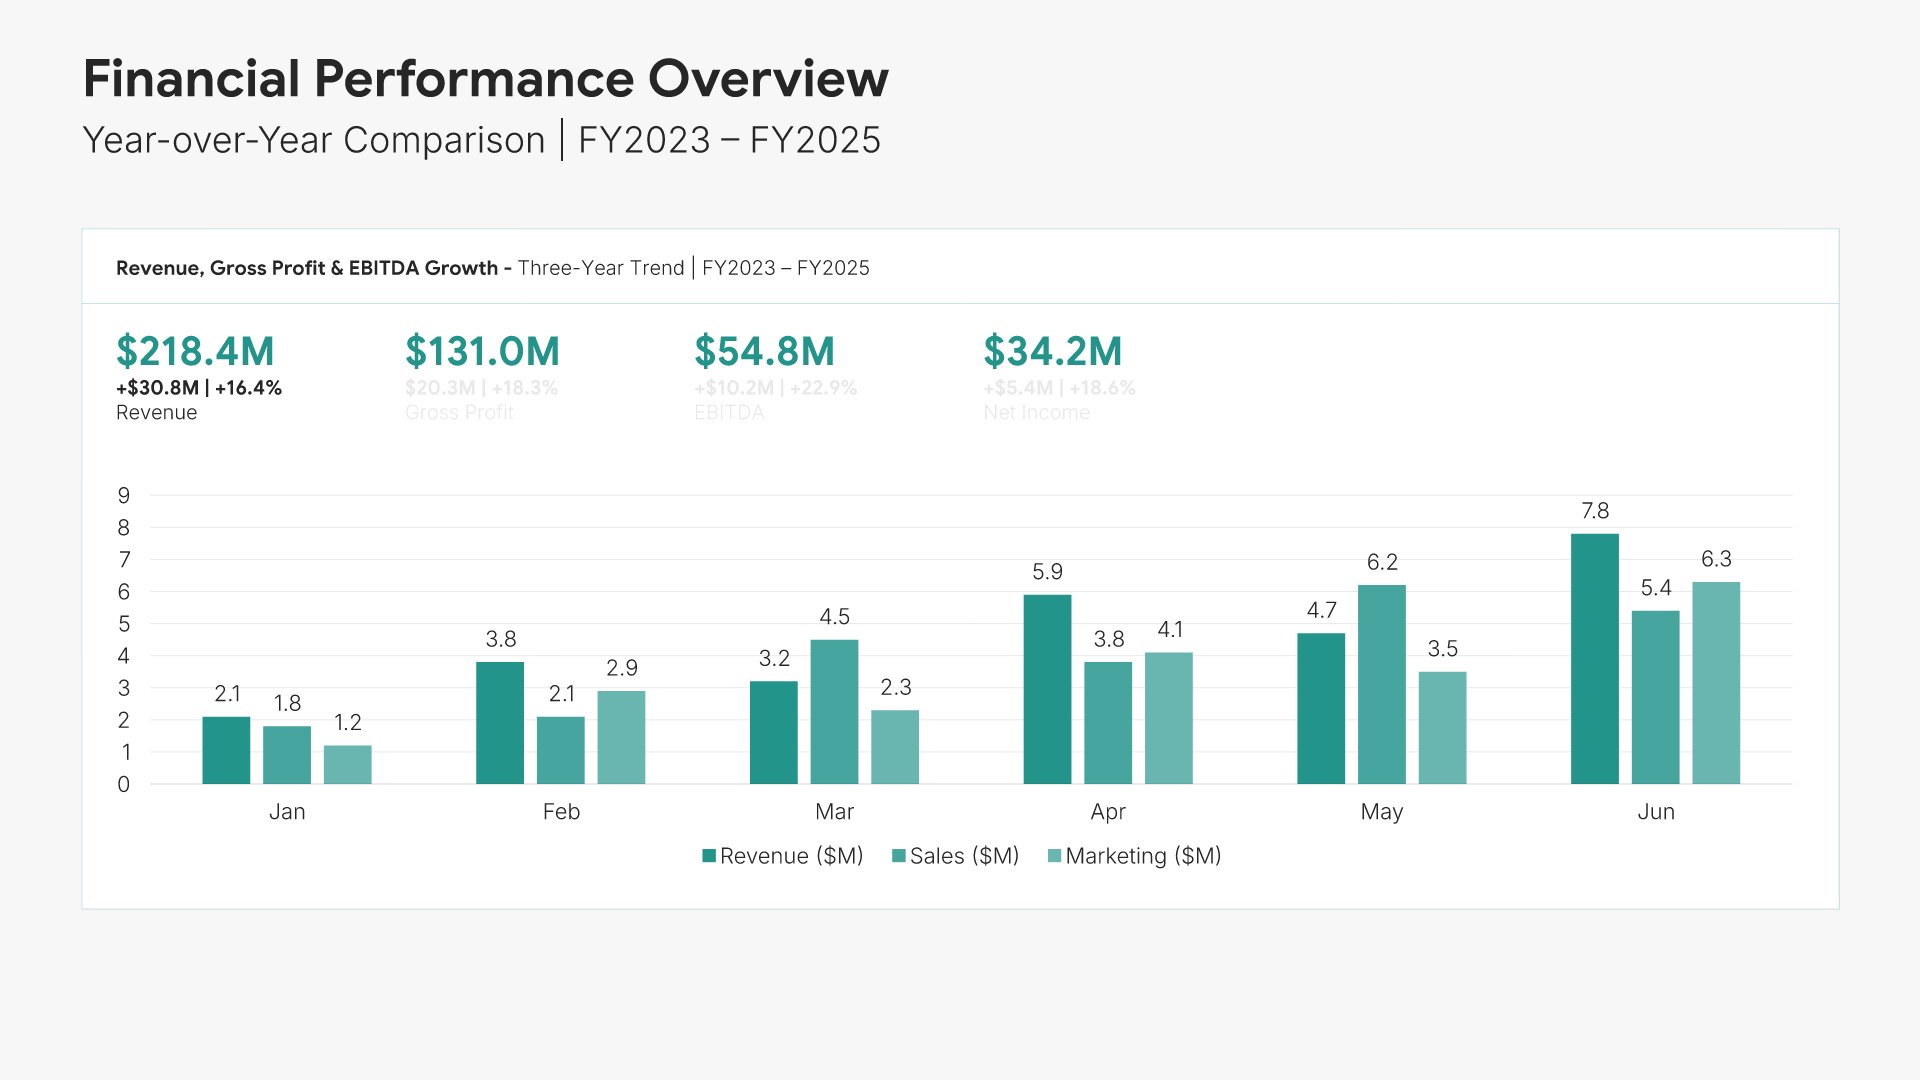
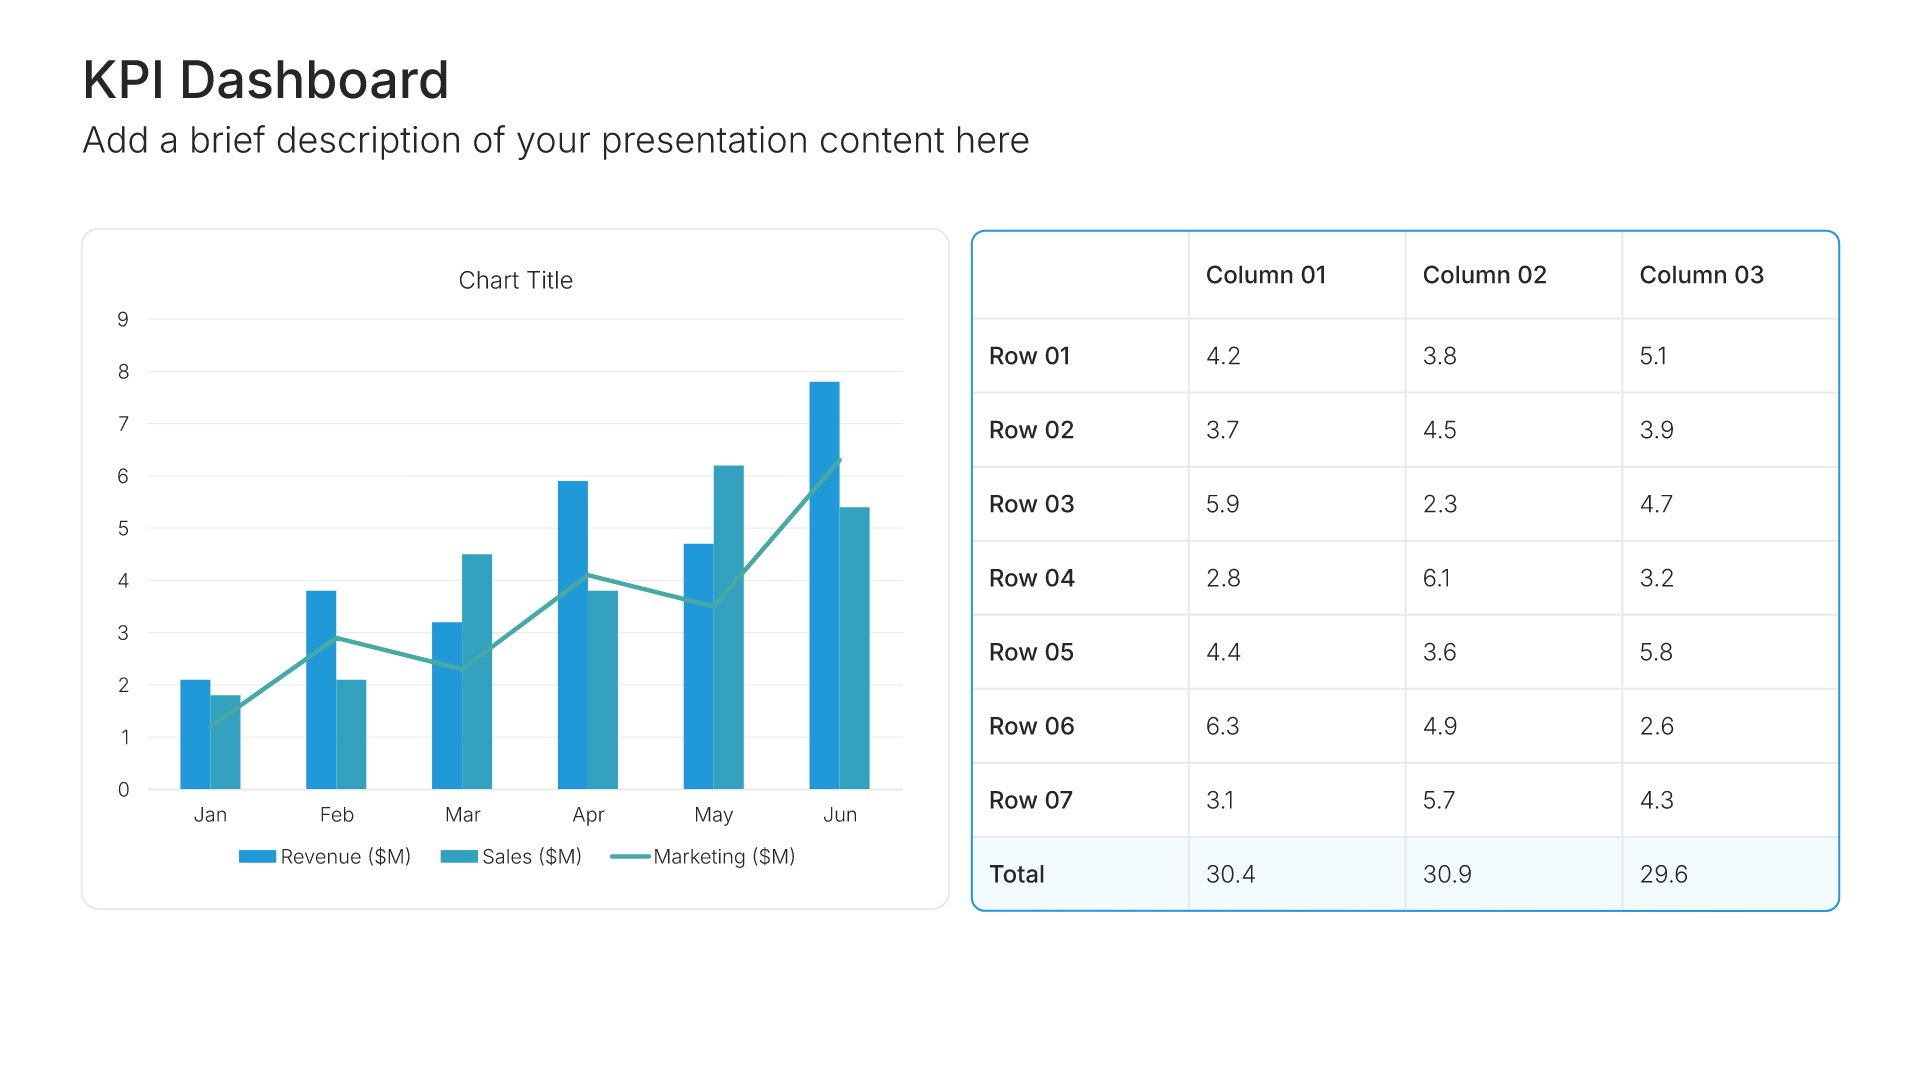
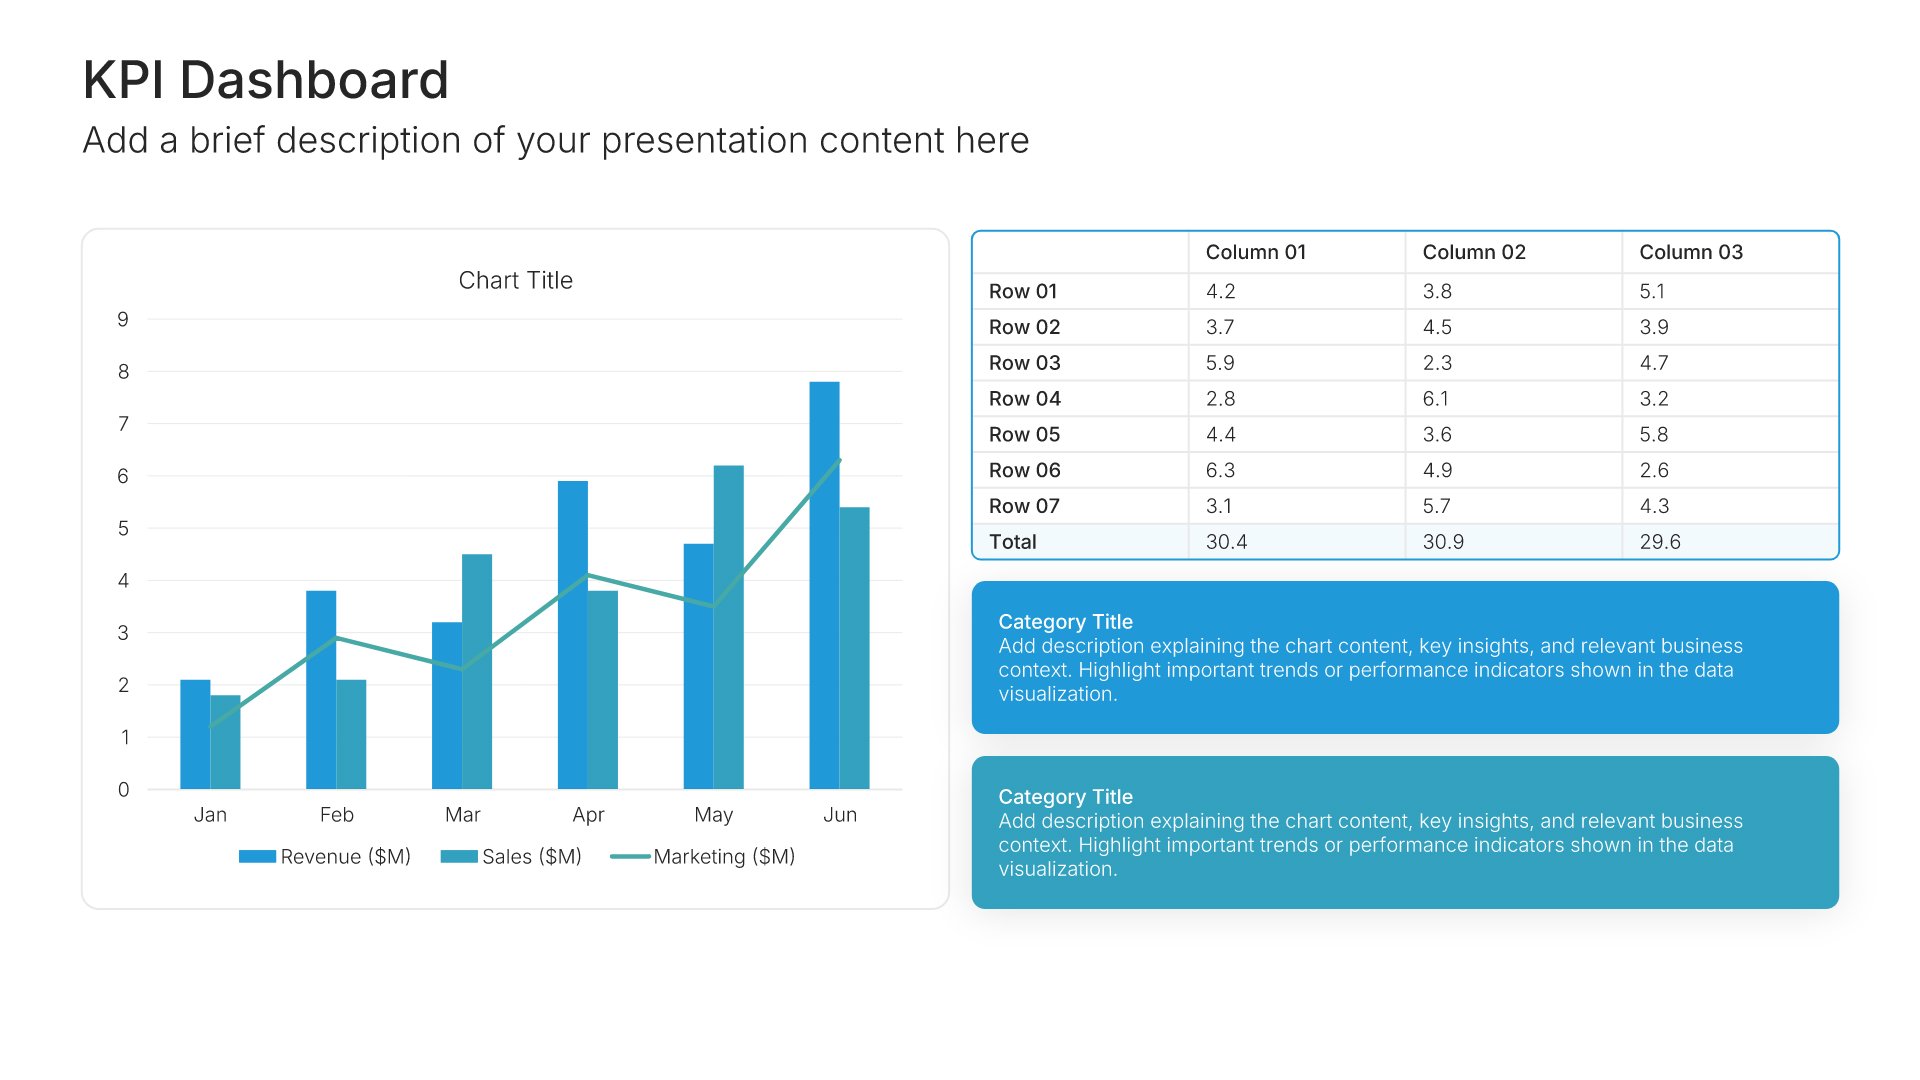
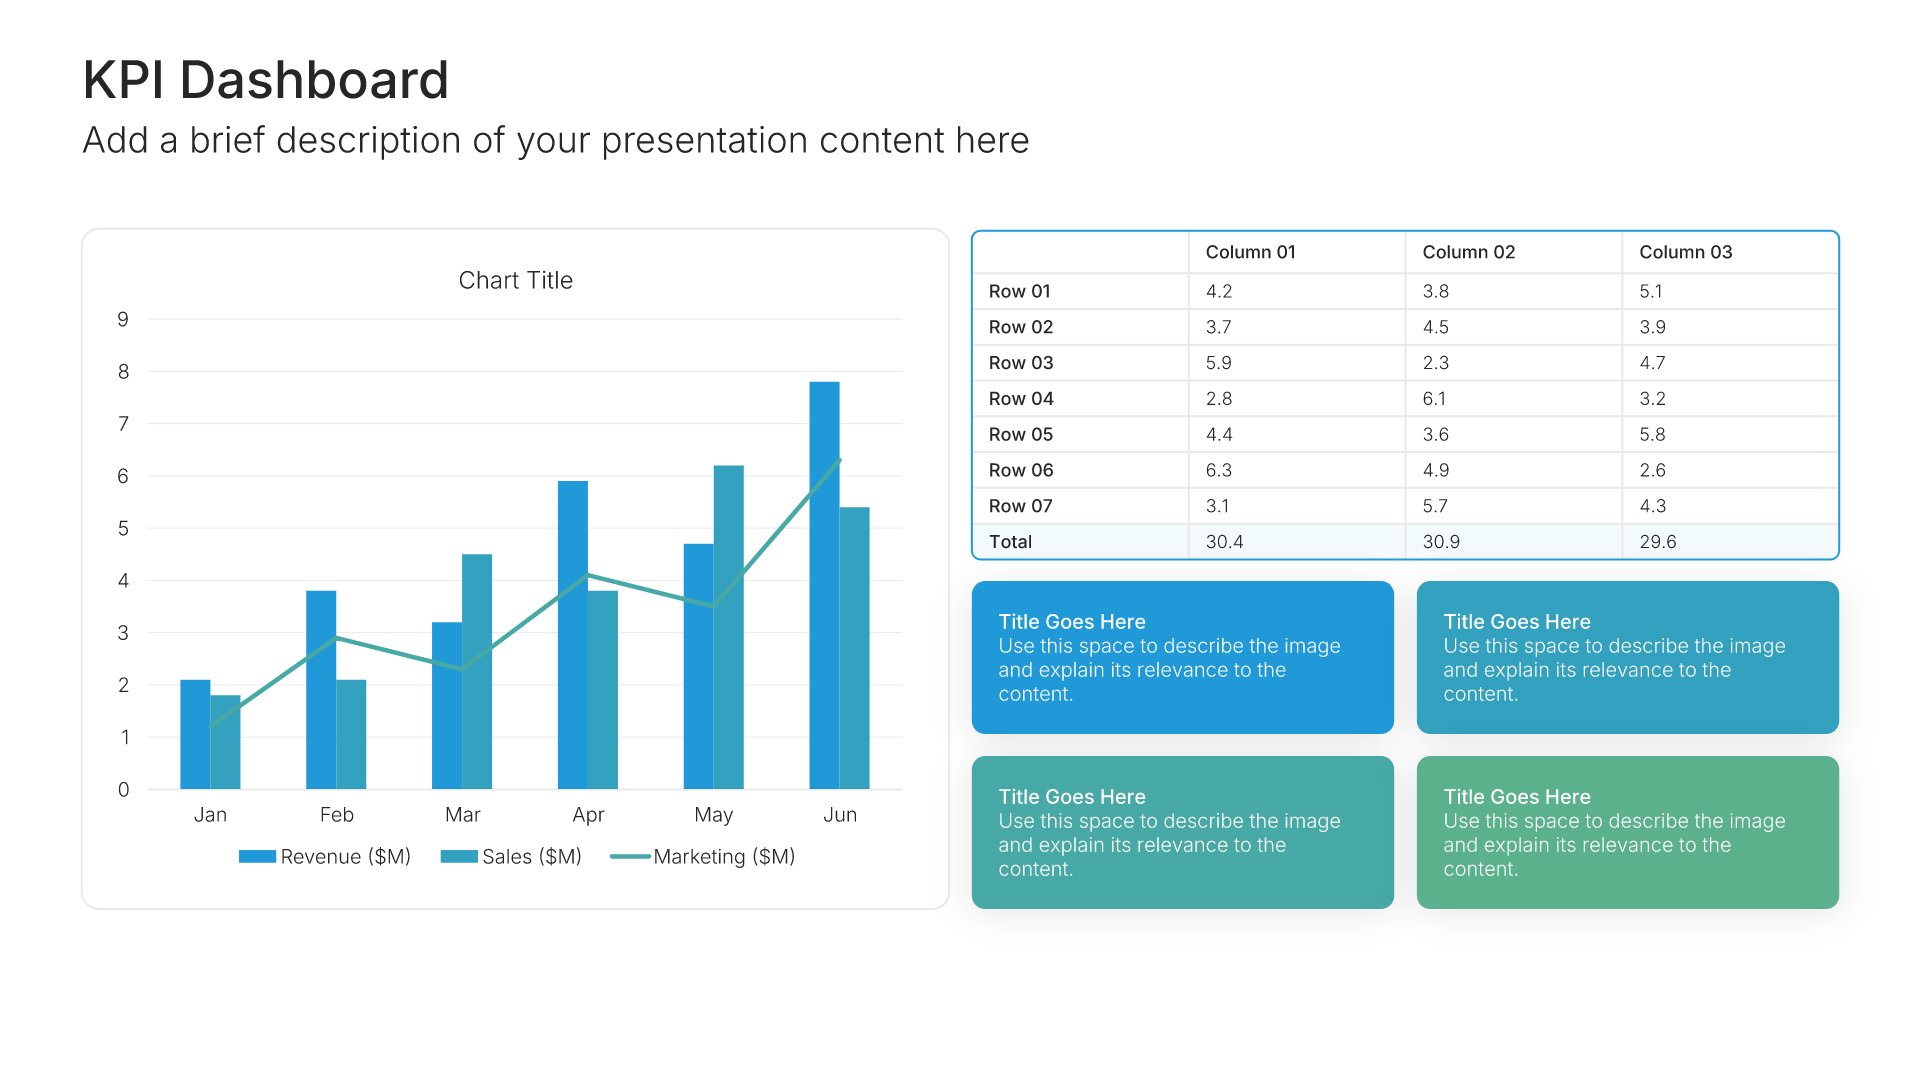
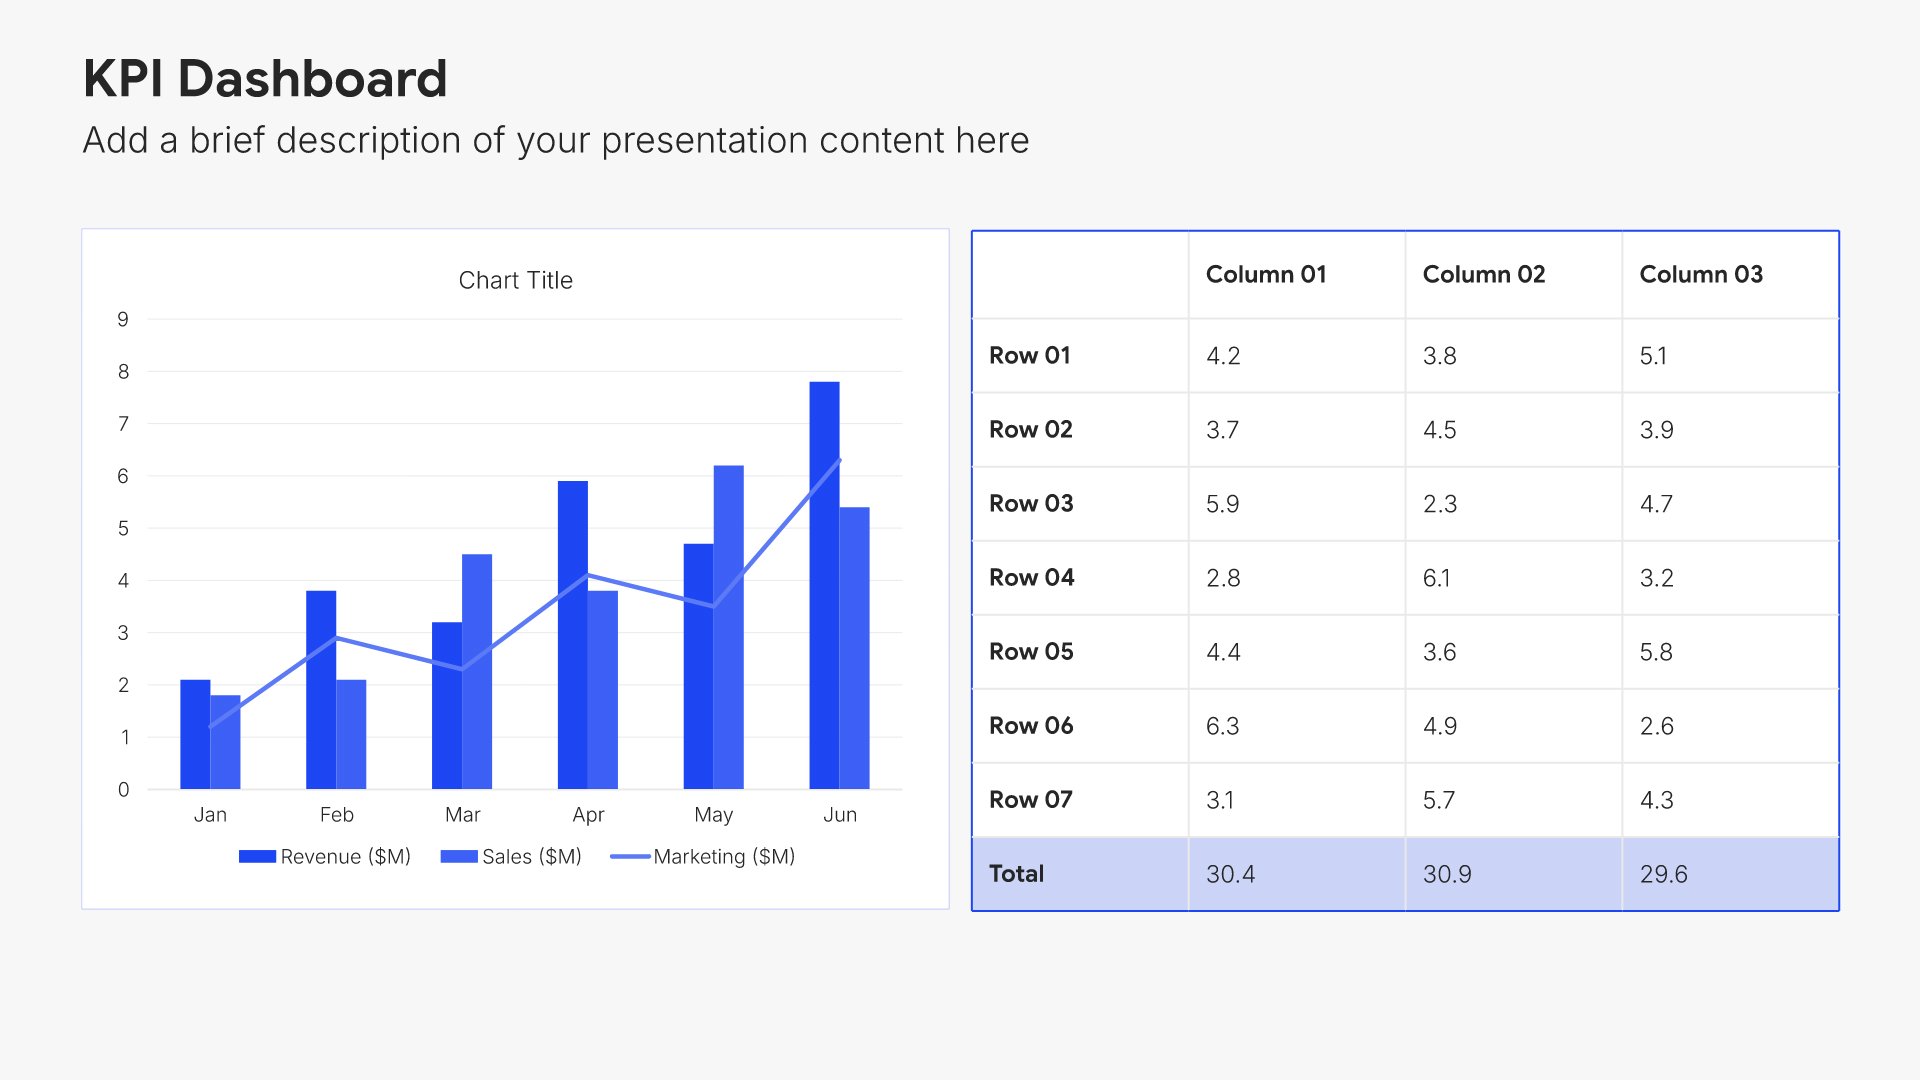
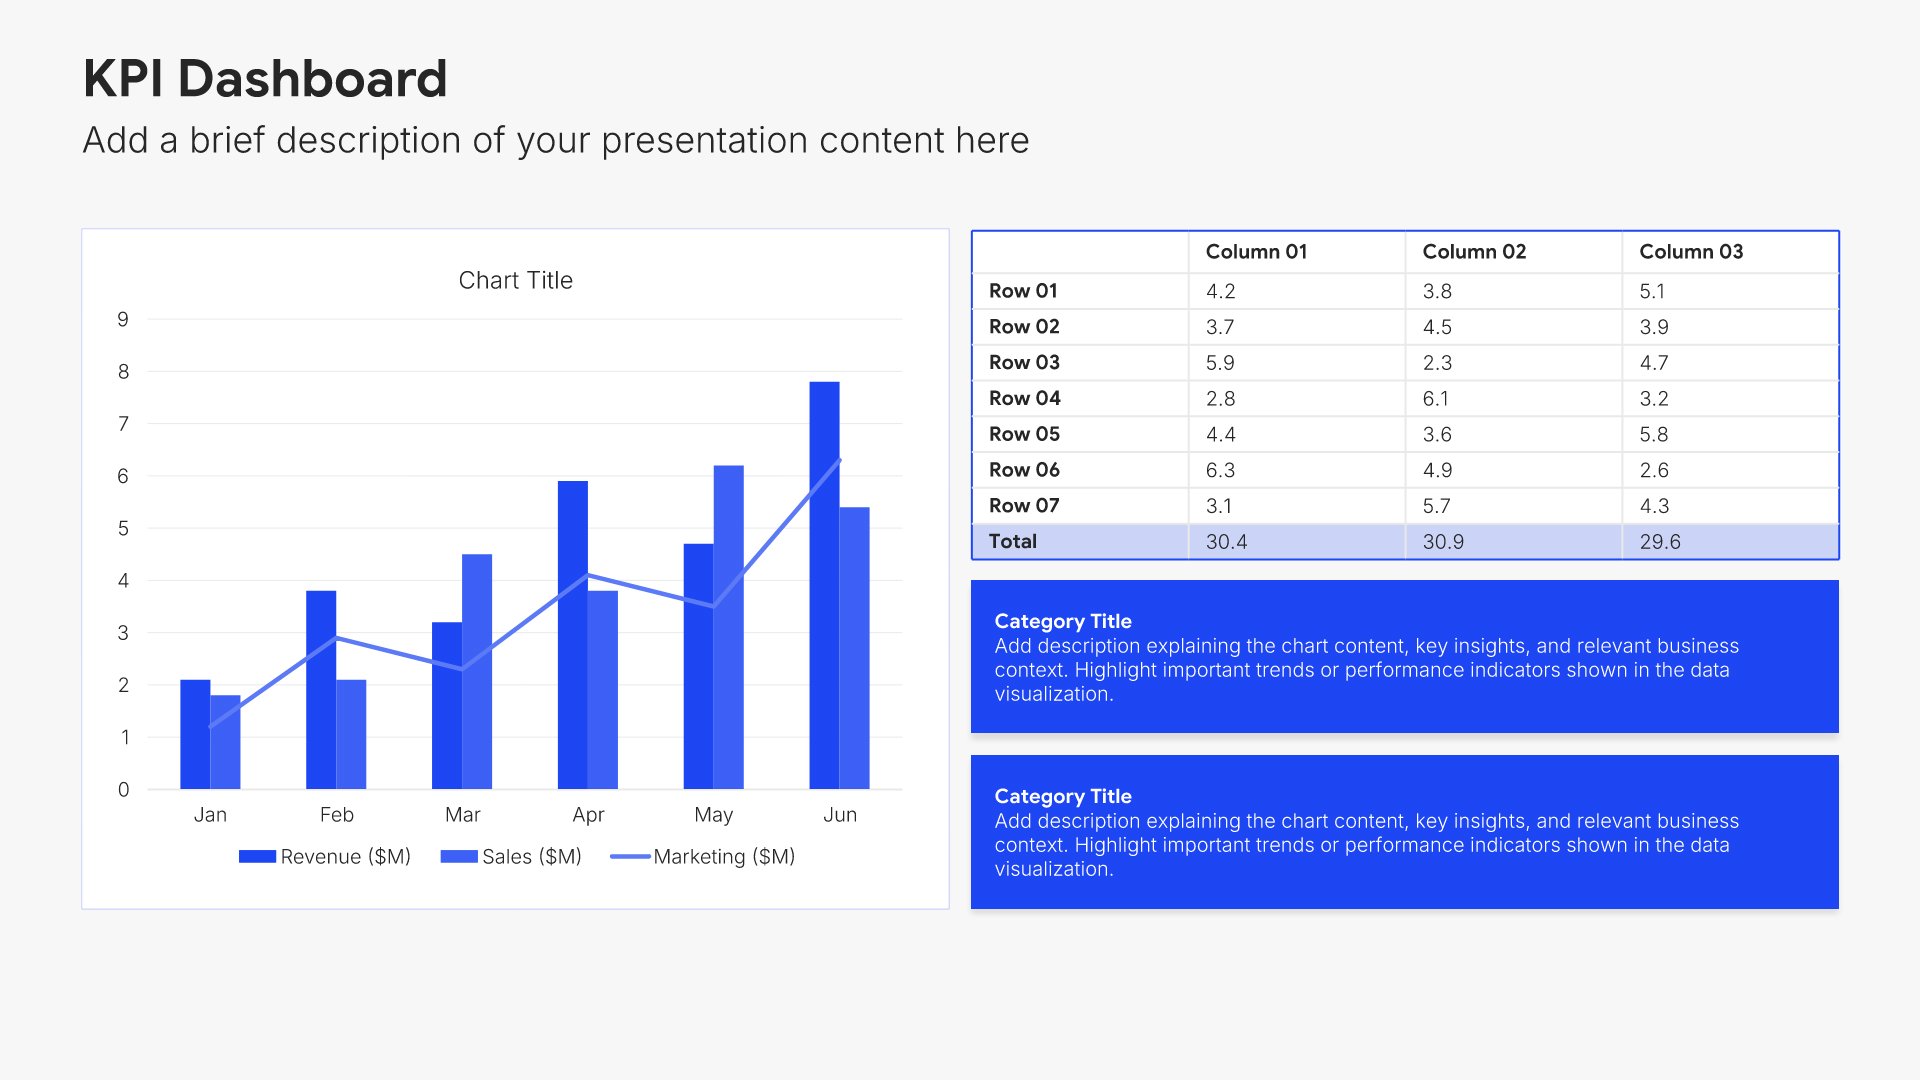
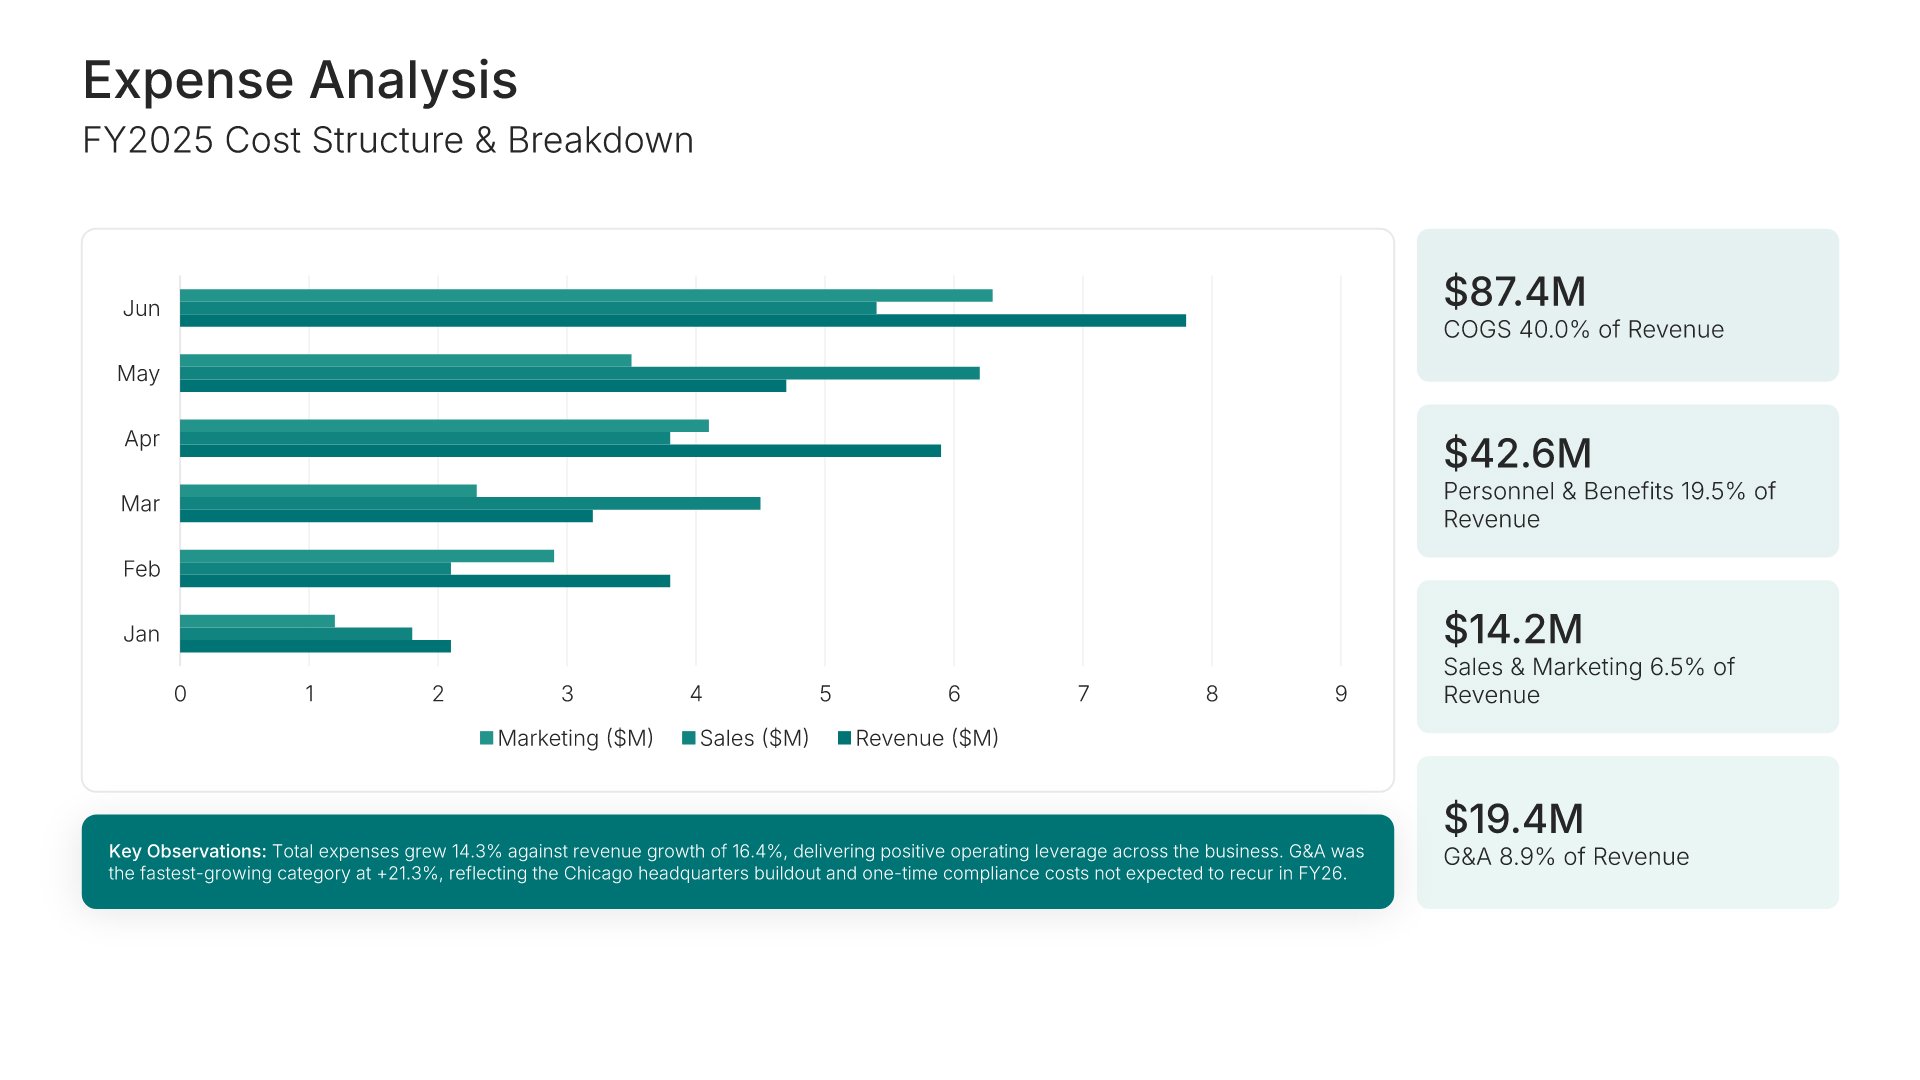
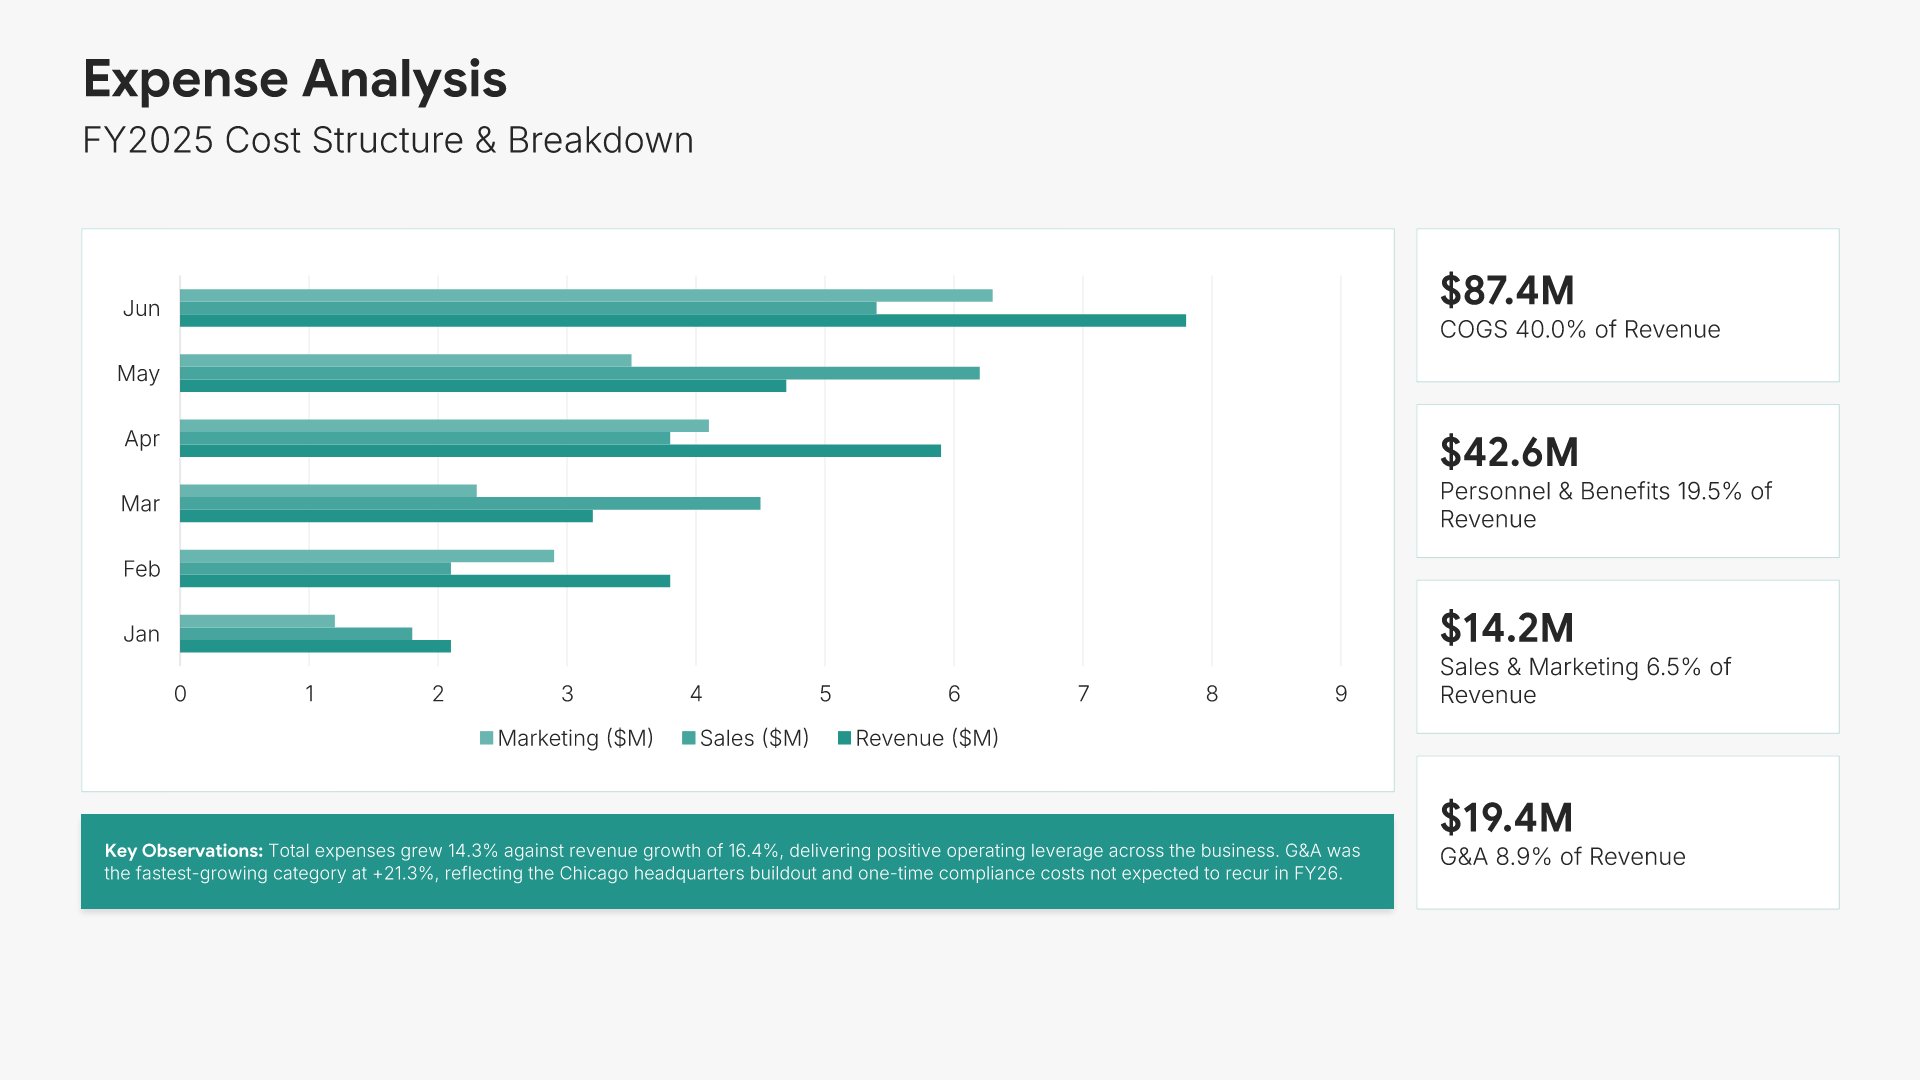
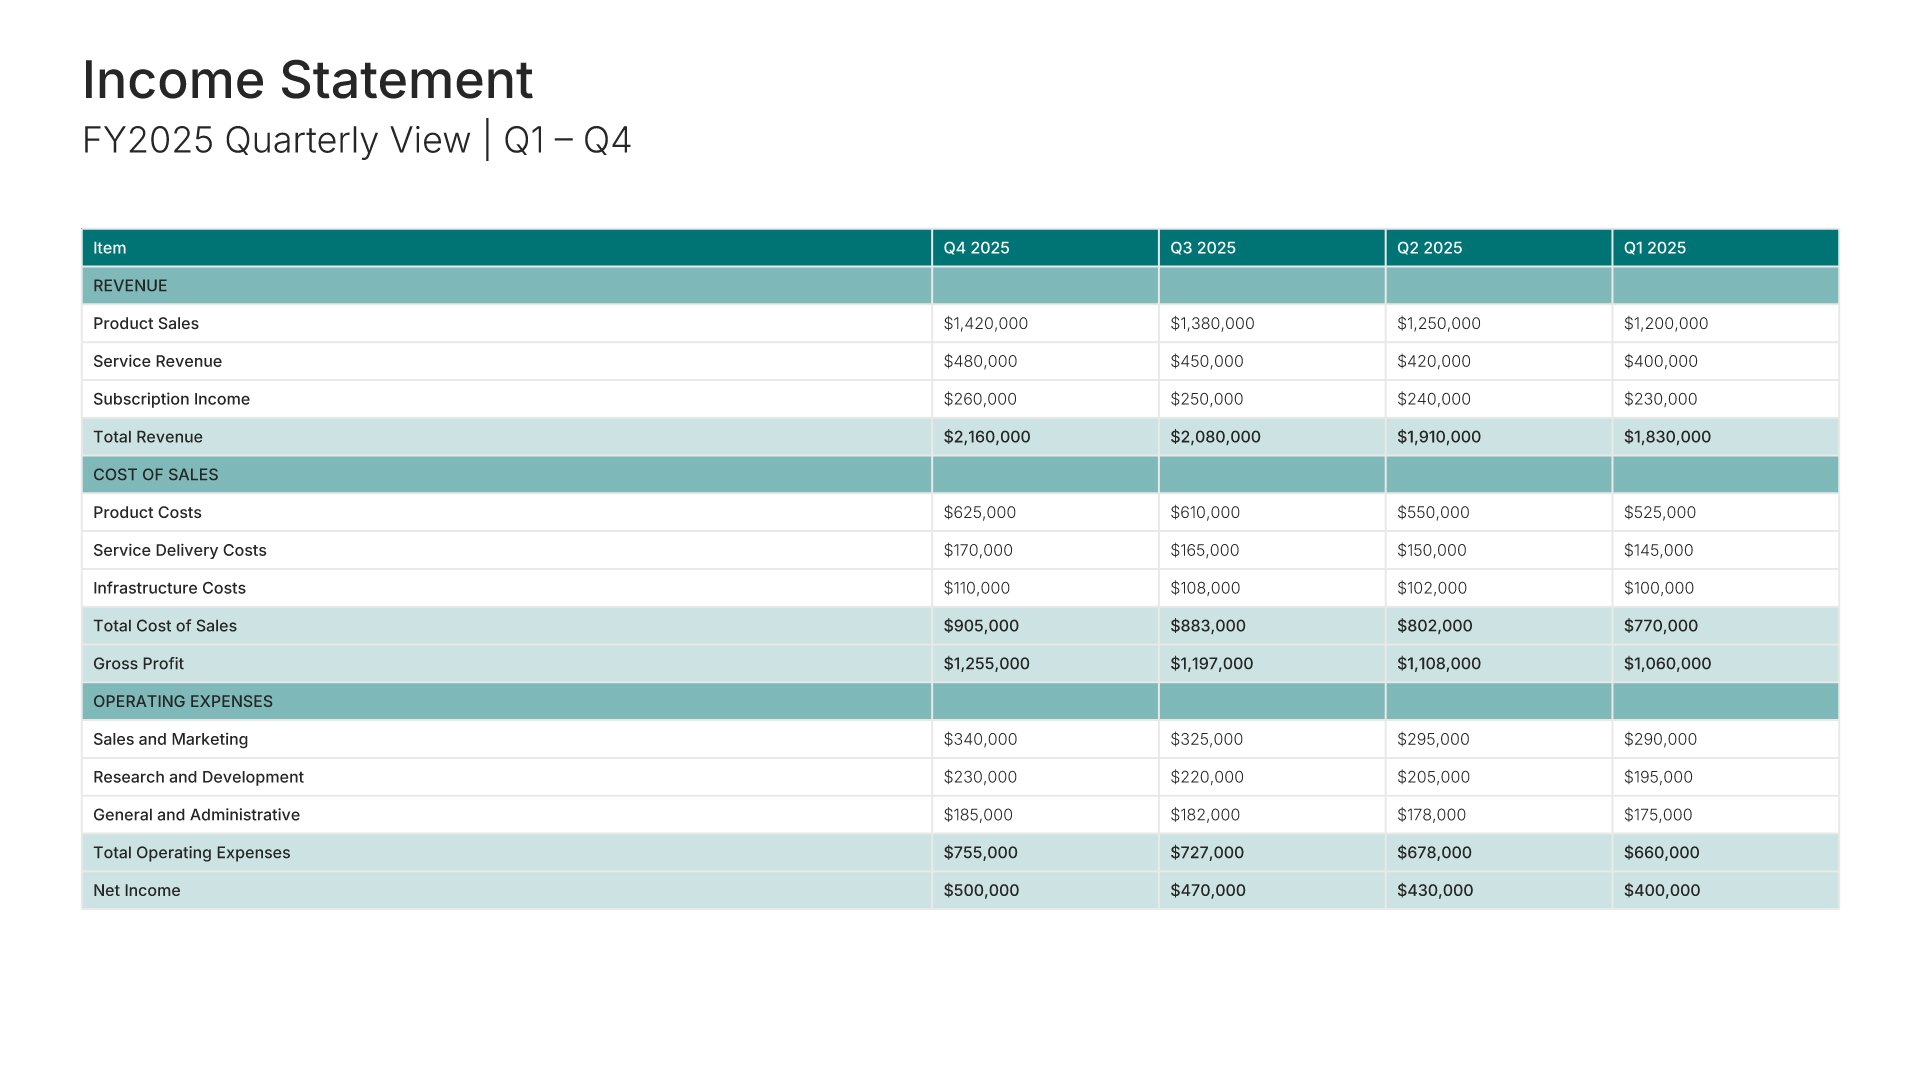
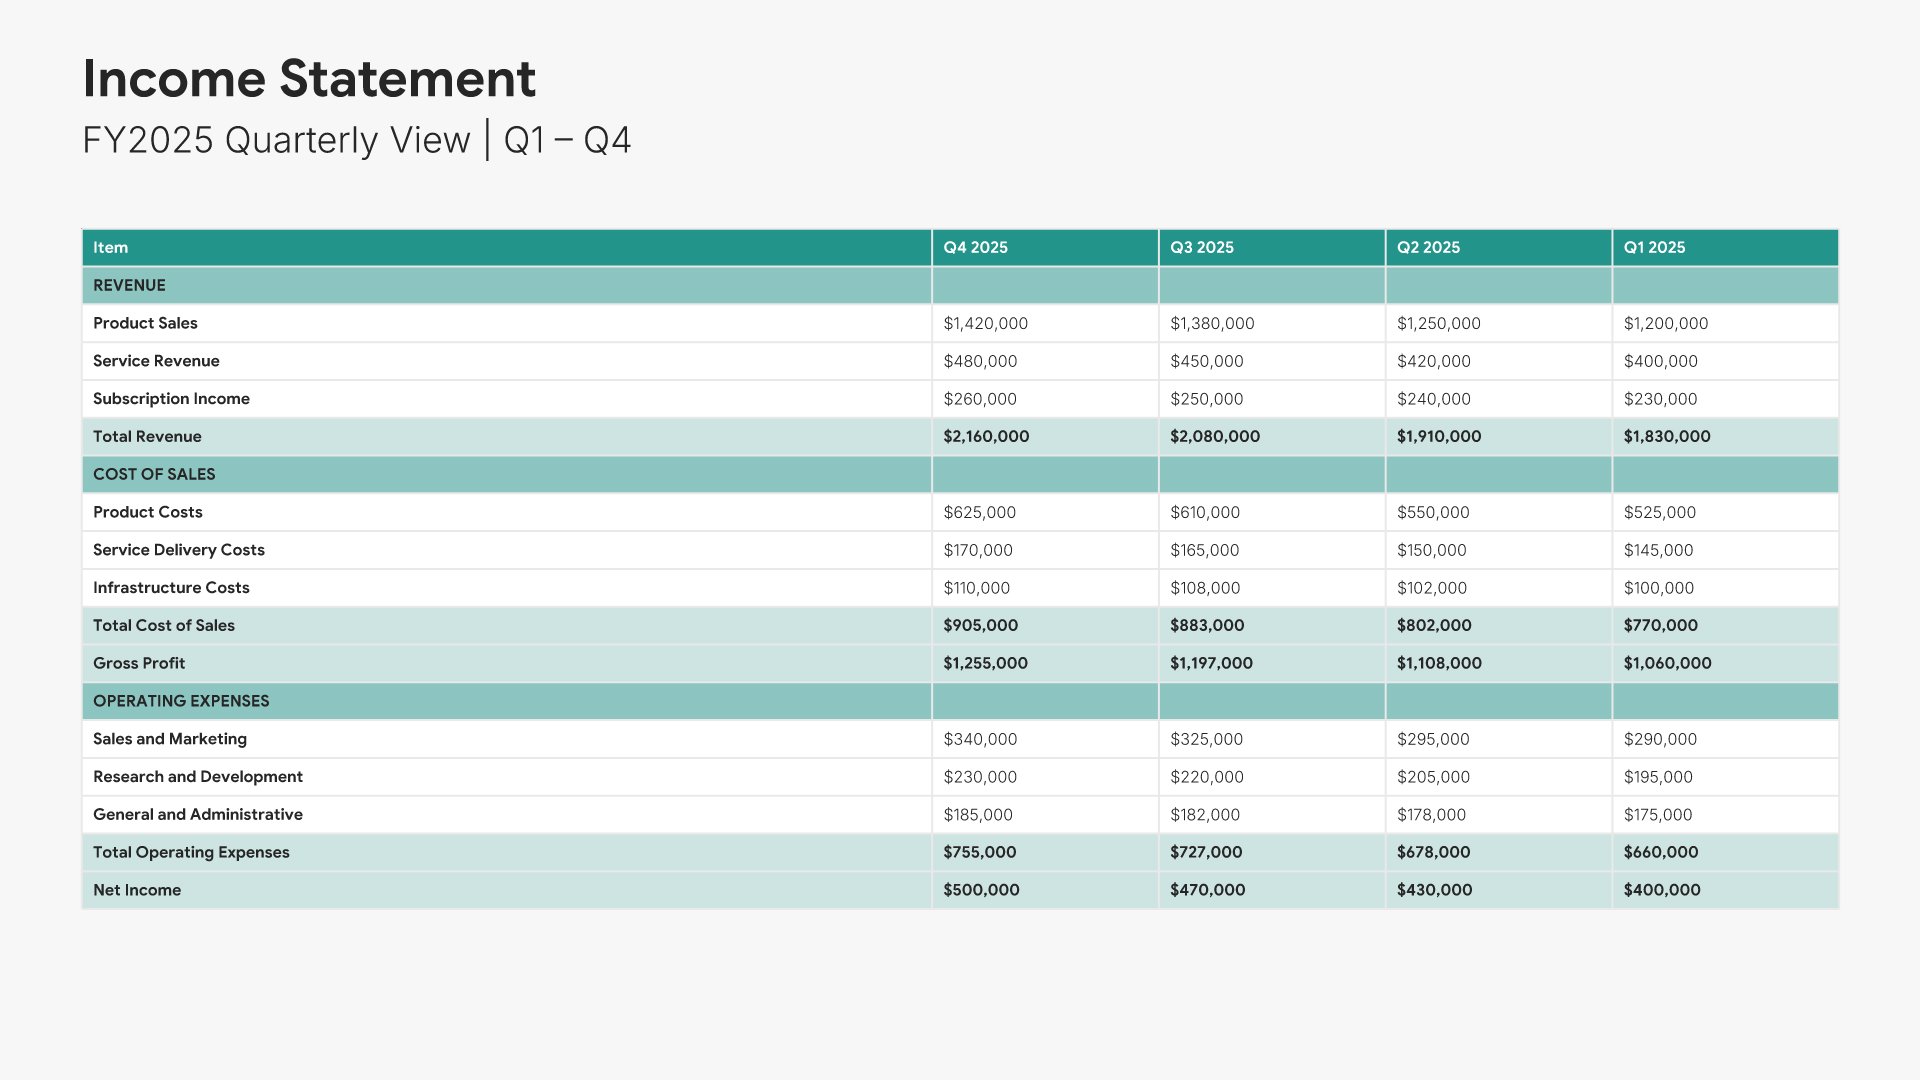
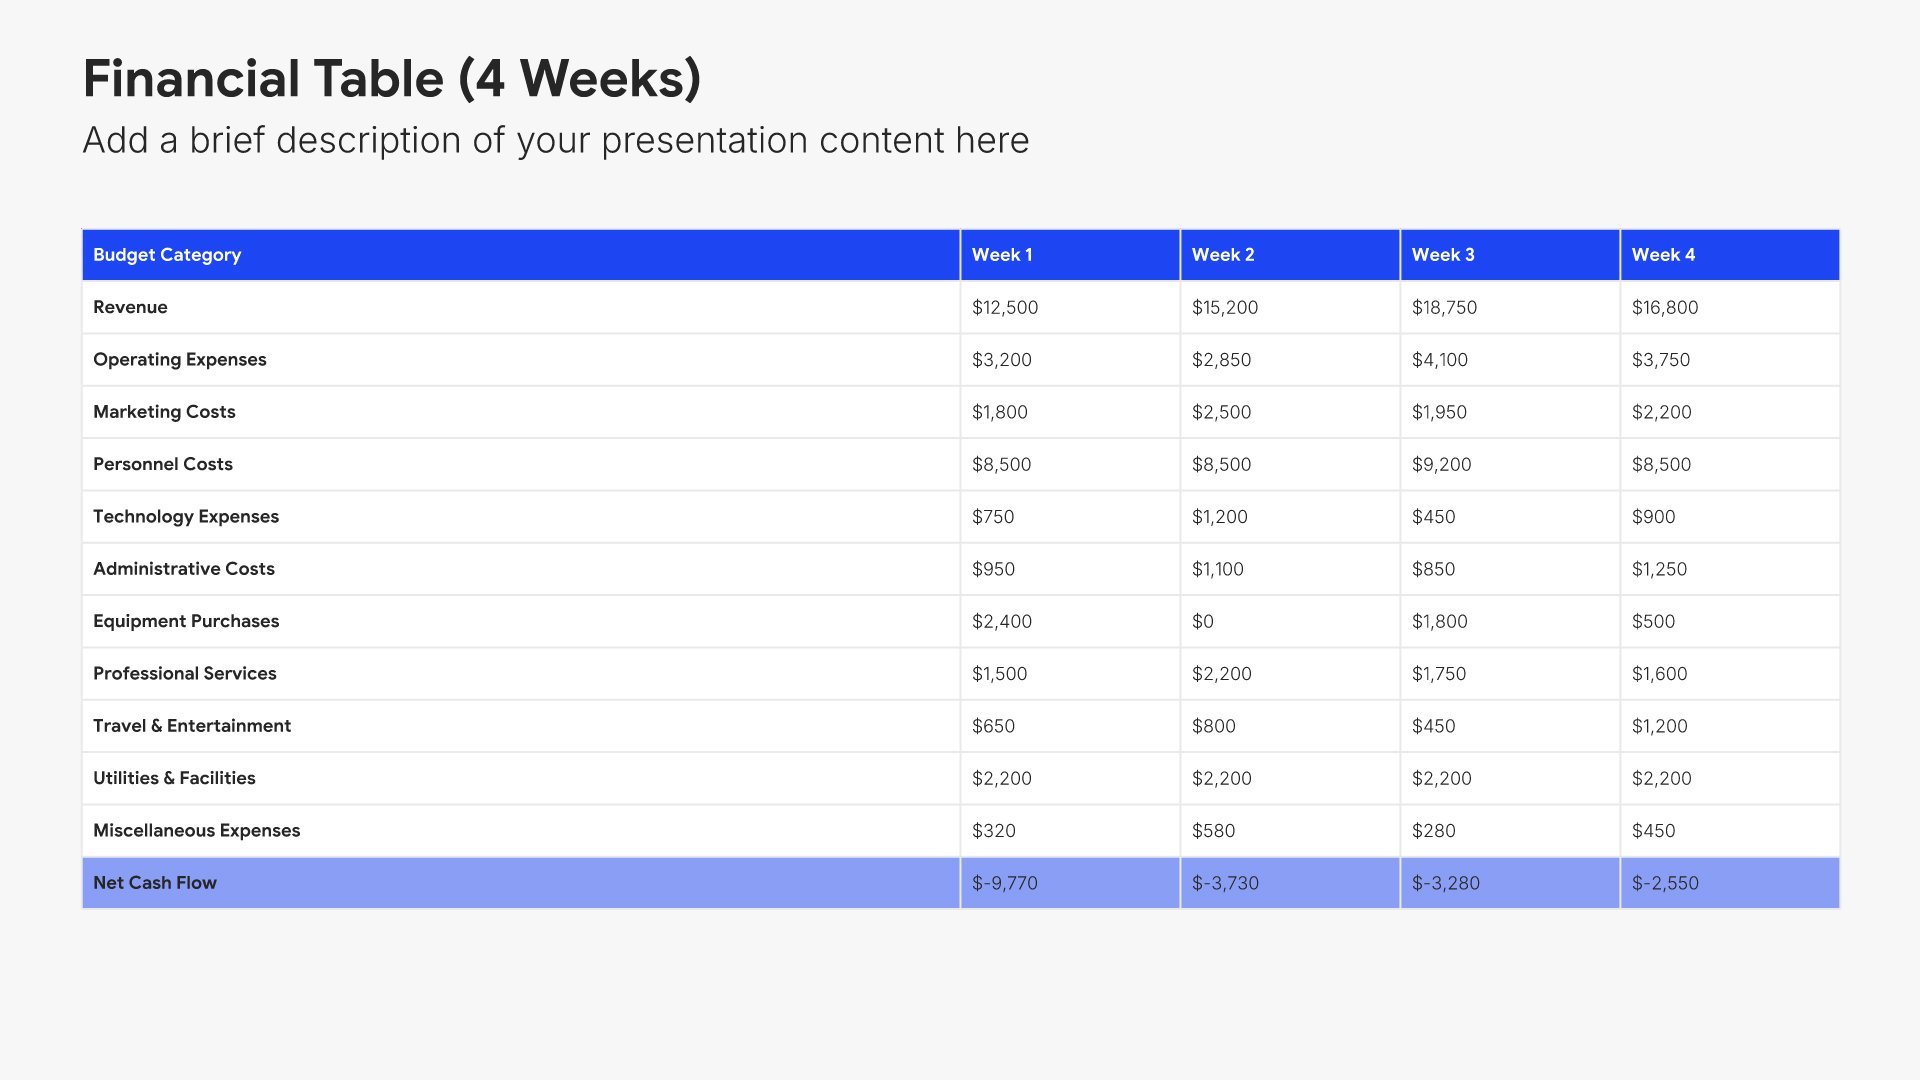
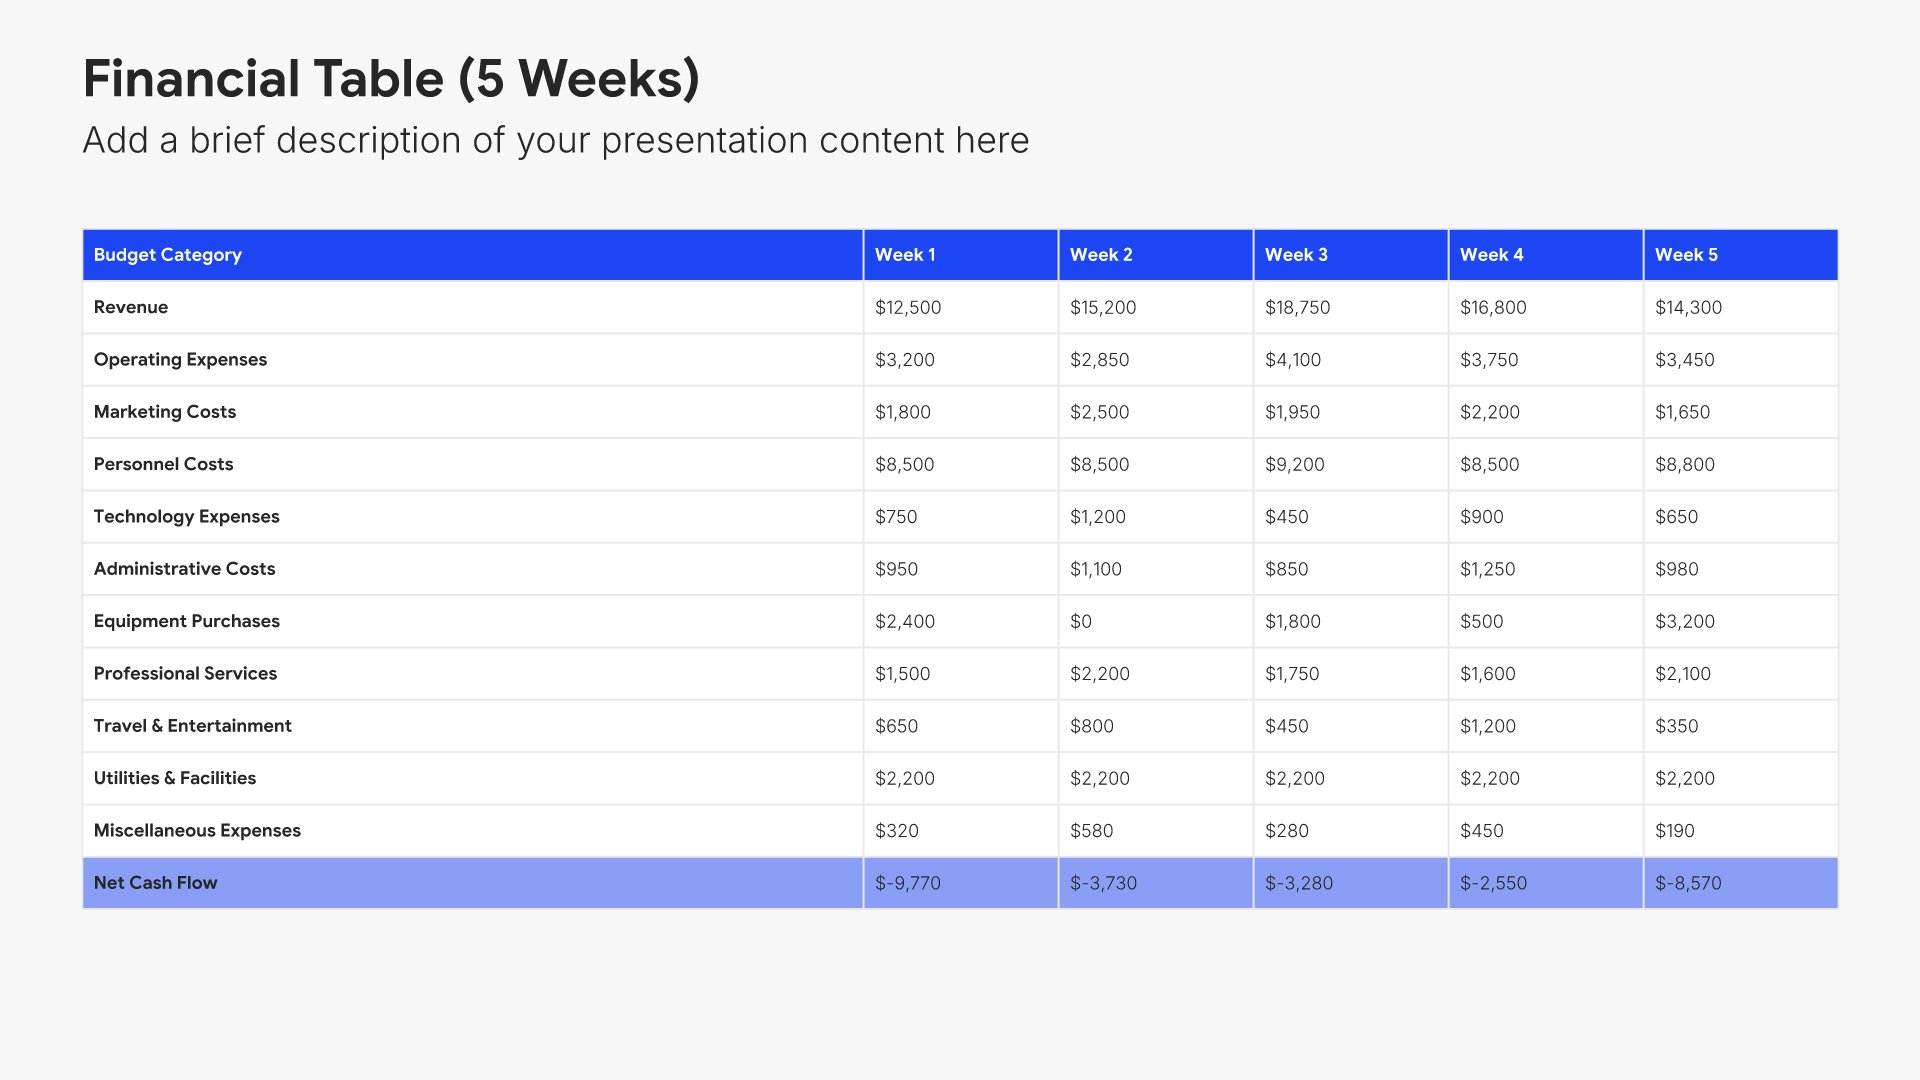
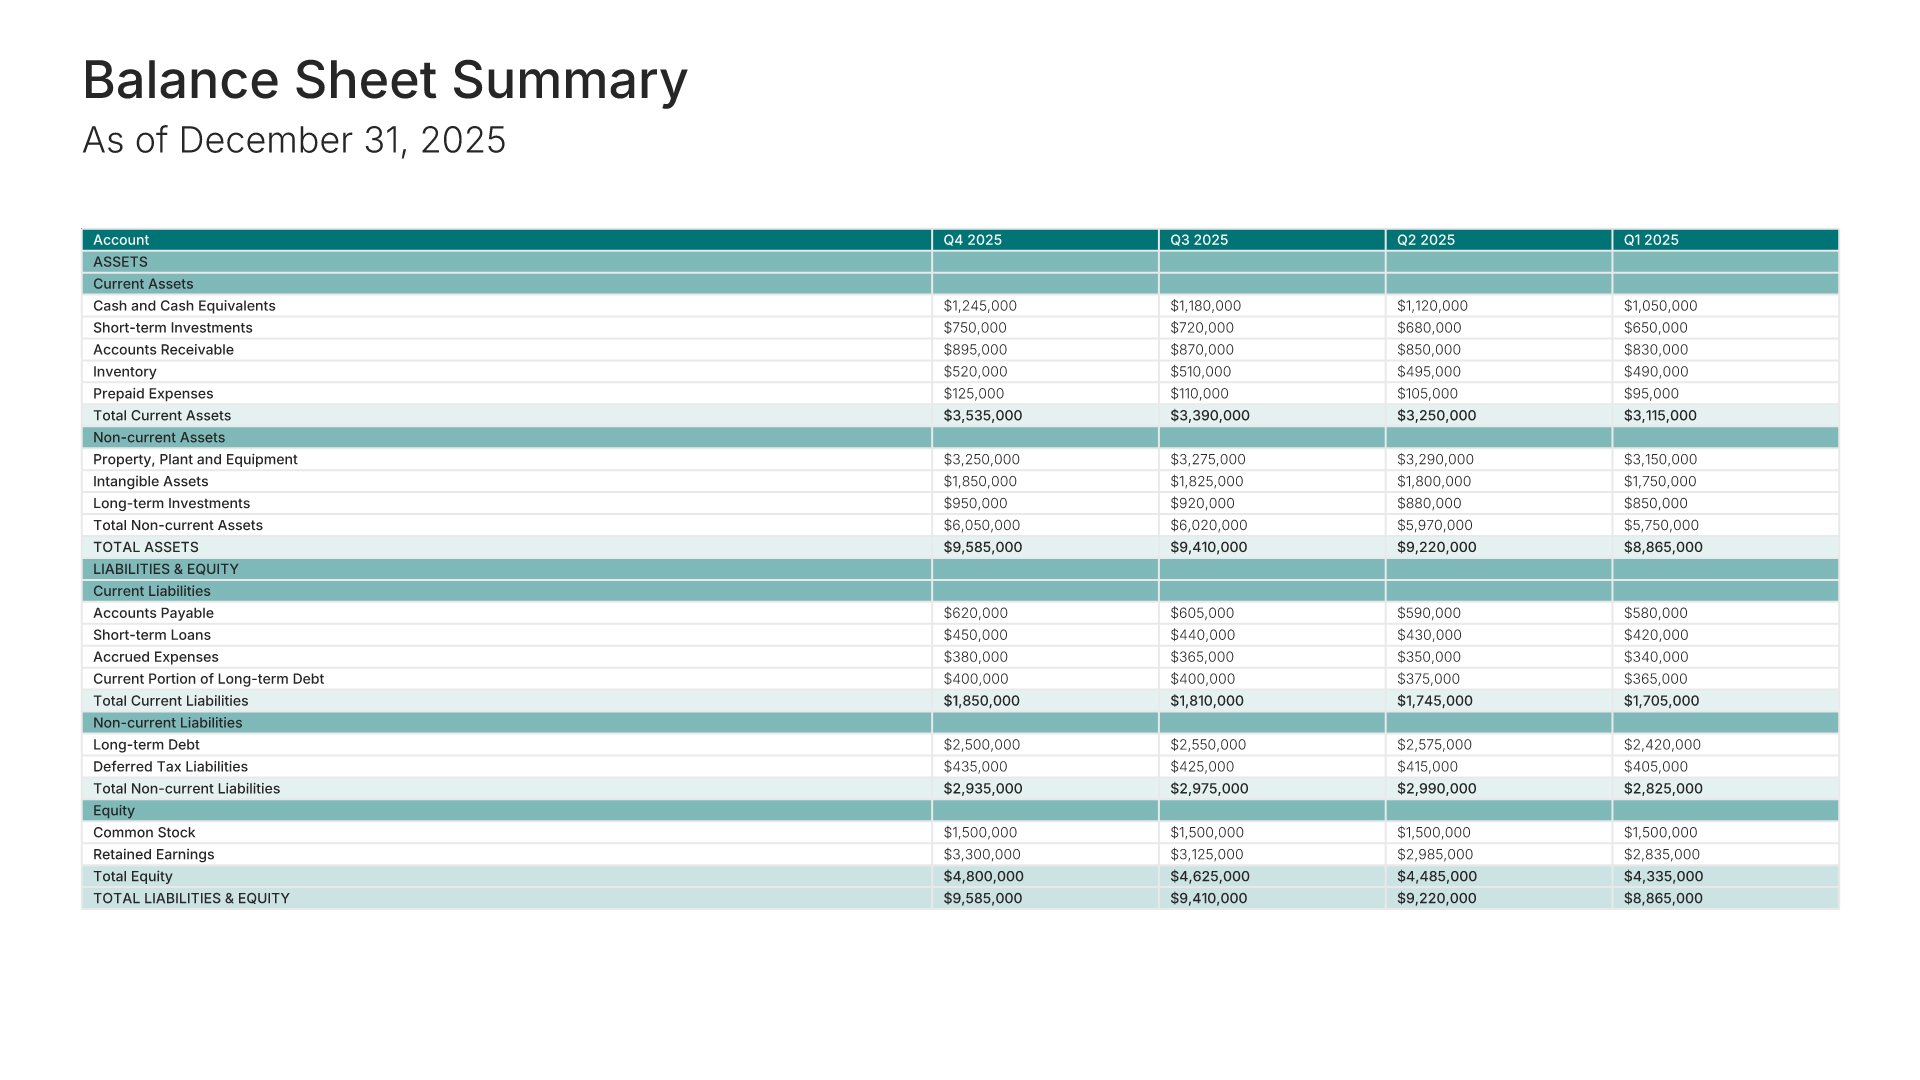
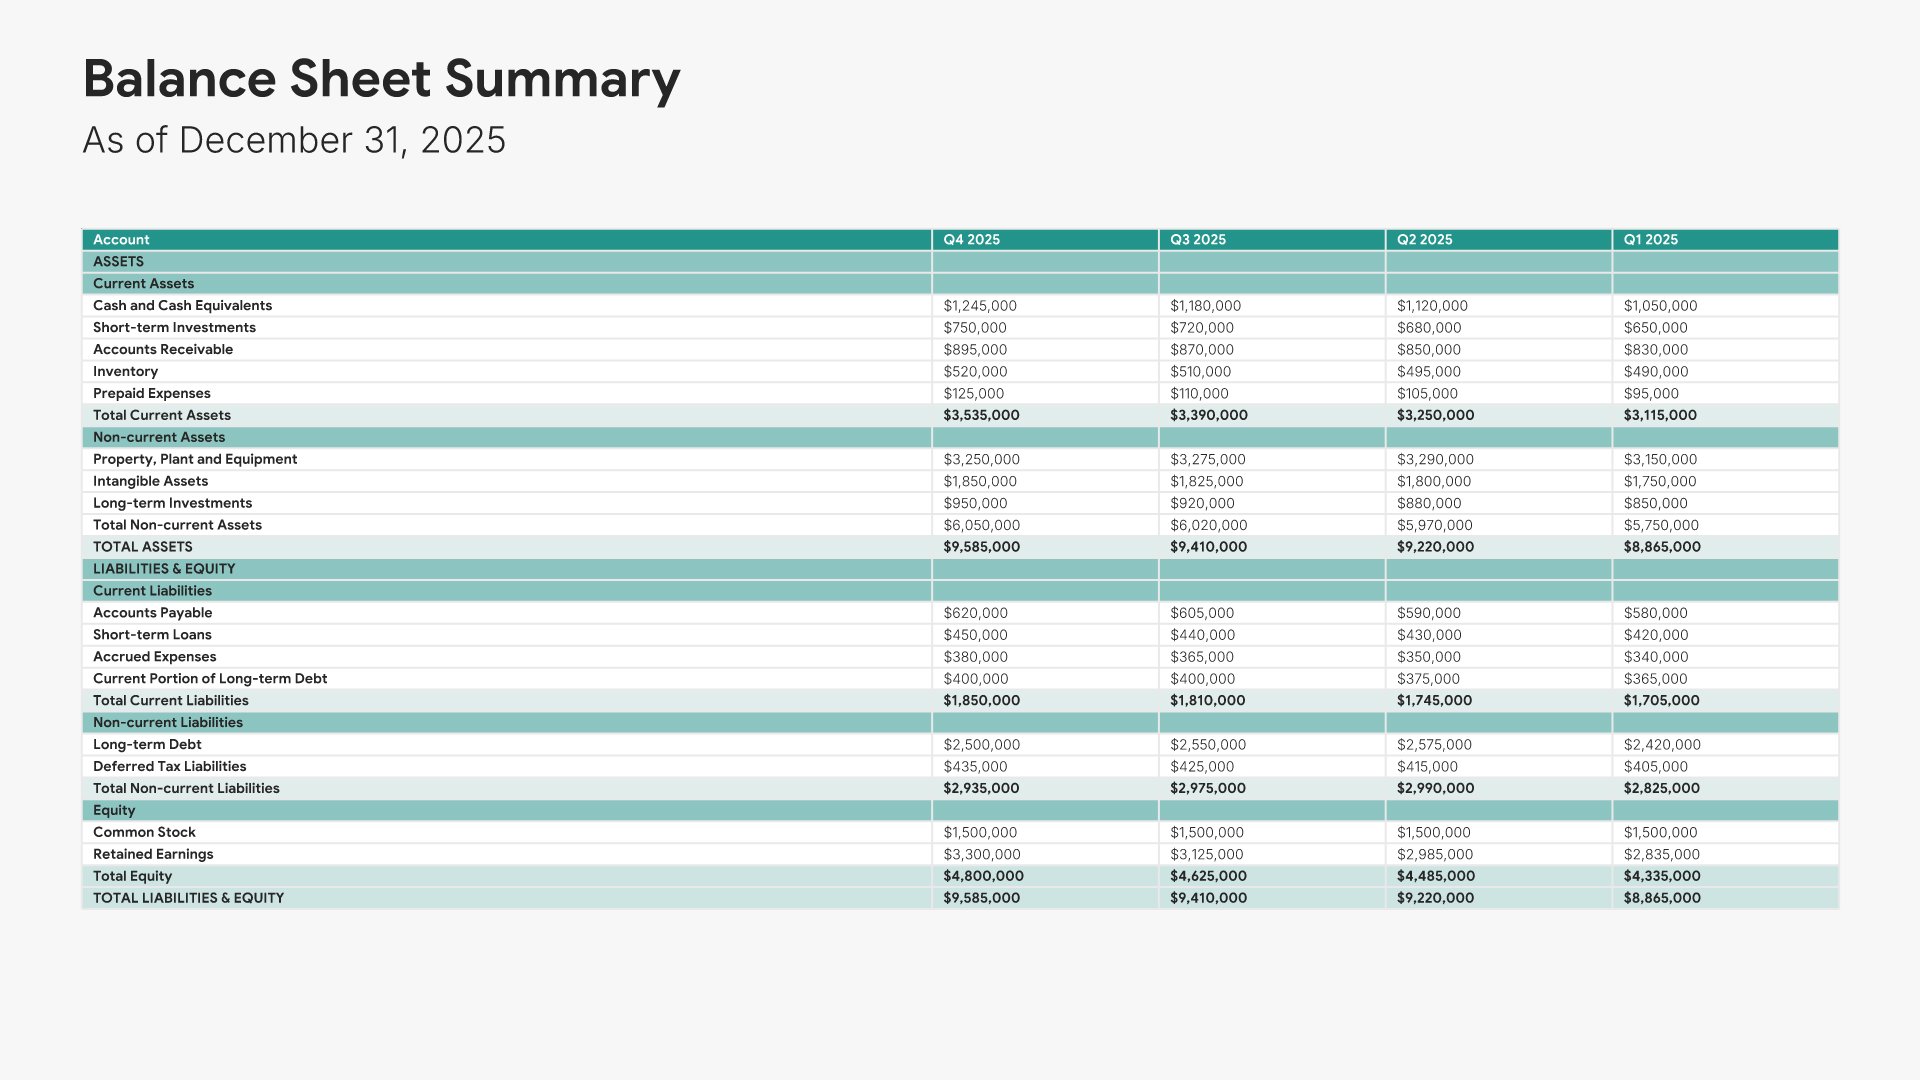
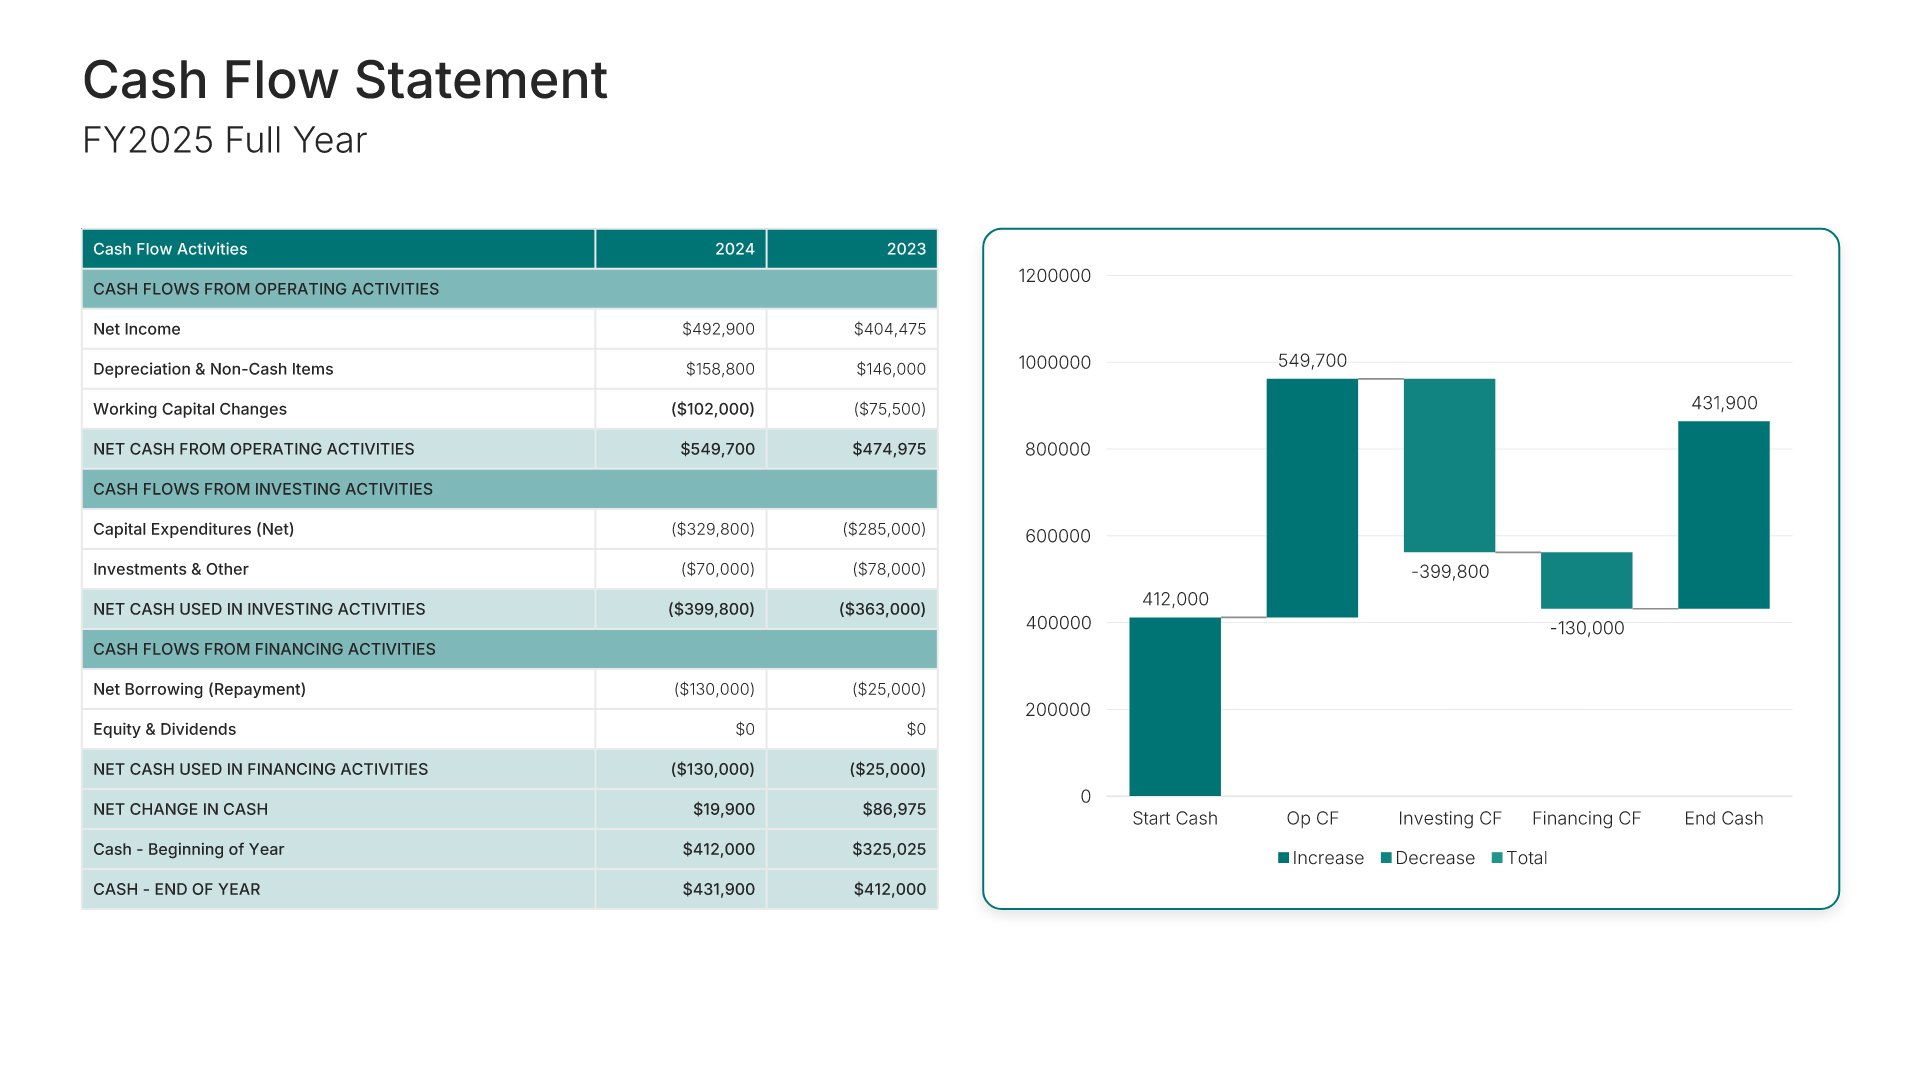
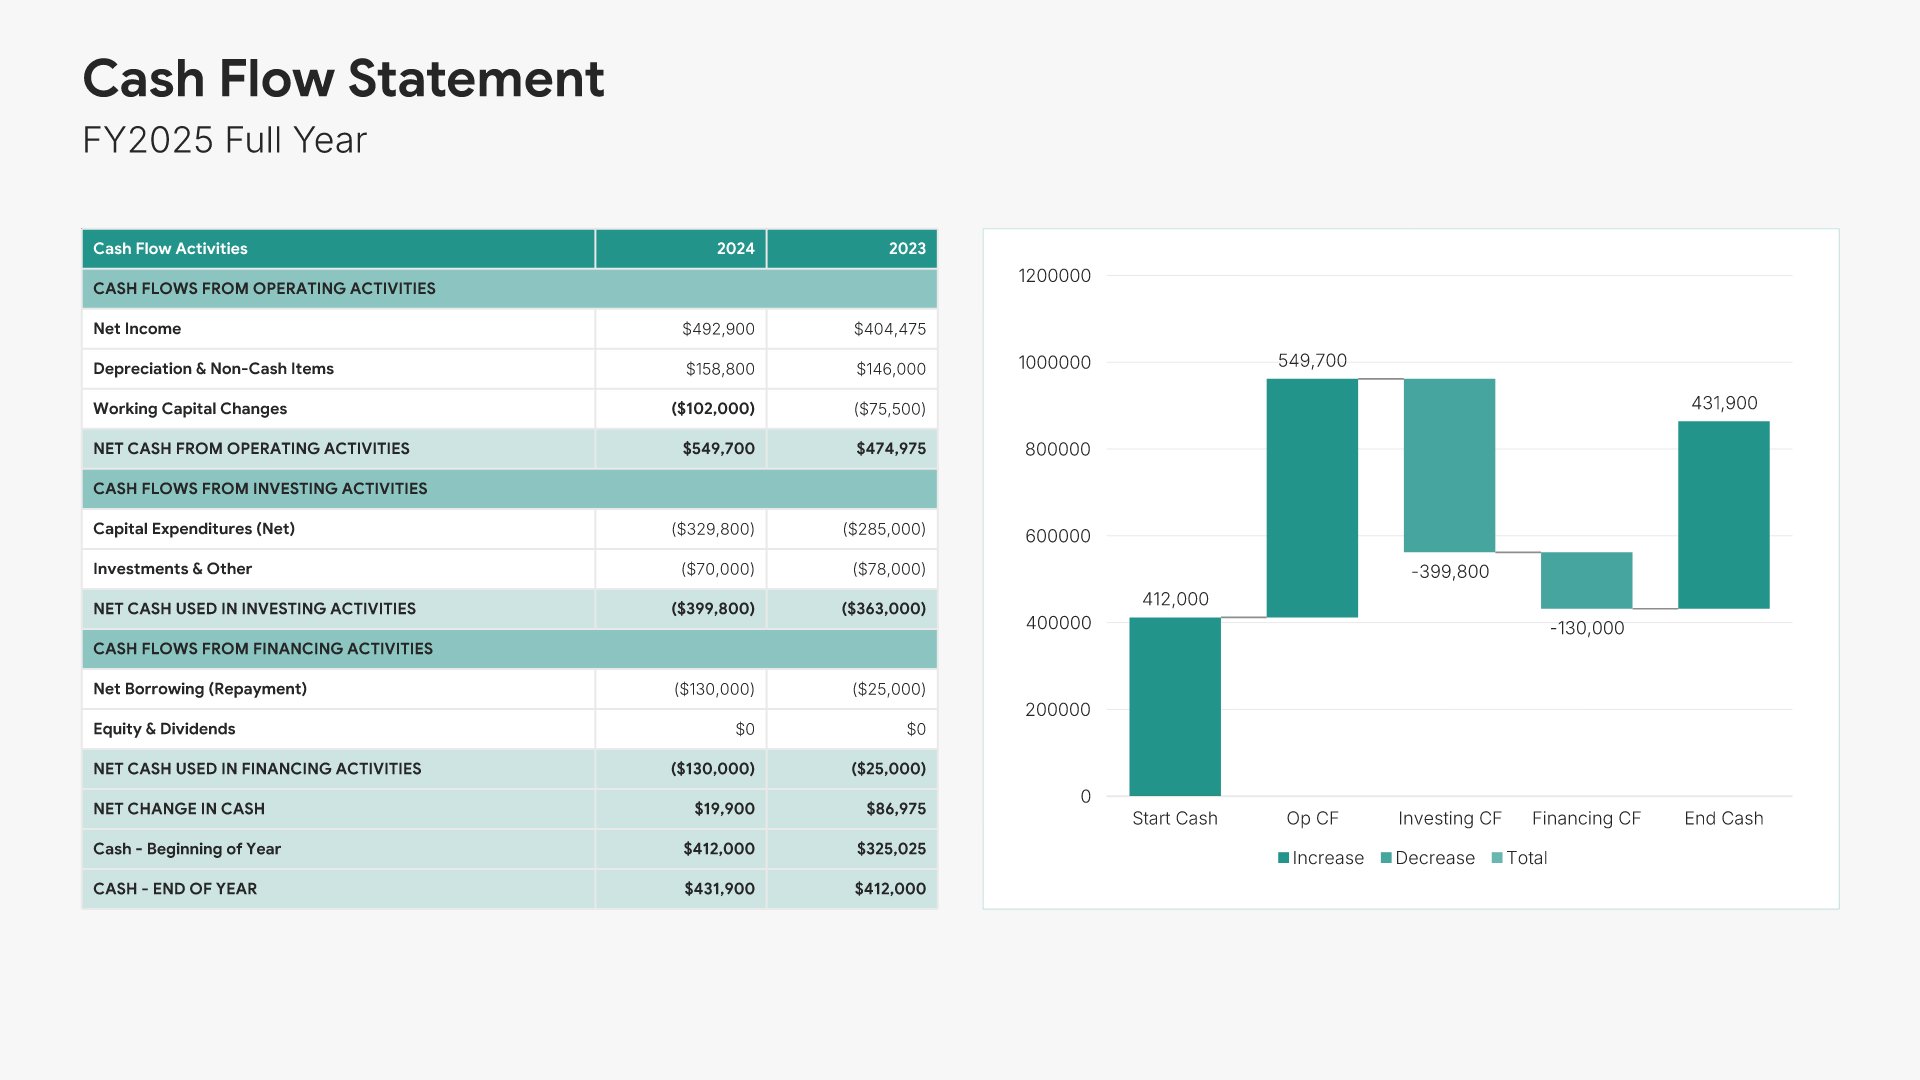
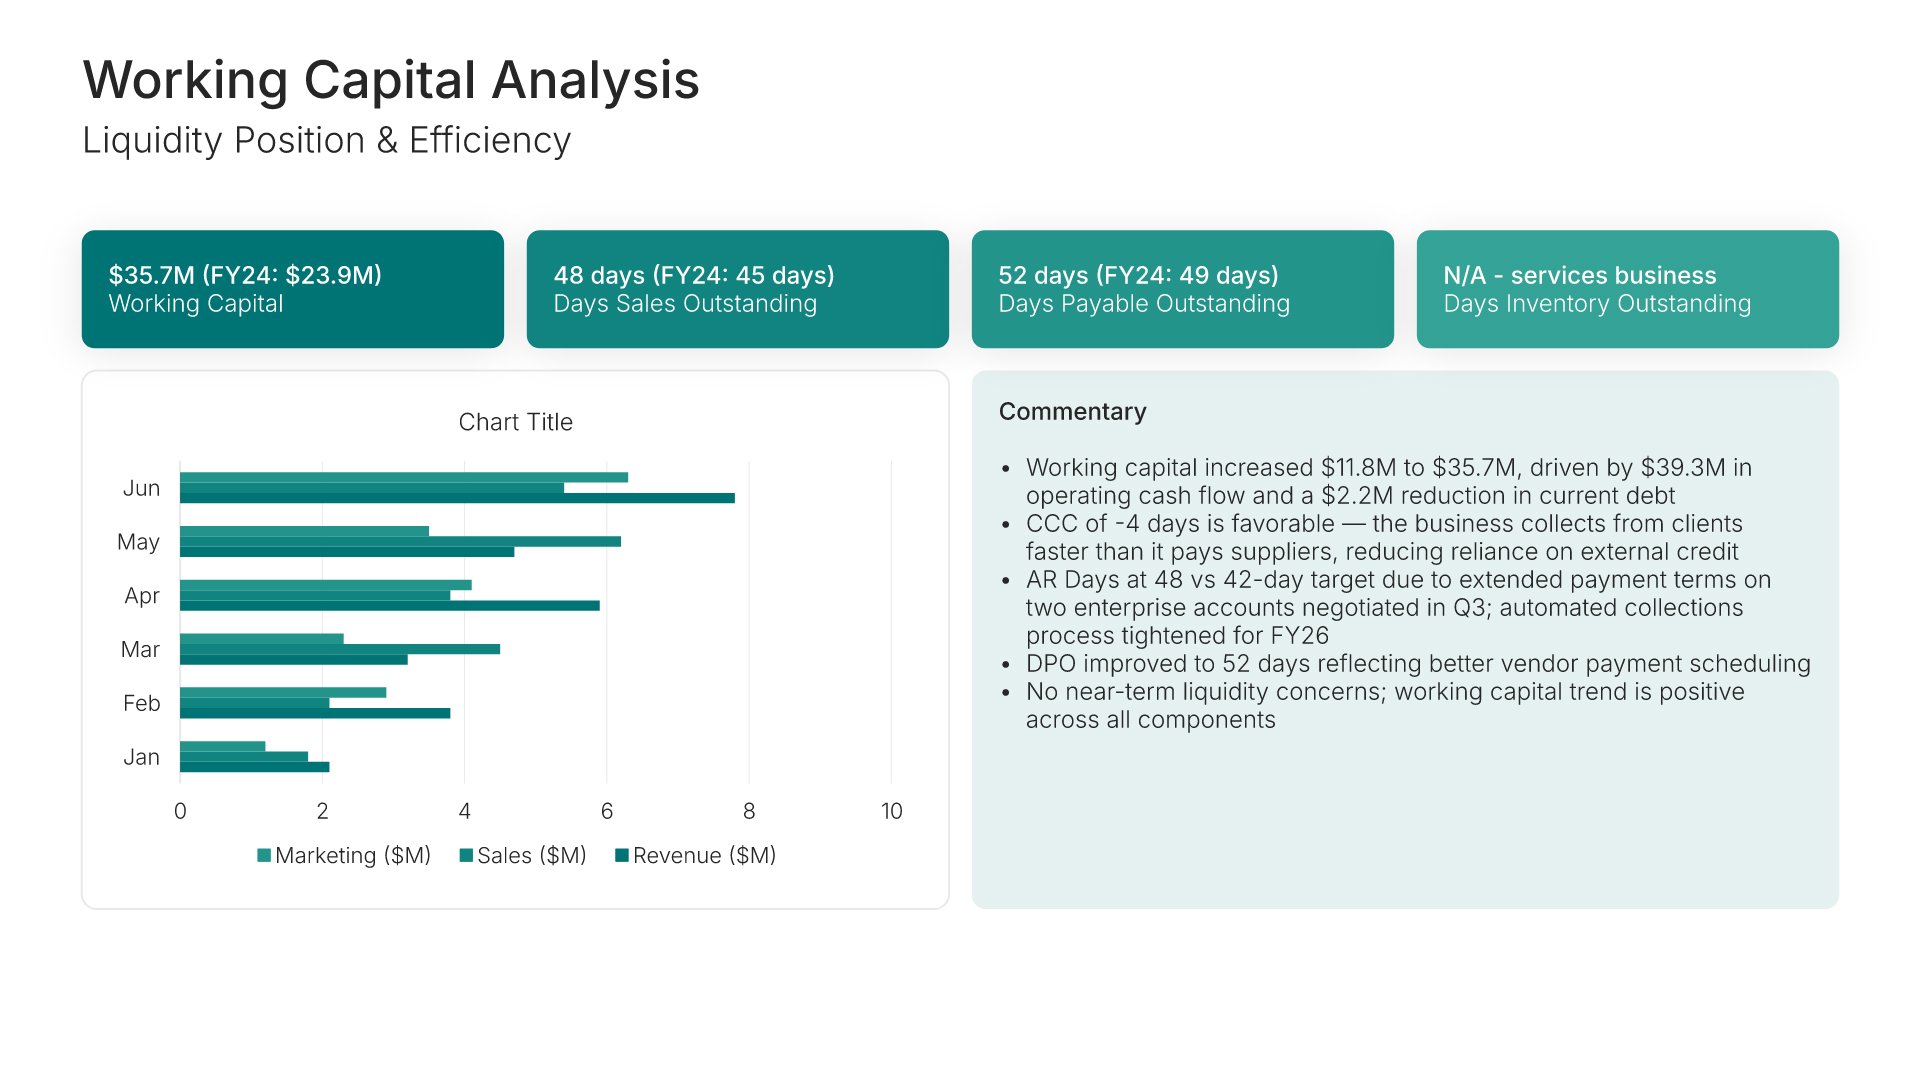
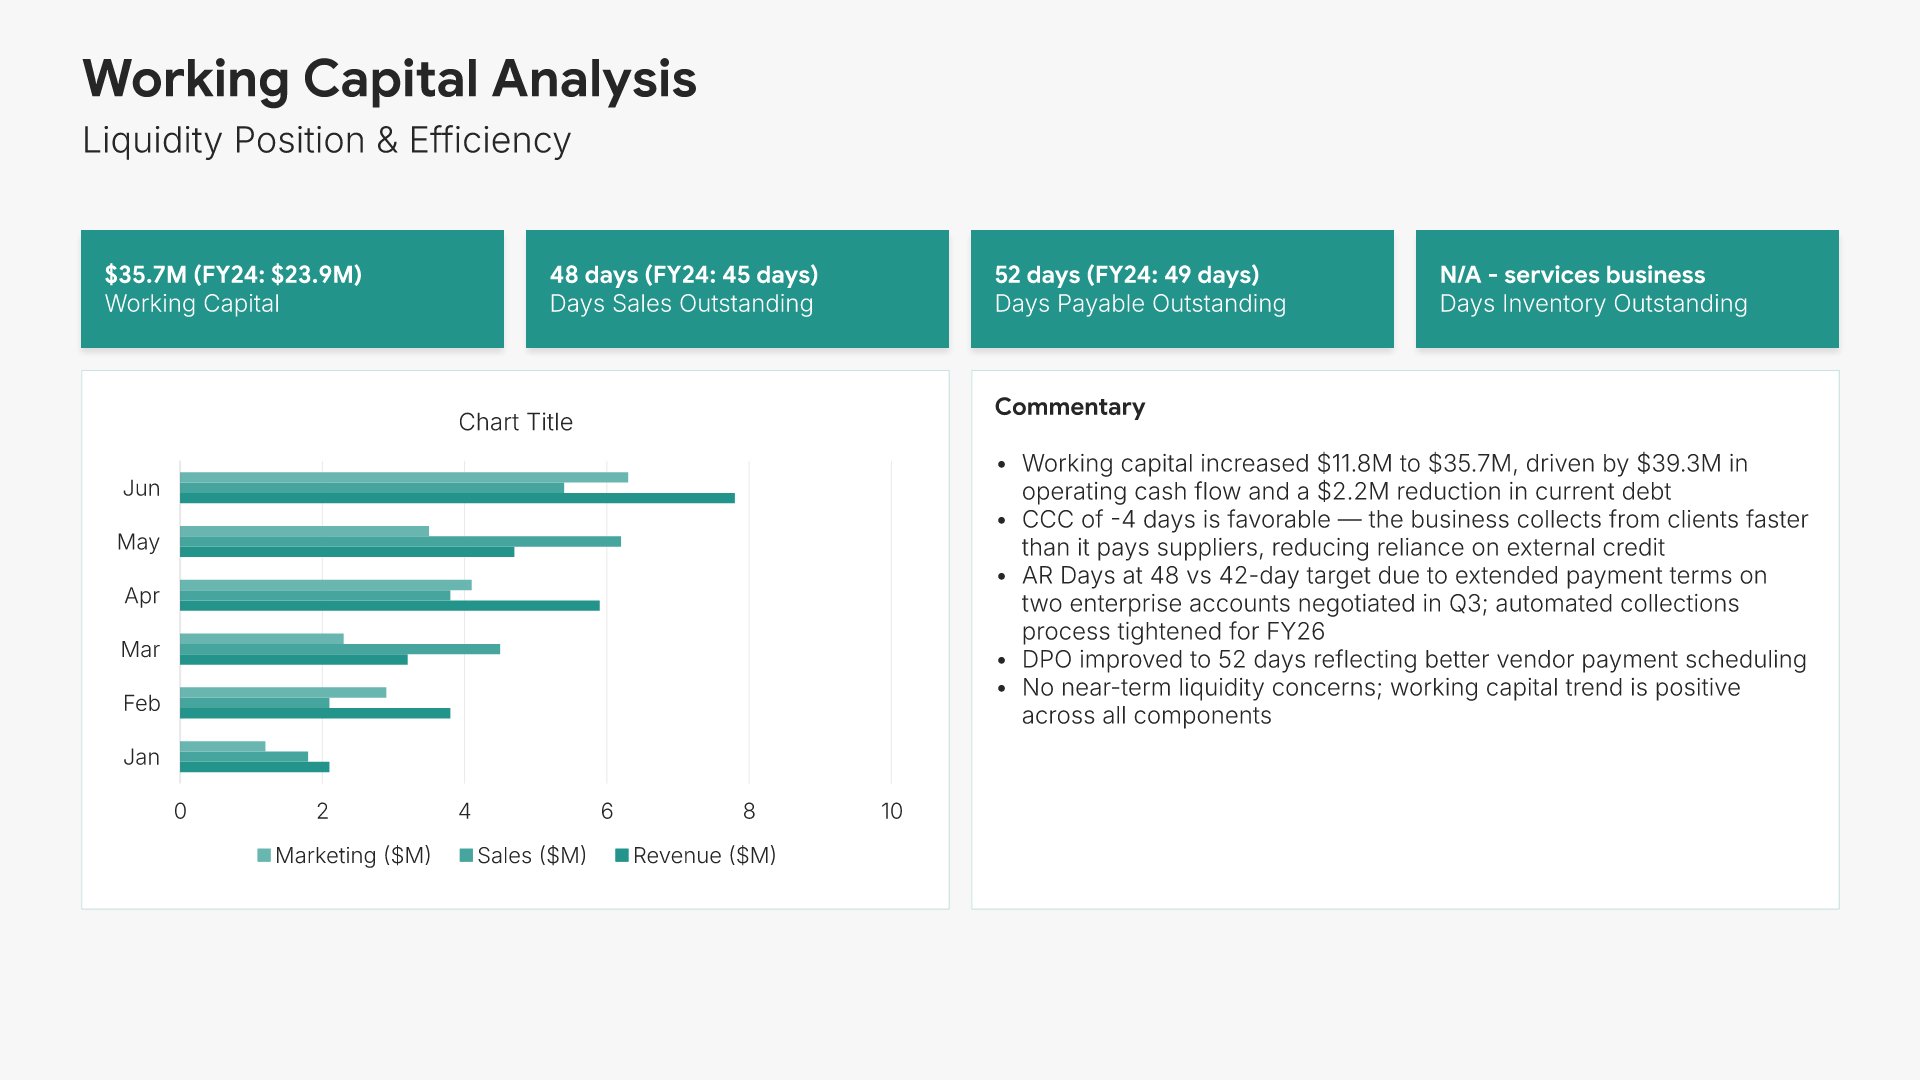
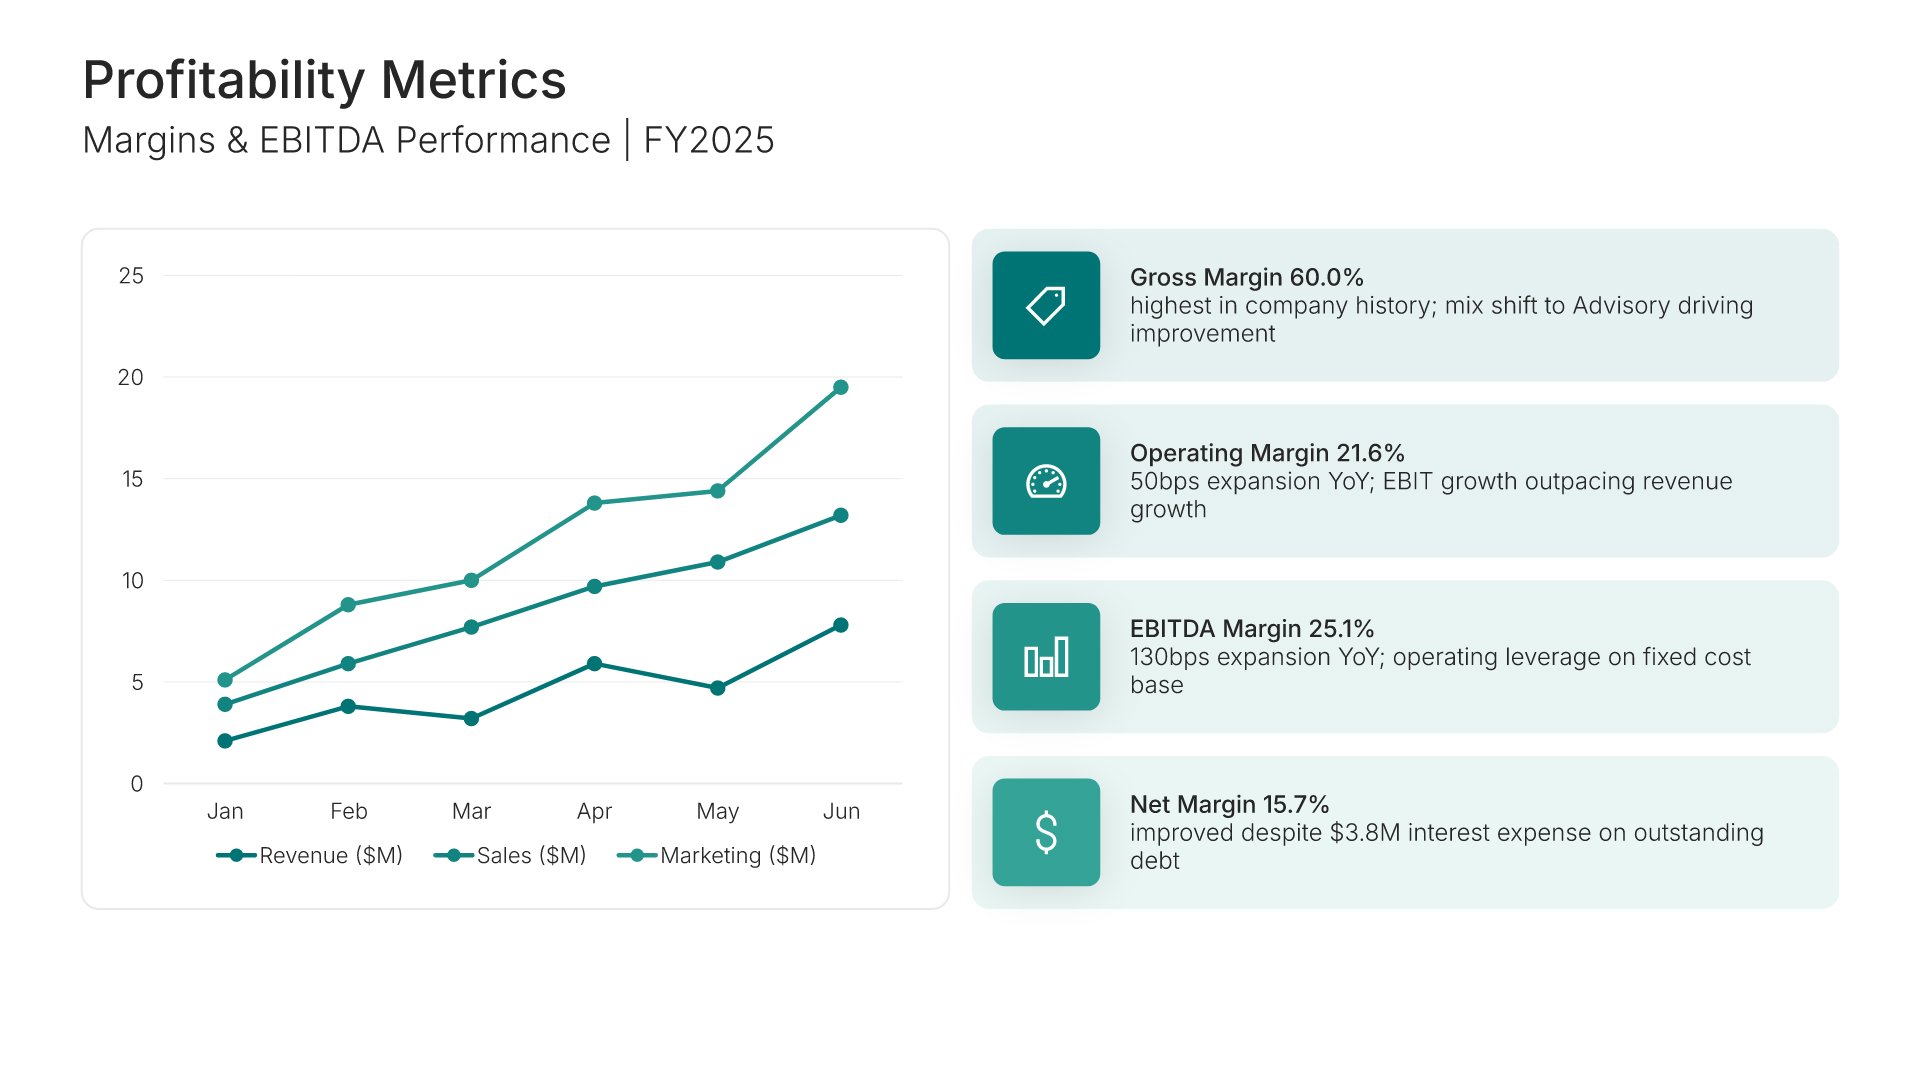
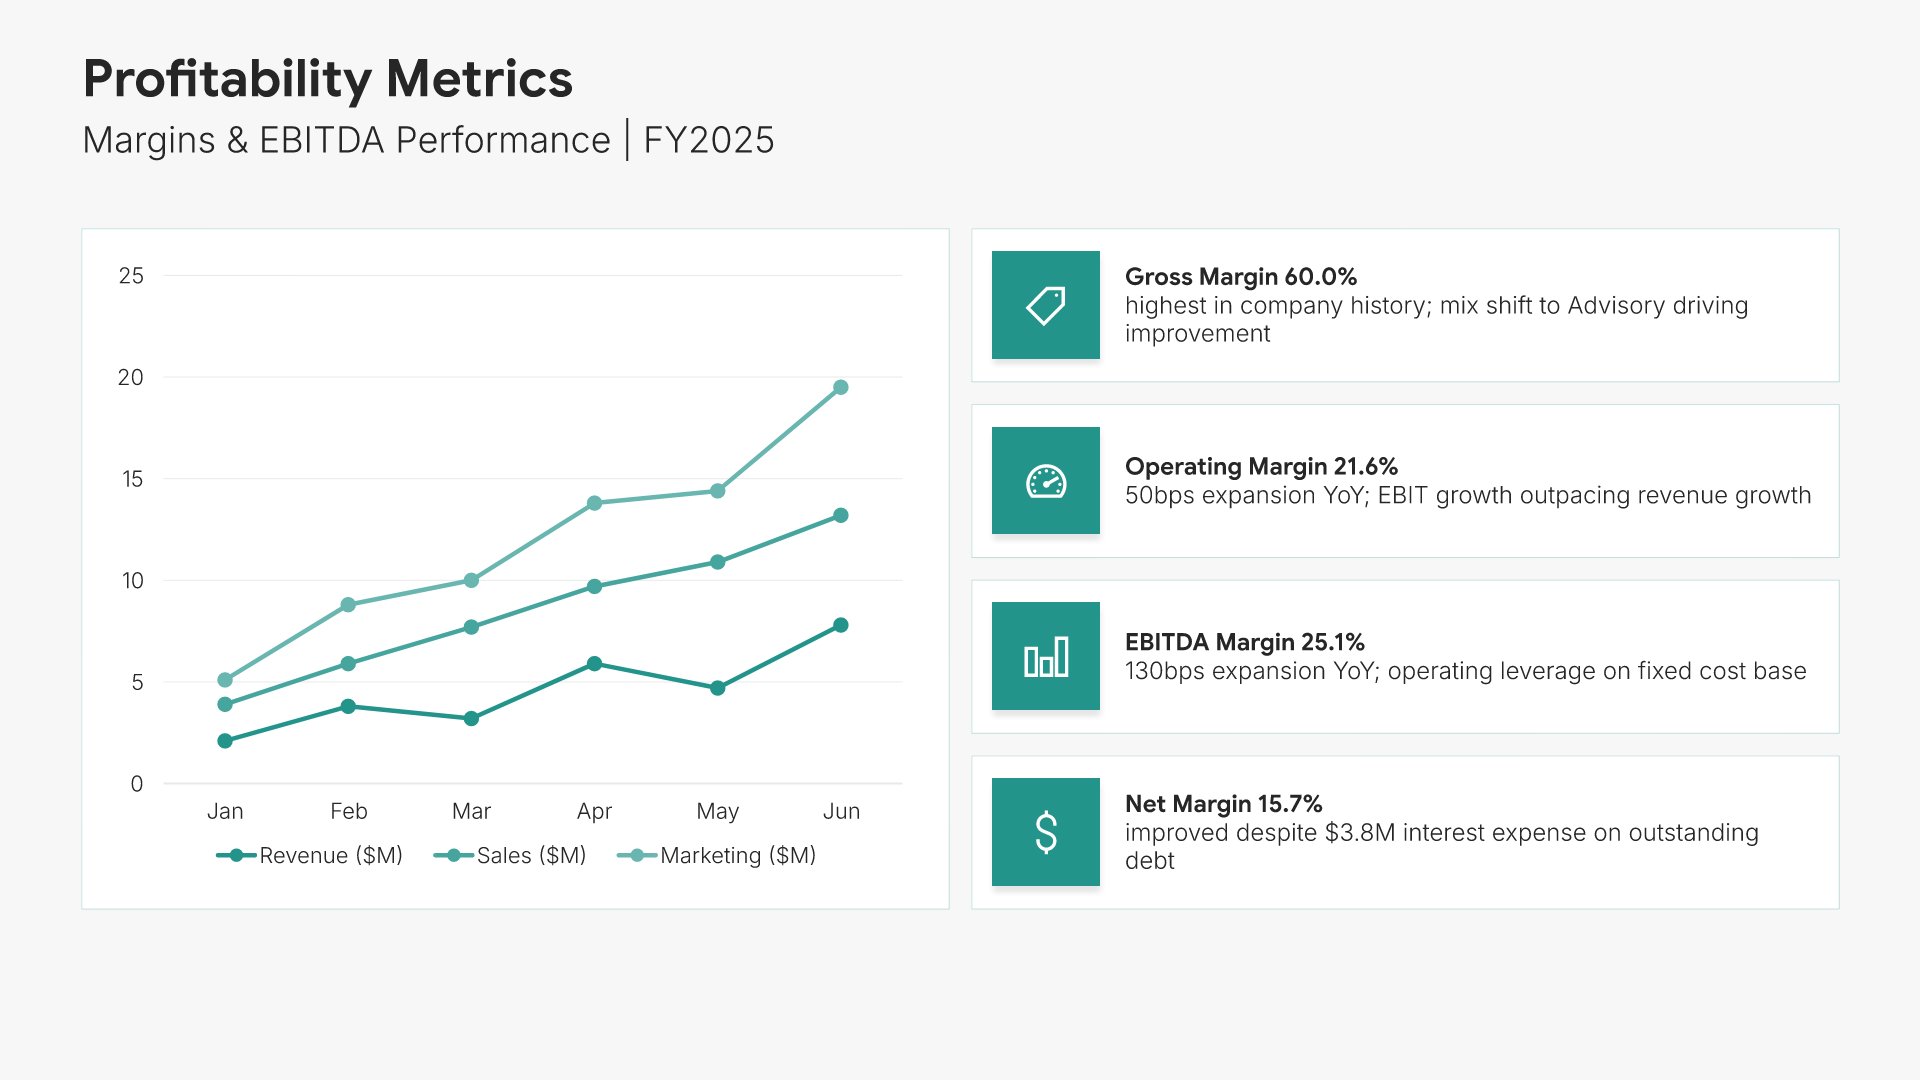
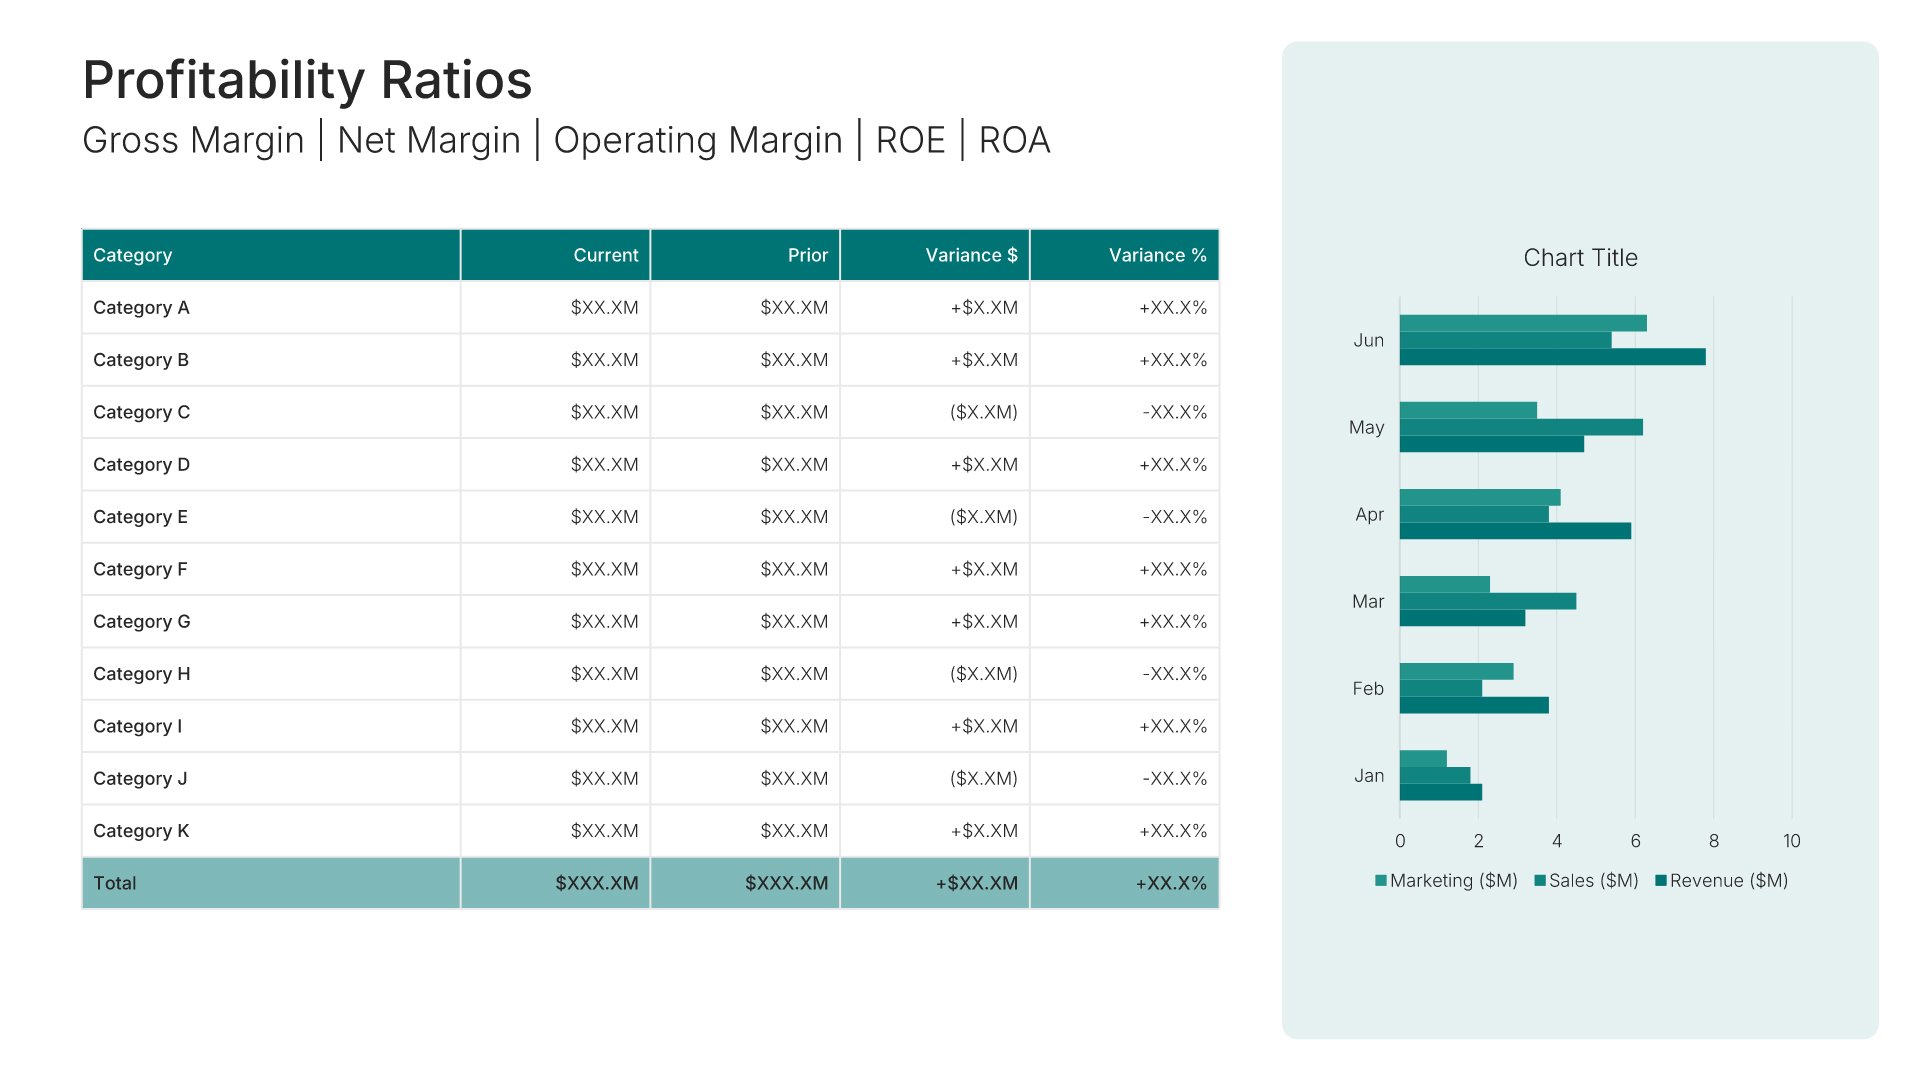
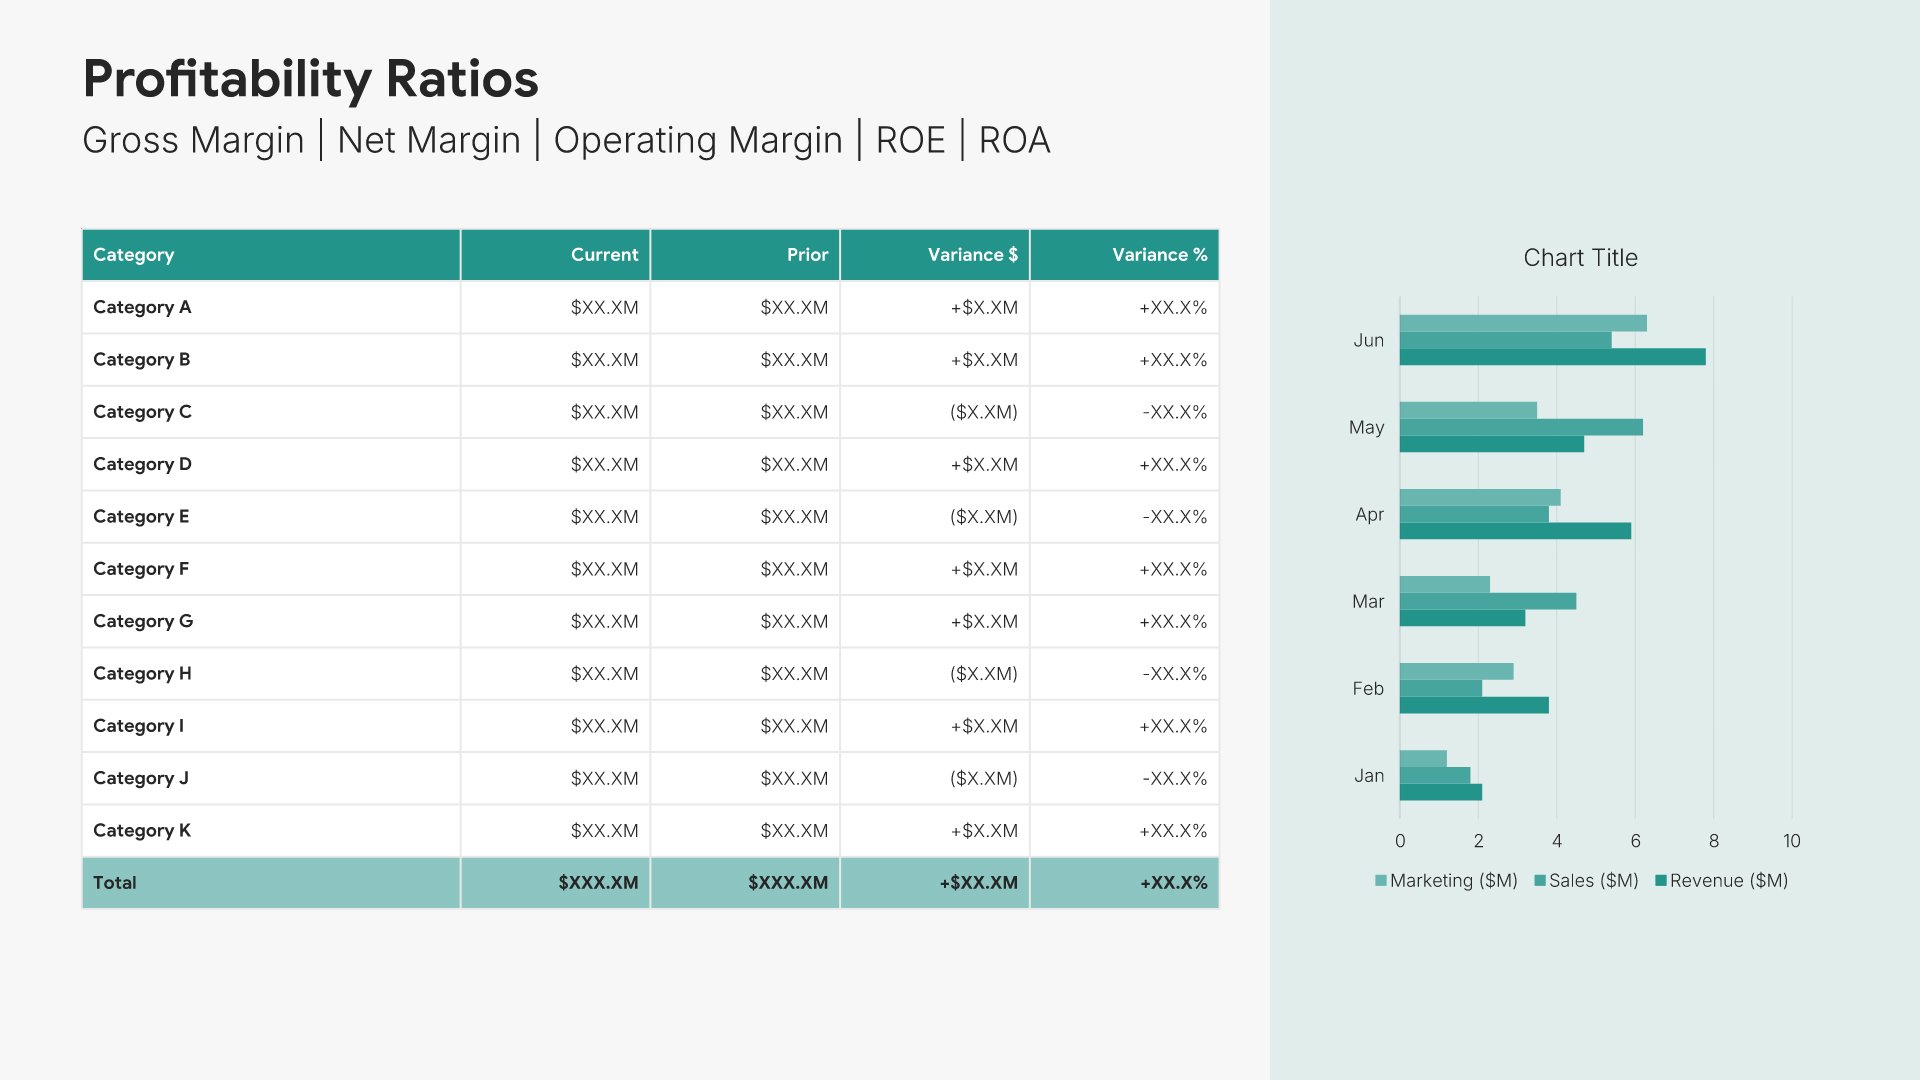
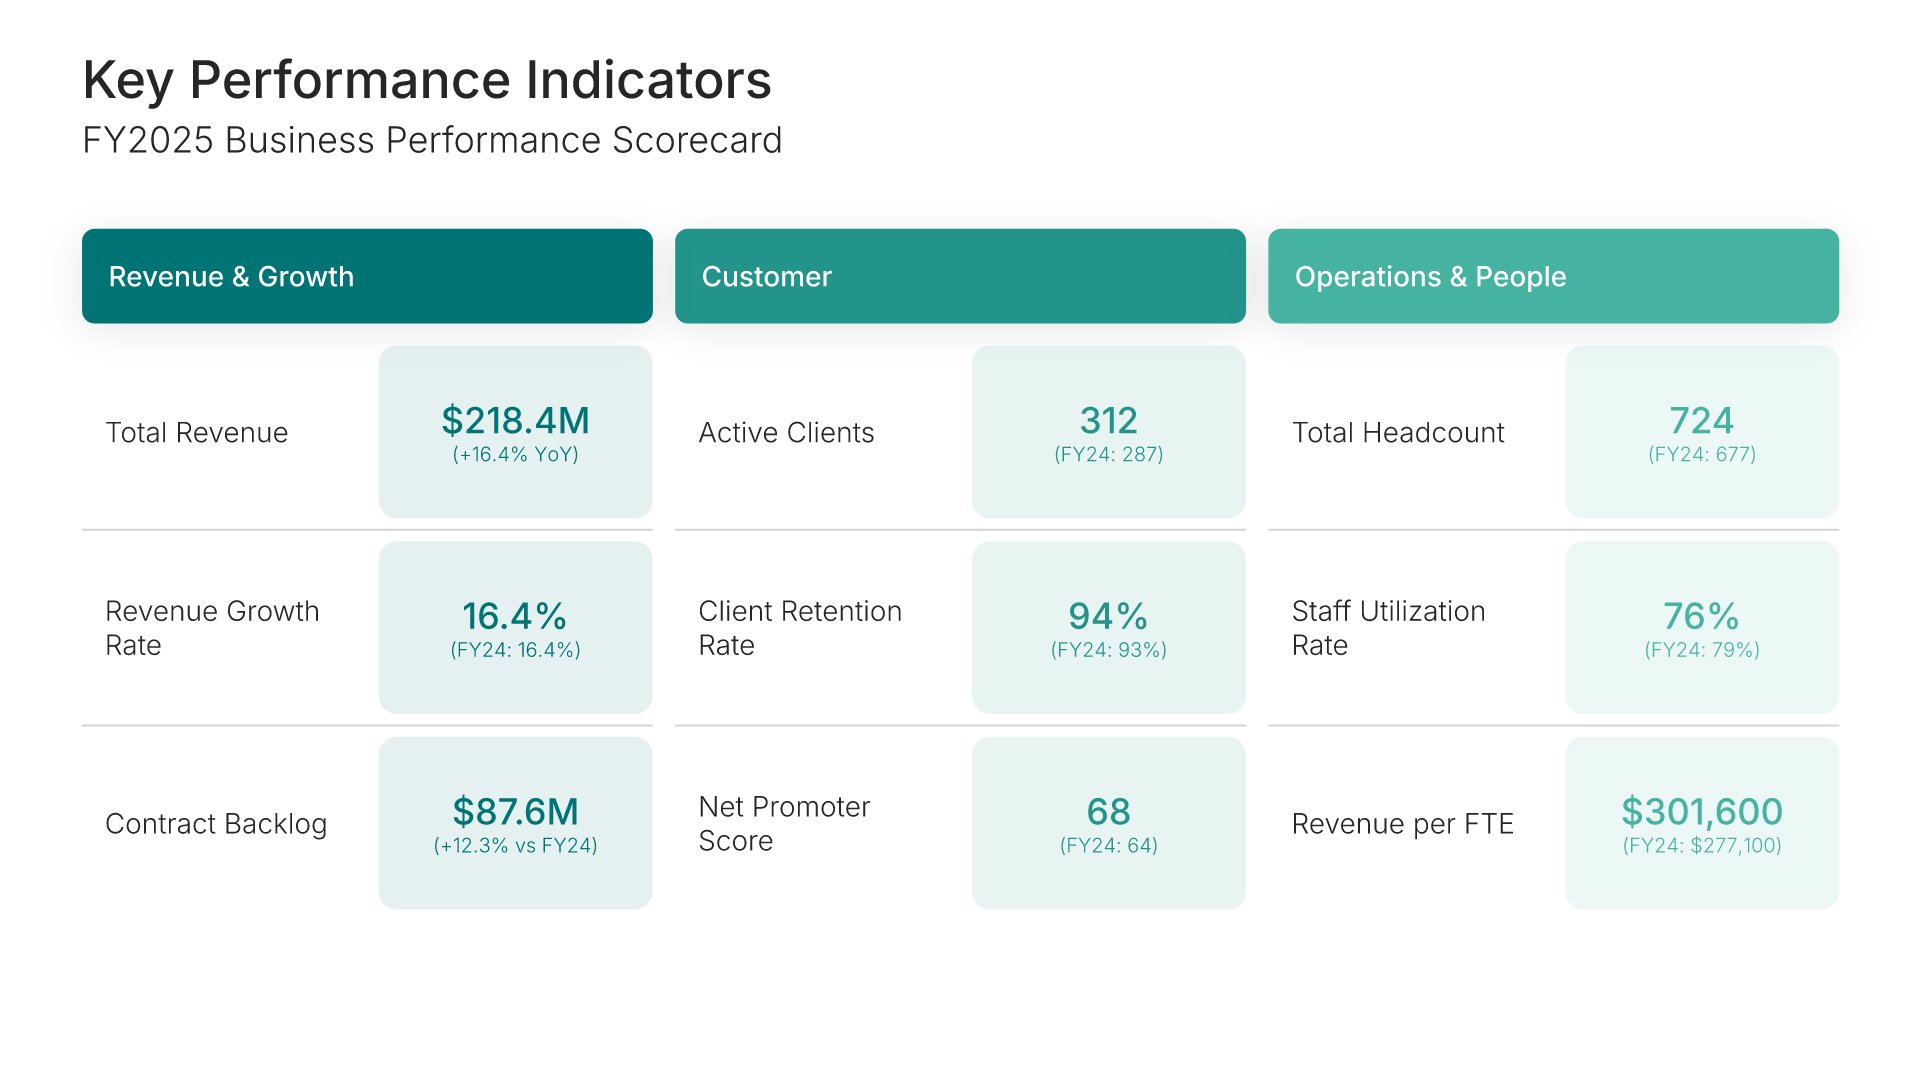
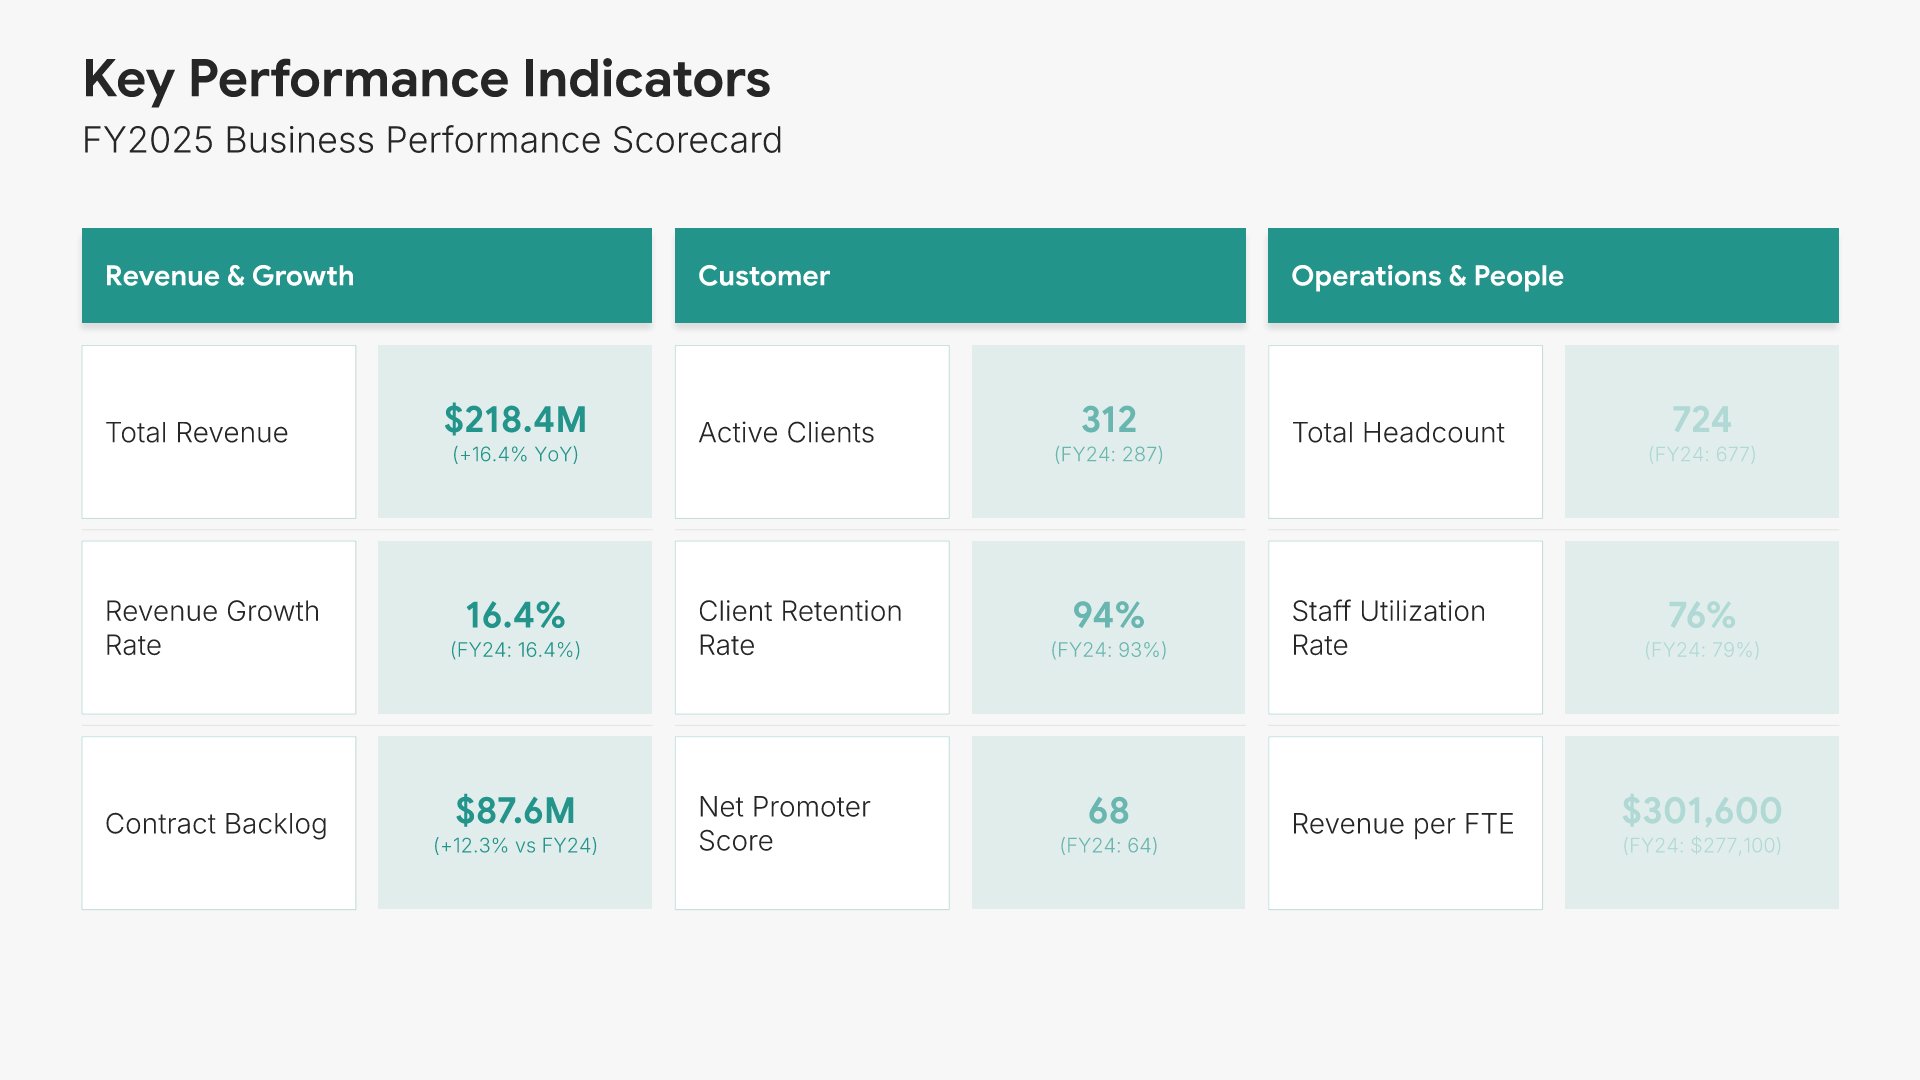
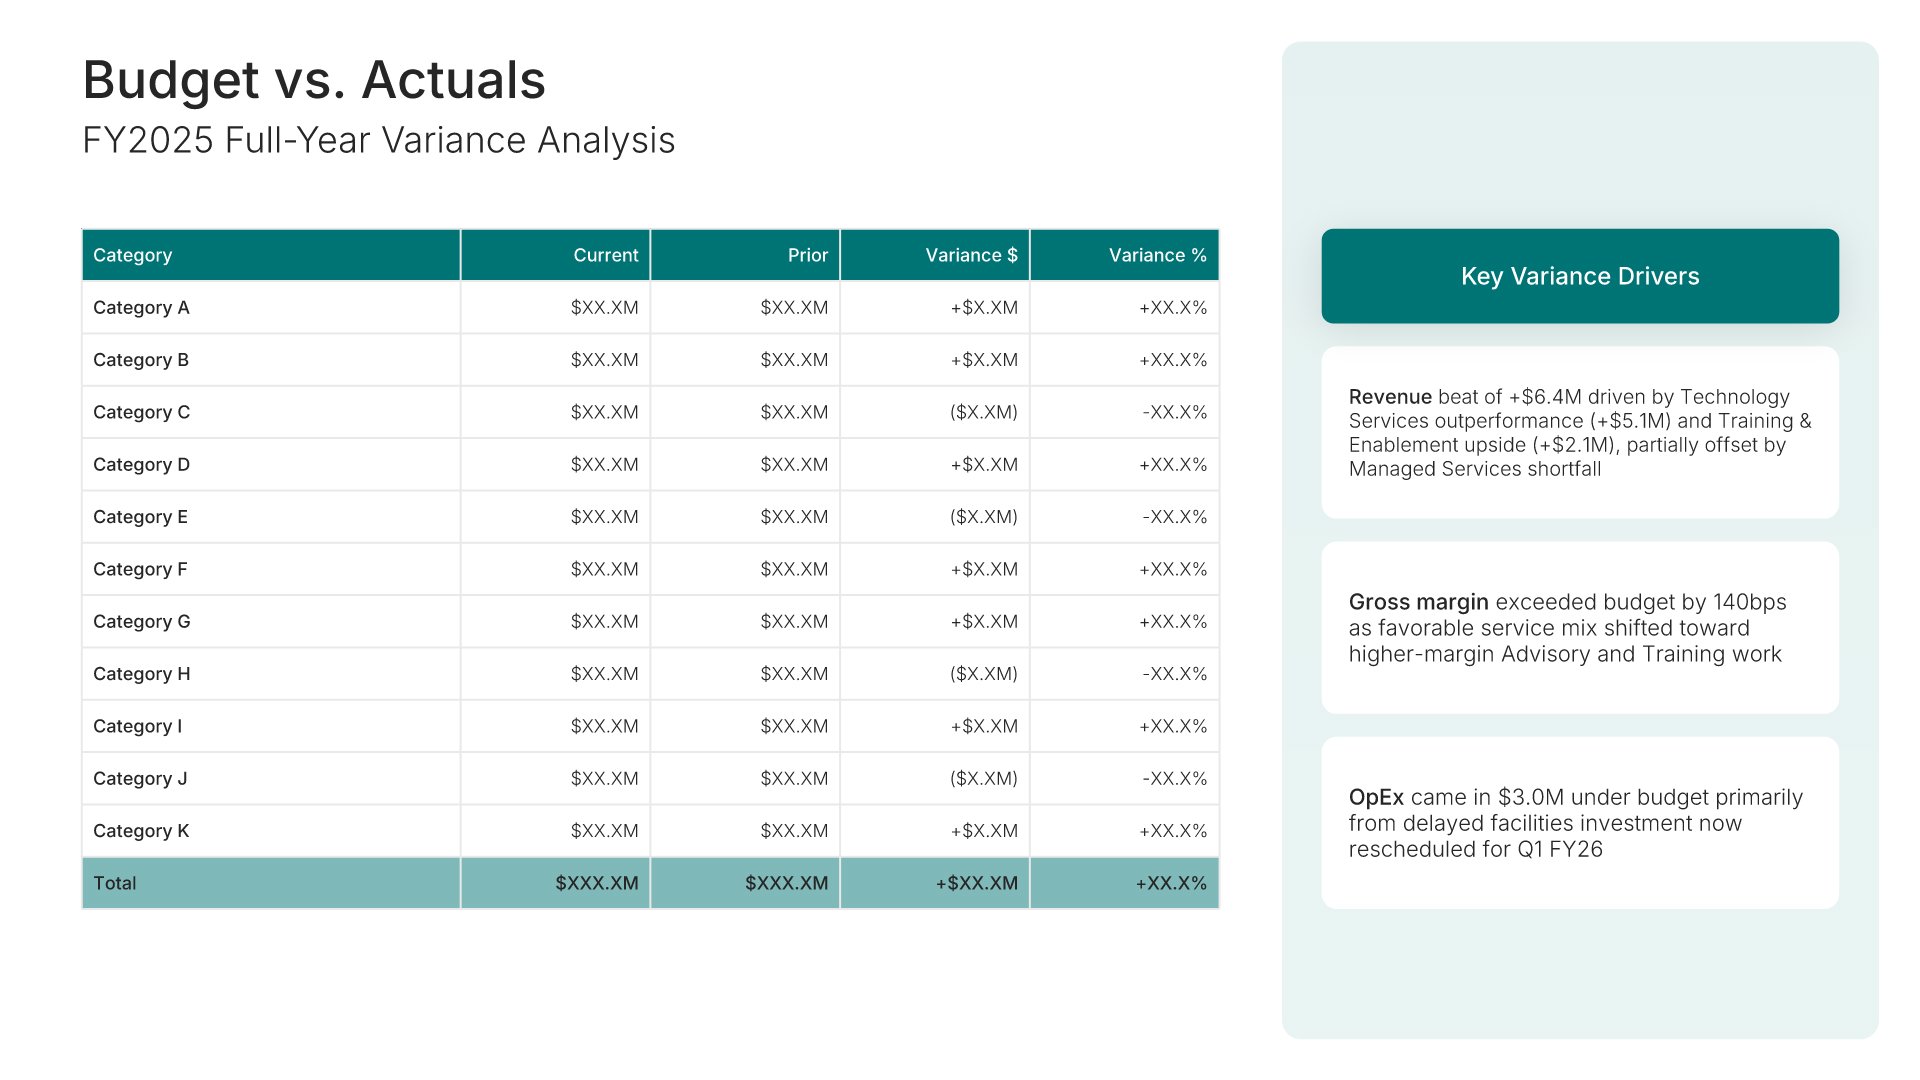
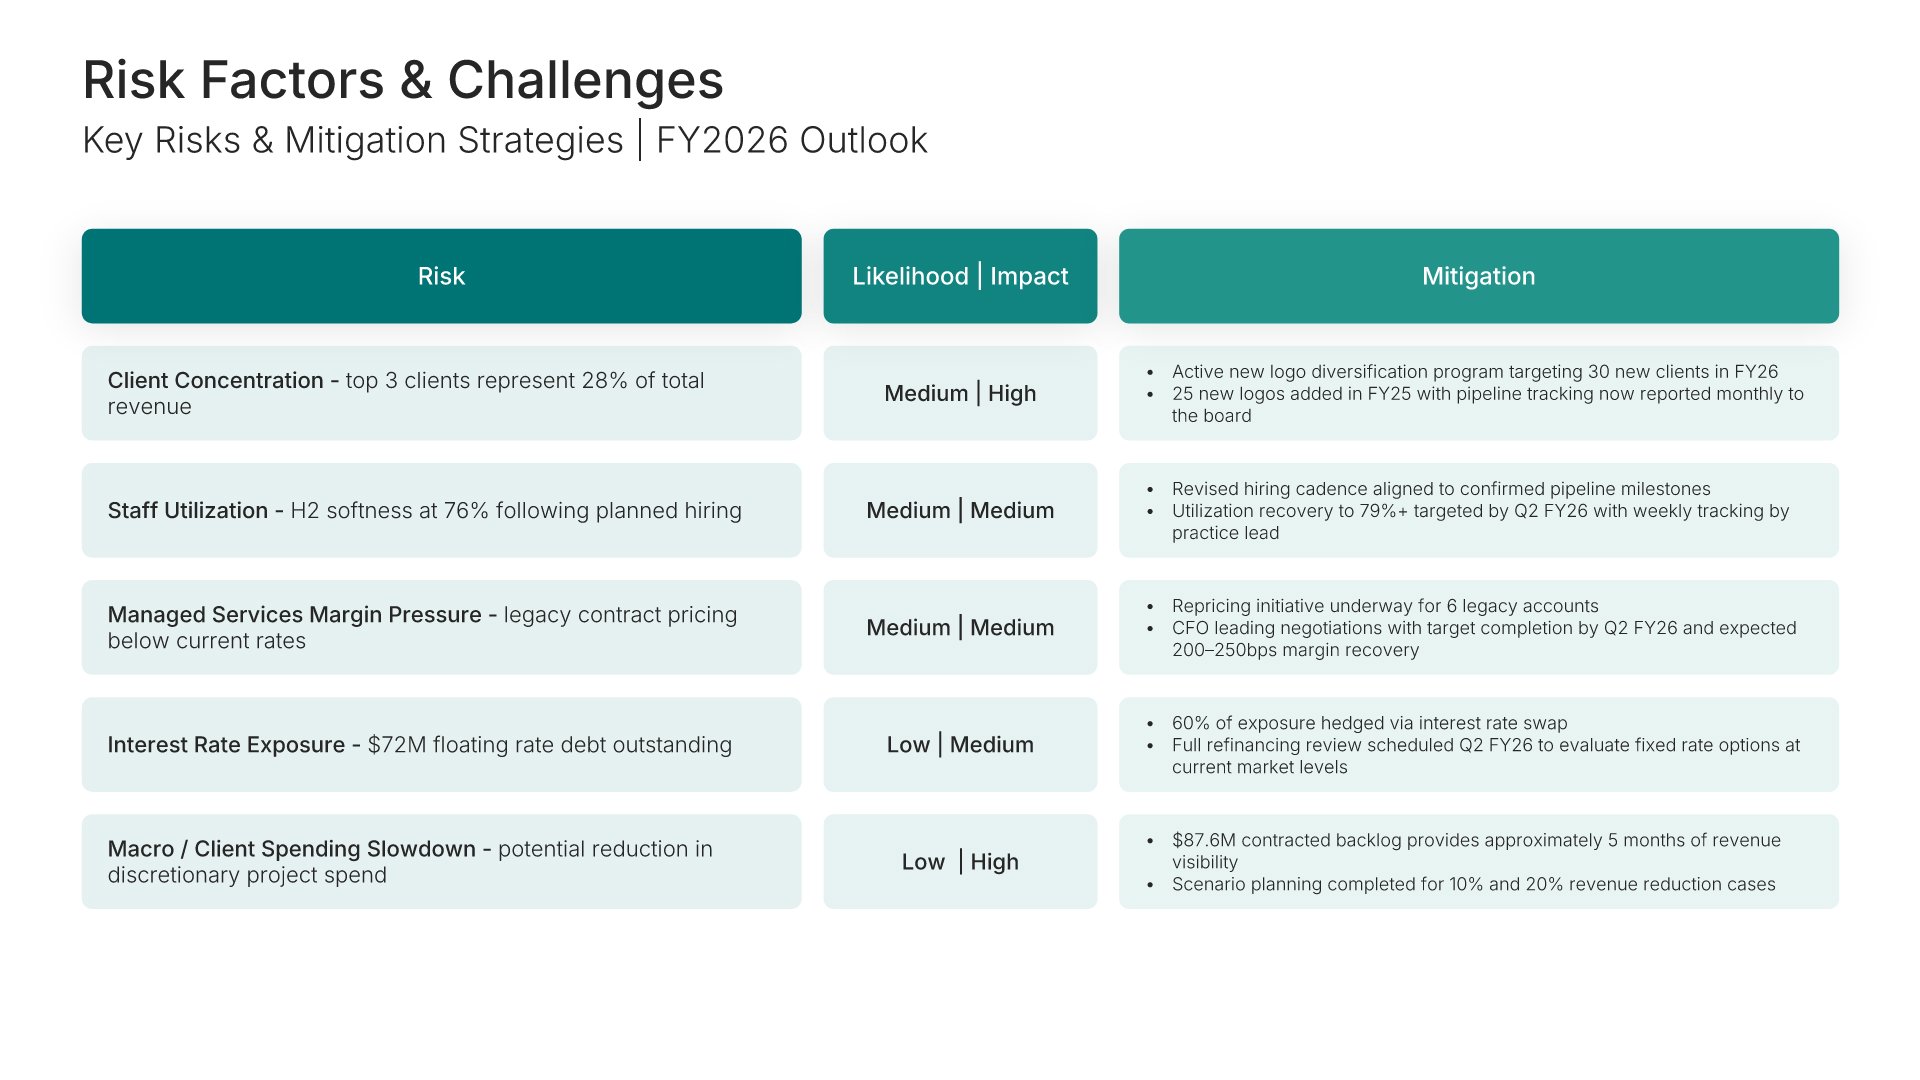
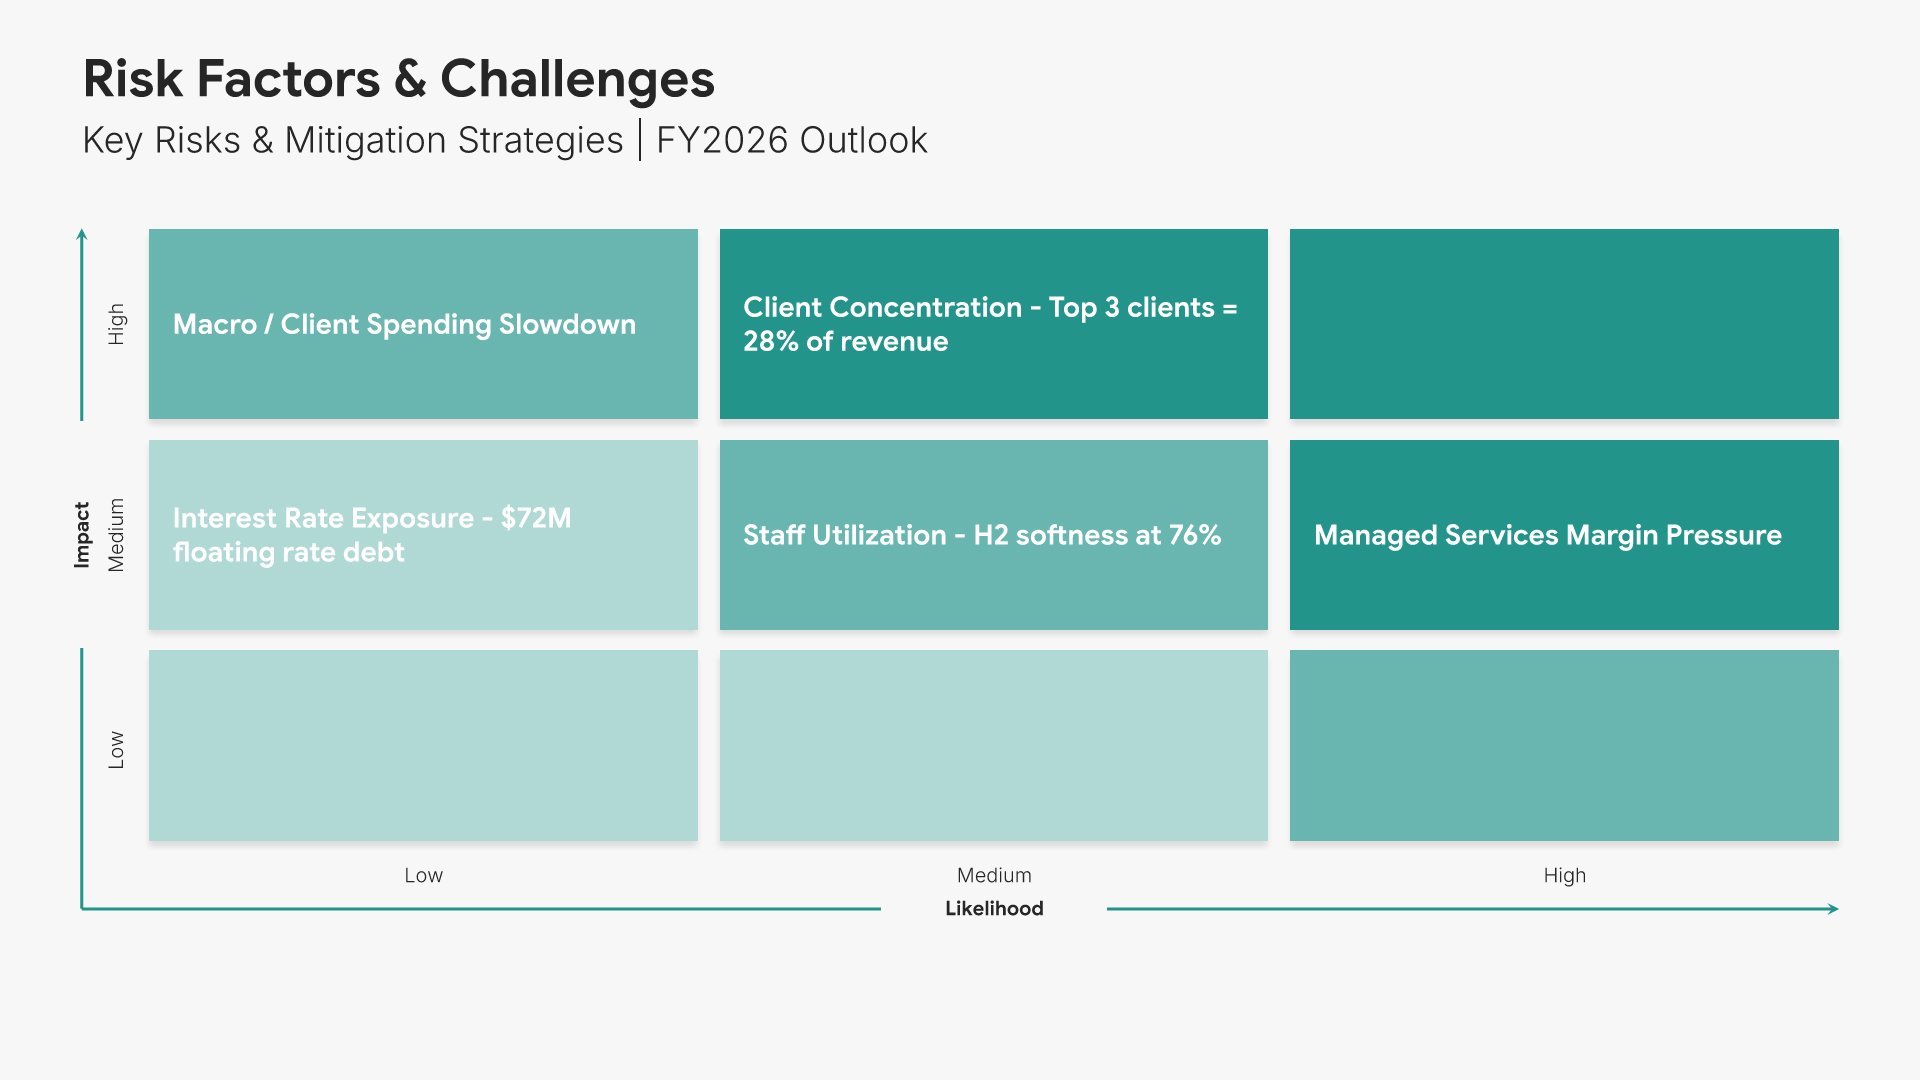
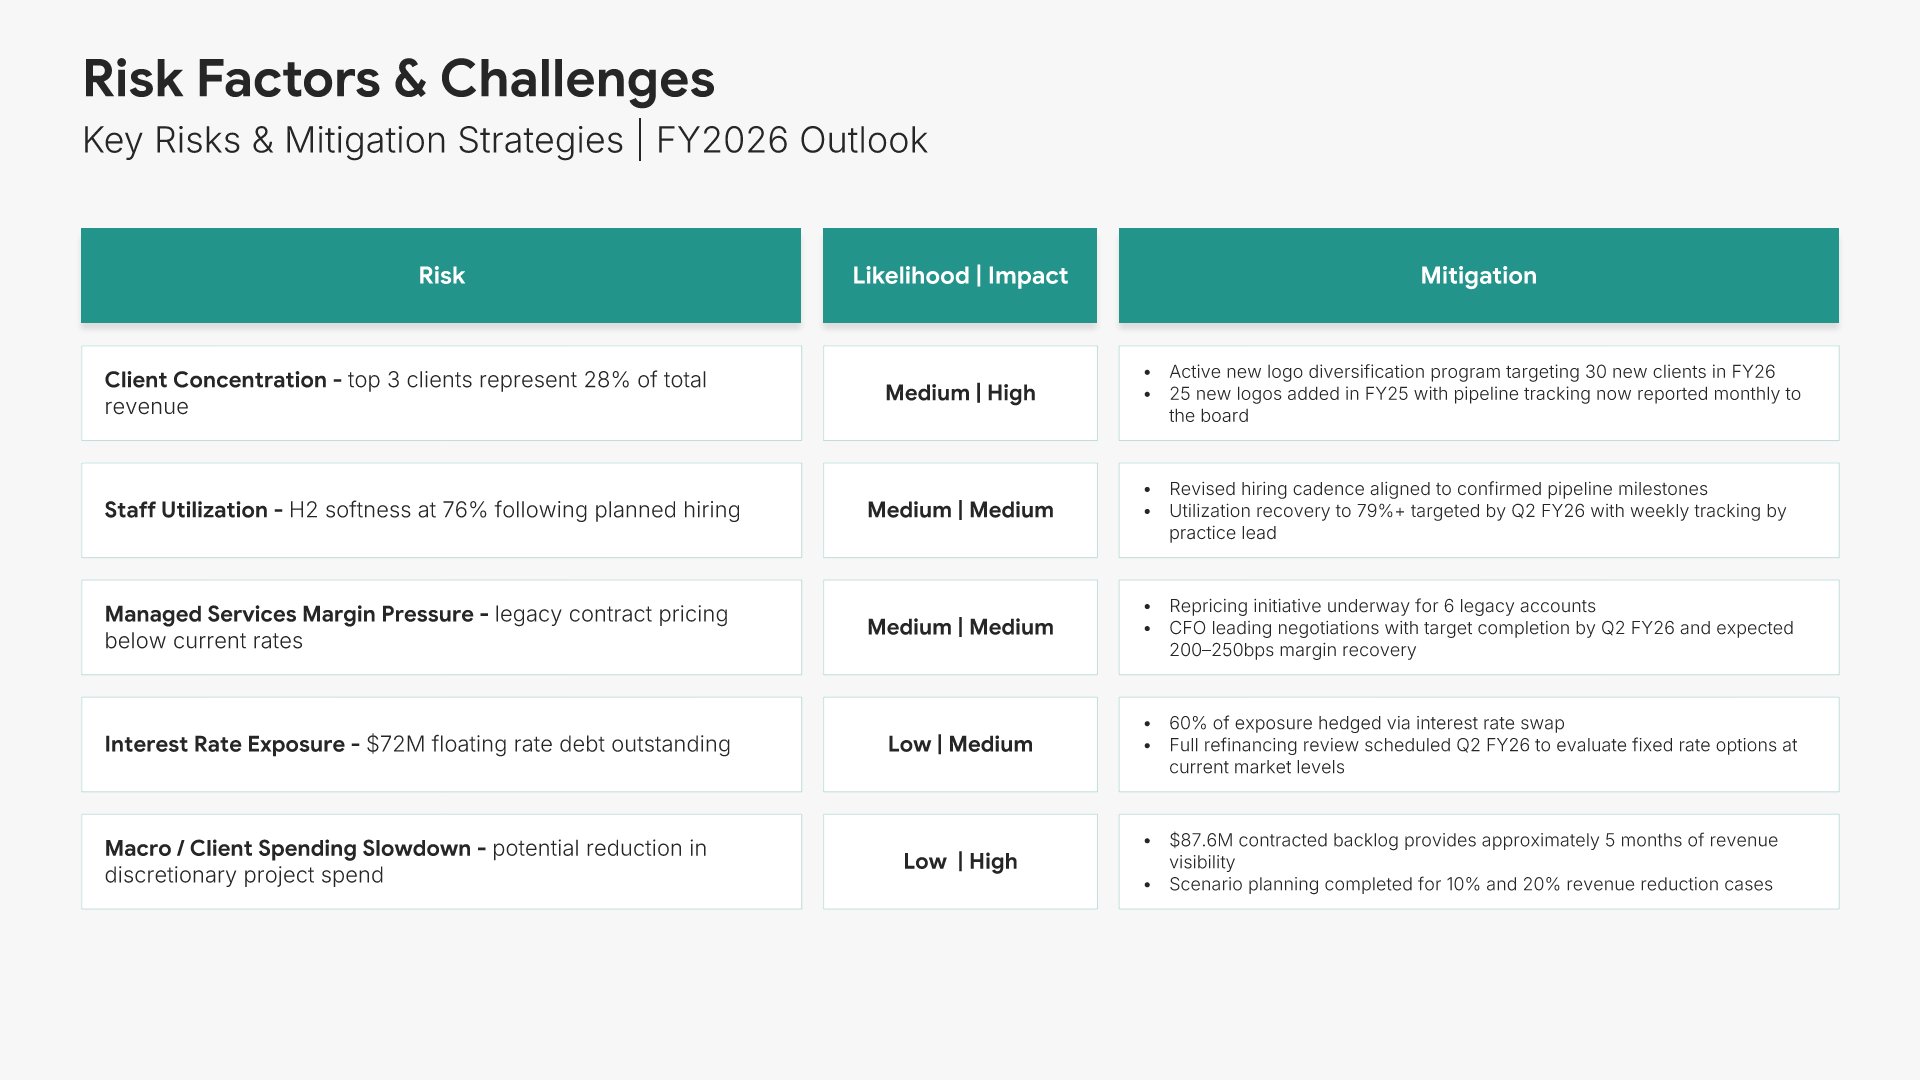
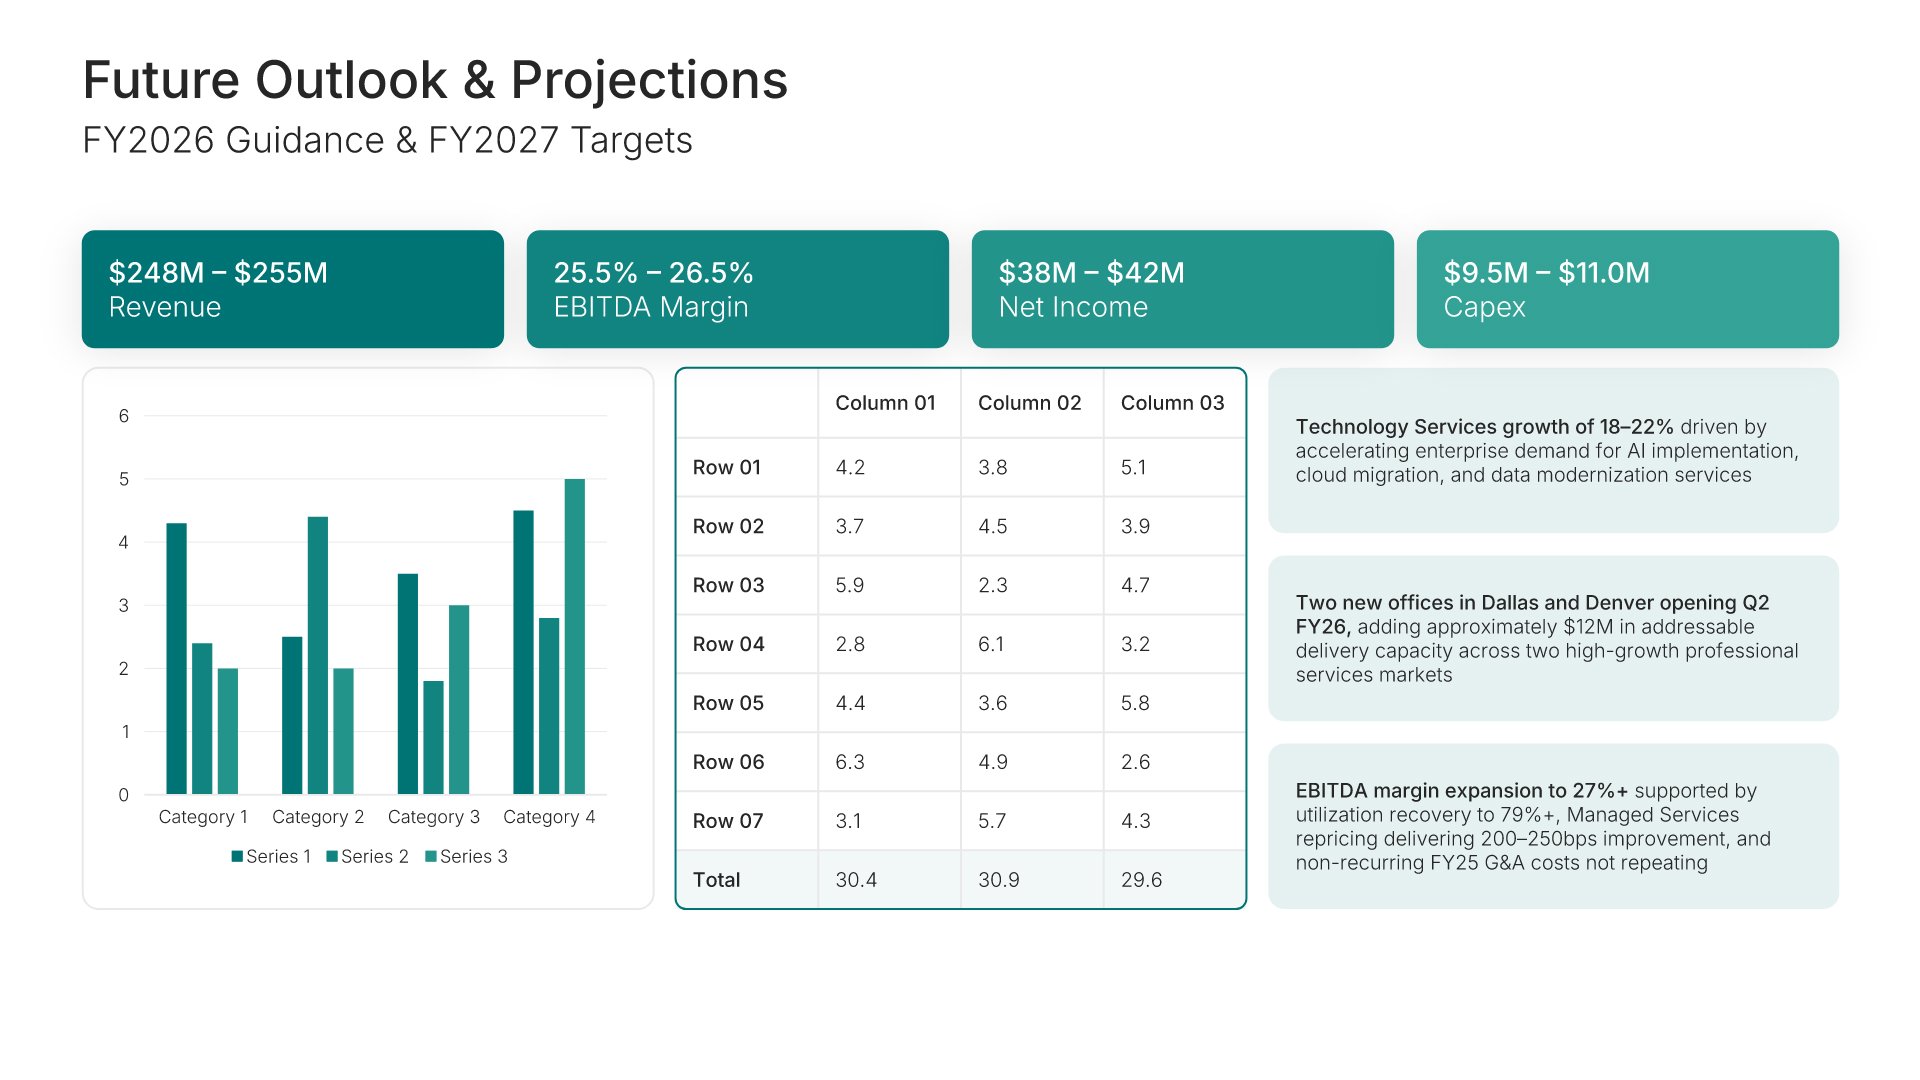
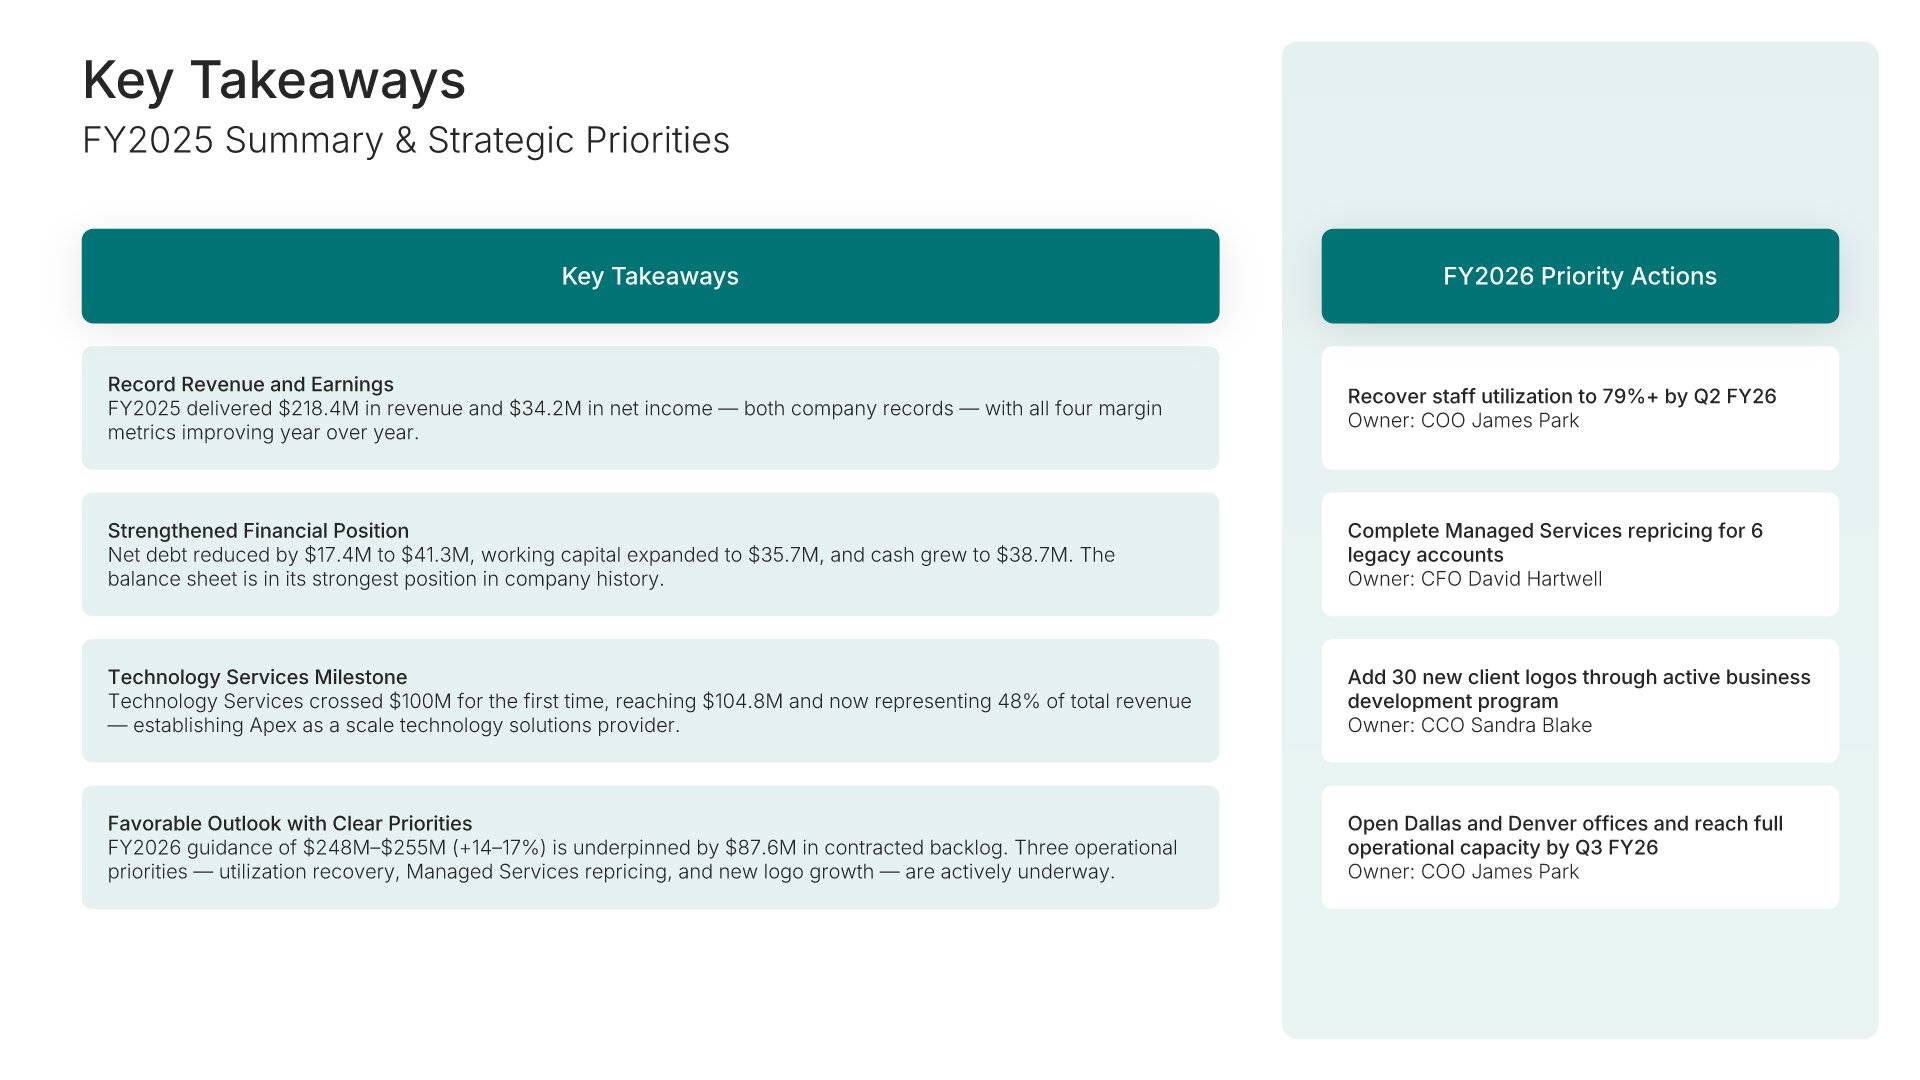
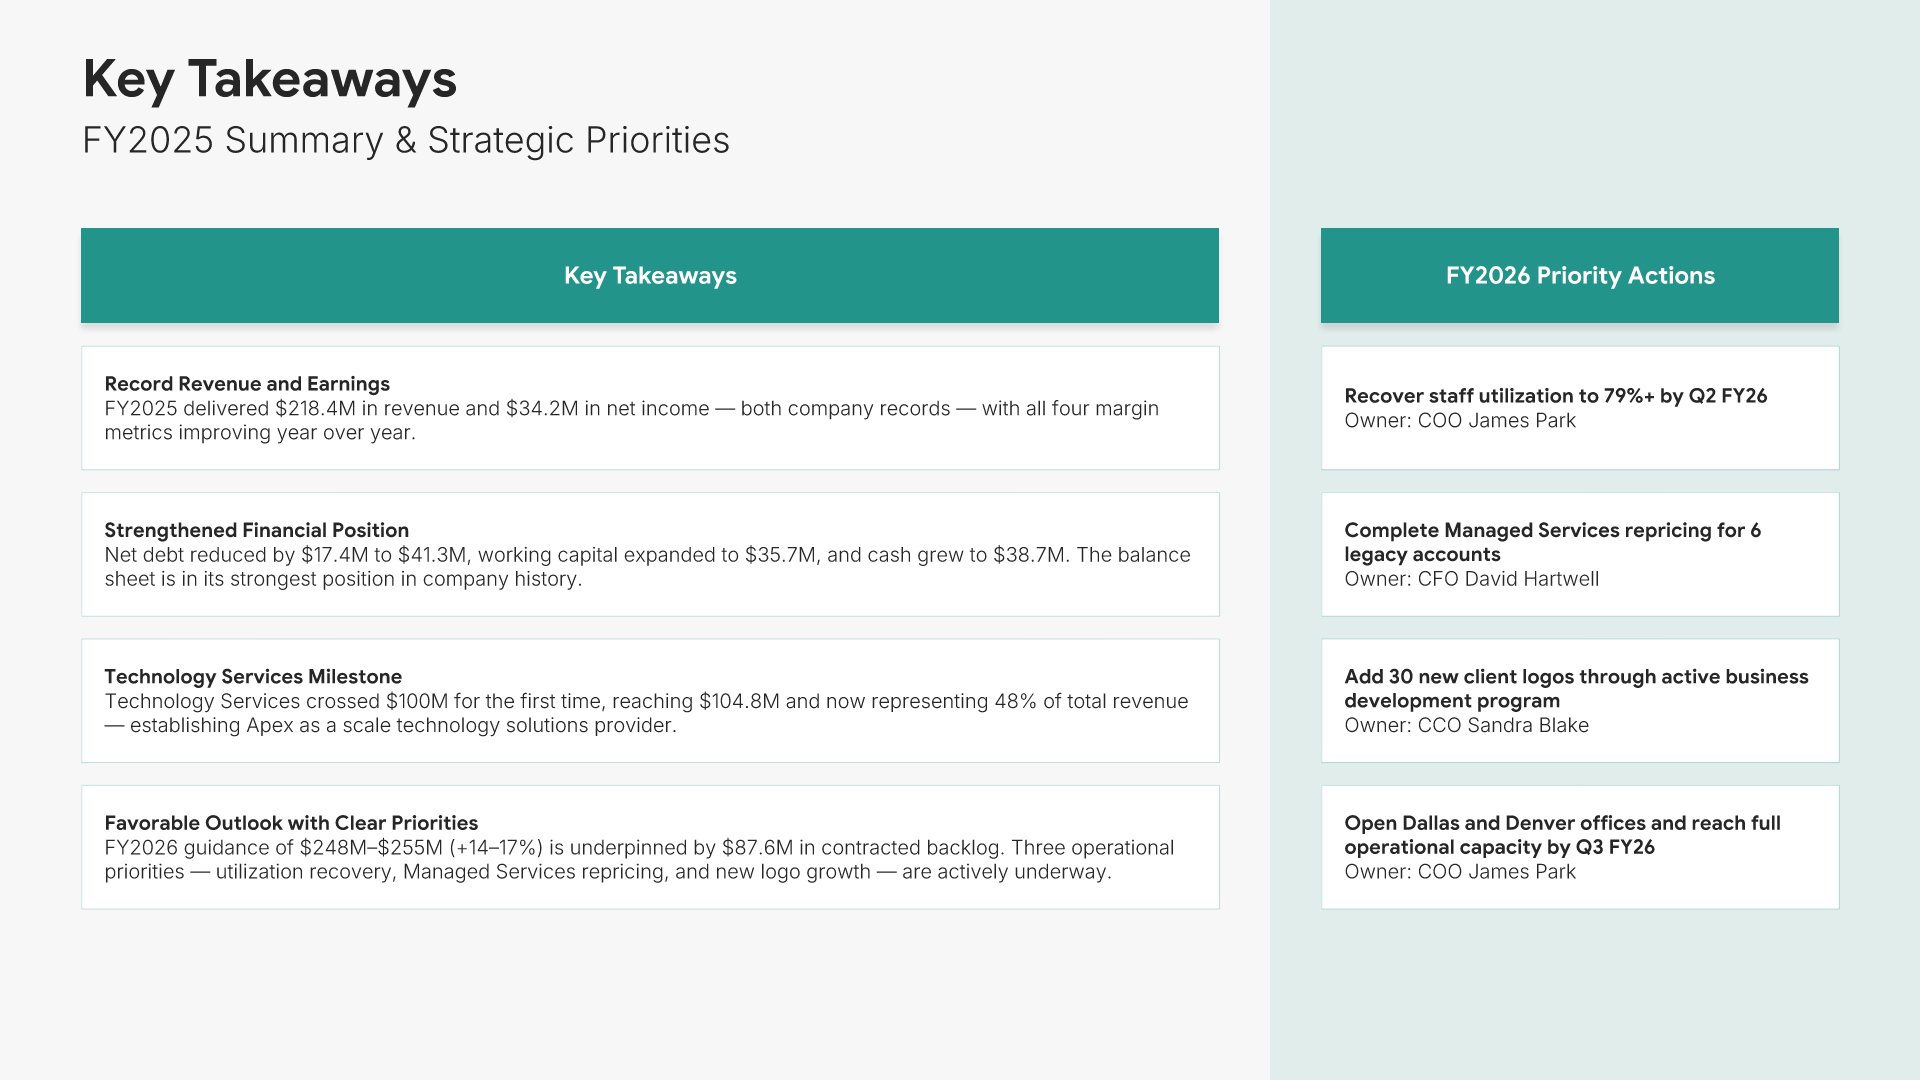
A comprehensive financial report template designed for finance teams presenting full-year results to investors, lenders, and analysts. Built on the Investor/Analyst Model, this presentation covers detailed financial statements, ratio analysis, KPIs, multi-year trends, and outlook. Ideal for annual reports and stakeholder reviews.

Comprehensive Financial Report Featured Image

How to Build a Comprehensive Financial Report Presentation

Learn how to create a comprehensive financial report that gives investors and analysts the complete financial picture. This in-depth guide walks you through detailed statements, ratio analysis, multi-year trends, and forward-looking guidance to deliver the depth and rigor required for full-year reporting and stakeholder reviews.

1. Title

Title slides help you open presentations with impact. Use them to create strong first impressions with opening slides that set the tone, introduce your topic, and establish your brand. Ideal for any presentation where a polished, professional opening slide sets the stage for everything that follows.
Built using Title slides

2. Agenda

Agenda slides help you outline your presentation structure clearly. Use them to show topics, timing, and flow so your audience knows what to expect and can follow along easily. Ideal for meetings, workshops, and any presentation where setting expectations upfront helps your audience stay engaged throughout.
Built using Agenda slides

3. Executive Summary

Executive summary slides help you present key points concisely for busy stakeholders. Use them to distill complex information into clear highlights, recommendations, and conclusions that can be understood at a glance. Ideal for board presentations, project updates, and any situation where decision-makers need the essential takeaways fast.
Built using Executive Summary slides

4. Financial Performance Overview

Financial performance overview slides help you summarize key financial results at a glance. Use them to present top-line metrics like revenue, profit, and growth in a clear dashboard format. Ideal for annual reports and investor presentations where stakeholders need a quick snapshot of financial health.
Built using Charts slides

5. Revenue Analysis

Revenue analysis slides help you break down income sources and growth drivers. Use them to present revenue by segment, geography, product line, or customer type. Ideal for annual reports and financial reviews where understanding where revenue comes from helps stakeholders assess business performance.
Built using KPI Dashboard slides

6. Expense Analysis

Expense analysis slides help you break down costs and spending patterns. Use them to present operating expenses by category, department, or function with trends and comparisons. Ideal for financial reports and budget reviews where understanding cost structure helps stakeholders evaluate operational efficiency and management.
Built using Charts slides

7. Income Statement

Income statement slides help you present revenue, expenses, and profitability in a clear format. Use them to display your profit and loss summary with key line items and period comparisons. Ideal for financial reports and earnings presentations where stakeholders need to understand how the business performed during the period.
Built using Financial Table slides

8. Balance Sheet

Balance sheet slides help you present your organization's financial position at a point in time. Use them to display assets, liabilities, and shareholders' equity in a clear, organized format. Ideal for financial reports, investor presentations, and board meetings where stakeholders need to understand your financial standing and capital structure.
Built using Financial Table slides

9. Cash Flow Statement

Cash flow statement slides help you show how money moves through your organization. Use them to present operating, investing, and financing activities in a clear format. Ideal for financial reports and investor presentations where demonstrating cash generation and management builds stakeholder confidence in liquidity.
Built using Financial Table slides

10. Working Capital Analysis

Working capital analysis slides help you present your short-term financial health. Use them to display current ratio, quick ratio, cash conversion cycle, and liquidity metrics. Ideal for financial reports and board presentations where demonstrating operational efficiency and ability to meet obligations matters to stakeholders.
Built using KPI Dashboard slides

11. Profitability Metrics

Profitability metrics slides help you present your bottom-line performance clearly. Use them to display gross margin, operating margin, EBITDA, and net income with trends and benchmarks. Ideal for financial reports and investor presentations where demonstrating profitability and efficiency builds confidence in management.
Built using Charts slides

12. Profitability Ratios

Profitability ratios slides help you present detailed measures of financial performance and earnings quality. Use them to display return on equity, return on assets, return on invested capital, and other ratios that benchmark profitability. Detailed profitability ratios help analysts evaluate efficiency and value creation against peers.
Built using Charts slides

13. Liquidity & Efficiency Ratios

Liquidity and efficiency ratios slides help you present how well your organization manages working capital and assets. Use them to display current ratio, quick ratio, asset turnover, and inventory turnover metrics. Detailed liquidity and efficiency ratios help analysts evaluate operational health and resource utilization.
Built using KPI Dashboard slides

14. Debt & Leverage Ratios

Debt and leverage ratios slides help you present how your organization is capitalized and the strength of its debt position. Use them to display debt-to-equity, interest coverage, debt-to-EBITDA, and debt maturity schedules. Detailed leverage ratios help analysts and lenders evaluate financial risk and covenant compliance.
Built using Charts slides

15. Key Performance Indicators

Key performance indicators slides help you define the metrics that measure success. Use them to present the KPIs that track progress toward your strategic goals, including targets, benchmarks, and measurement frequency. Ideal for strategic plans and business reviews where clear metrics ensure accountability and keep execution on track.
Built using Simple Numbers slides

16. Budget vs. Actual Analysis

Budget vs. actual analysis slides help you compare planned performance against real results. Use them to display variances, explain deviations, and show how well forecasts aligned with outcomes. Ideal for financial reports and board presentations where demonstrating fiscal discipline and forecast accuracy builds credibility.
Built using Financial Table slides

17. Multi-Year Trends

Multi-year trends slides help you present how your financial performance has evolved over multiple periods. Use them to display historical revenue, profitability, and balance sheet trends across three or more years. A clear view of multi-year trends gives stakeholders the historical perspective needed to evaluate trajectory and consistency.
Built using Financial Table slides

18. Risk Factors & Challenges

Risk factors slides help you identify financial and operational challenges facing the business. Use them to present key risks, their potential impact, and mitigation strategies in place. Ideal for financial reports and investor presentations where transparent risk disclosure demonstrates responsible governance and planning.
Built using Matrix (3×3) slides

19. Future Outlook

Future outlook slides help you share expectations and guidance for upcoming periods. Use them to present forecasts, targets, strategic priorities, and key assumptions. Ideal for financial reports and investor presentations where forward-looking statements help stakeholders understand your trajectory and growth potential.
Built using KPI Dashboard slides

20. Key Takeaways

Key takeaways slides help you summarize the lessons learned and insights from your engagement. Use them to present what worked, what you learned, and how prospects can apply these insights. Sharing strategic lessons positions you as a thought leader and trusted advisor who adds value beyond the immediate project.
Built using One Pager / Snapshot slides

21. Thank You

Thank you slides help you close presentations professionally. Use them to end with gratitude, provide contact information, and leave a polished final impression. Ideal for any presentation where a professional closing reinforces your message and gives your audience a clear way to follow up or stay connected.
Built using Thank You slides

Build your Comprehensive Financial Report presentation with Choladeck

Transform your Comprehensive Financial Report vision into reality with Choladeck’s user-friendly platform. Follow our step-by-step guide, harnessing our vast collection of slides and tools, to create a compelling and cohesive presentation that resonates with your audience.

Step 1

Browse & Select

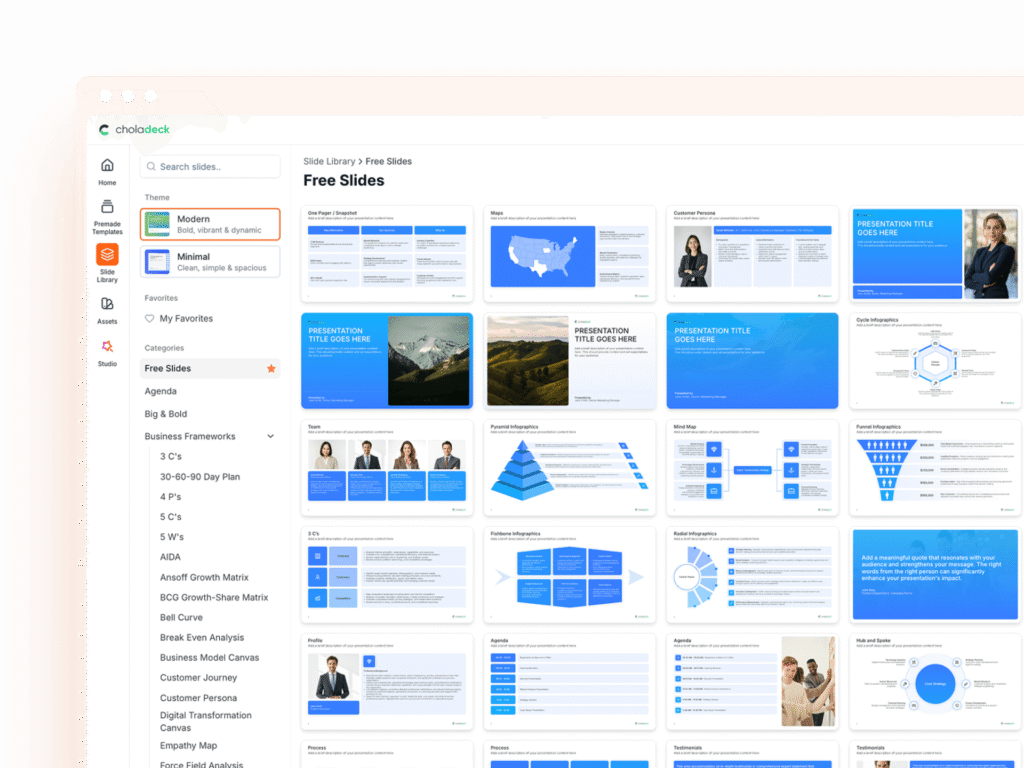
Explore over 9,172+ professionally designed slides across 134 categories. Or if you want a head start, pick from 74+ premade presentation templates. Whatever you need, it's probably already here.

Step 2

Customize Your Slides

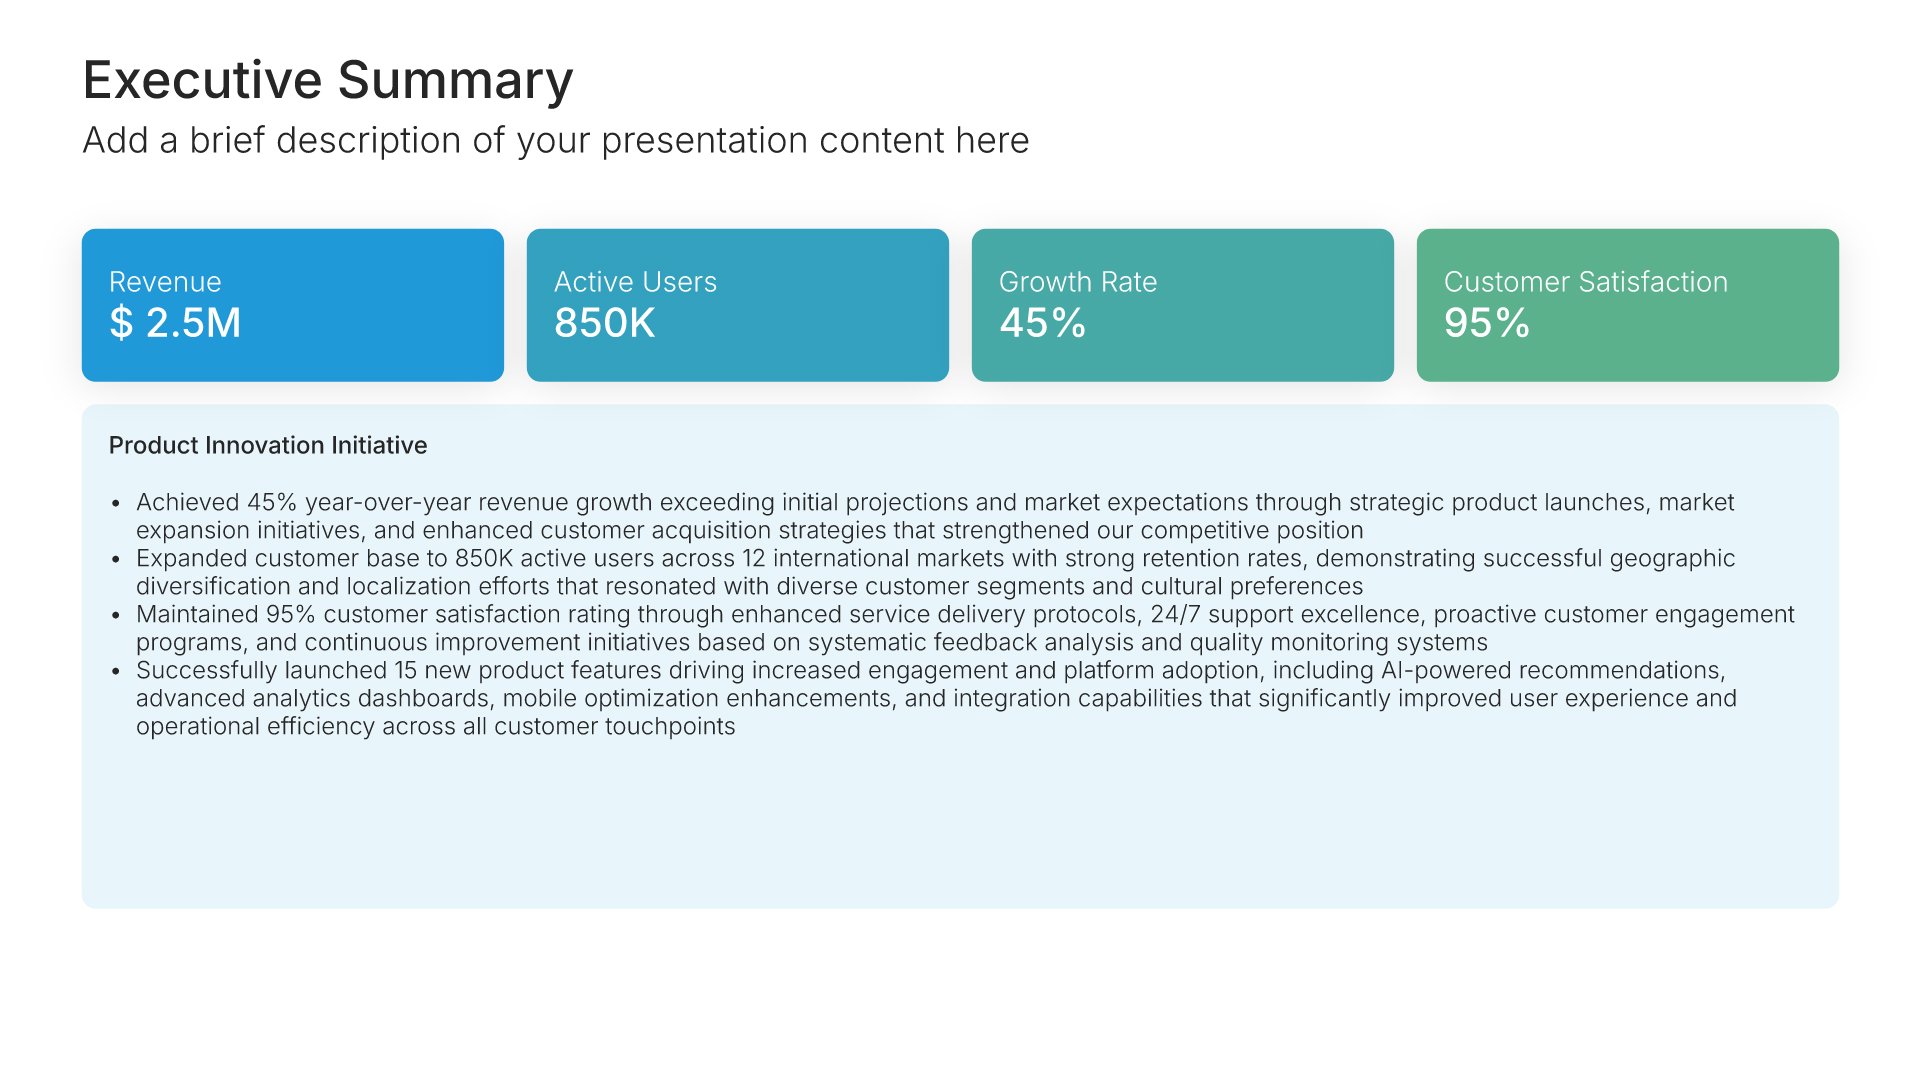
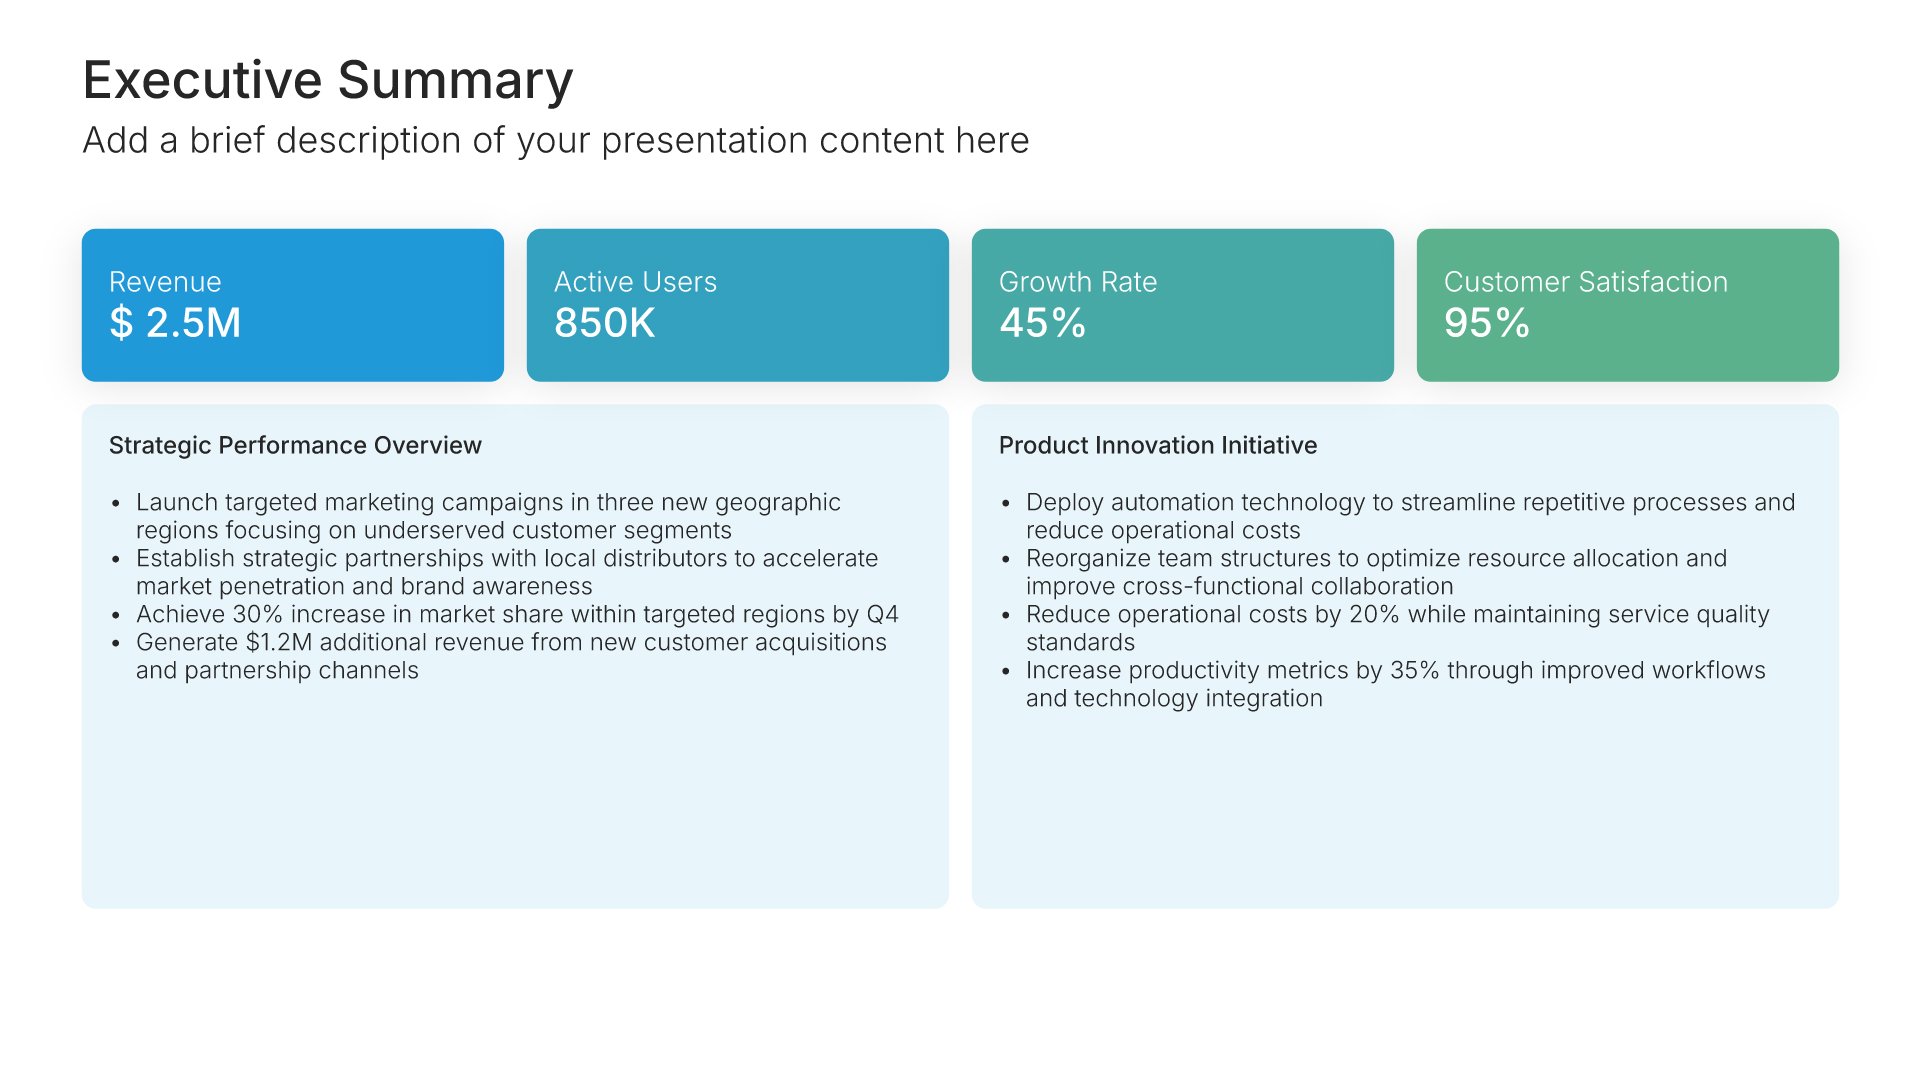
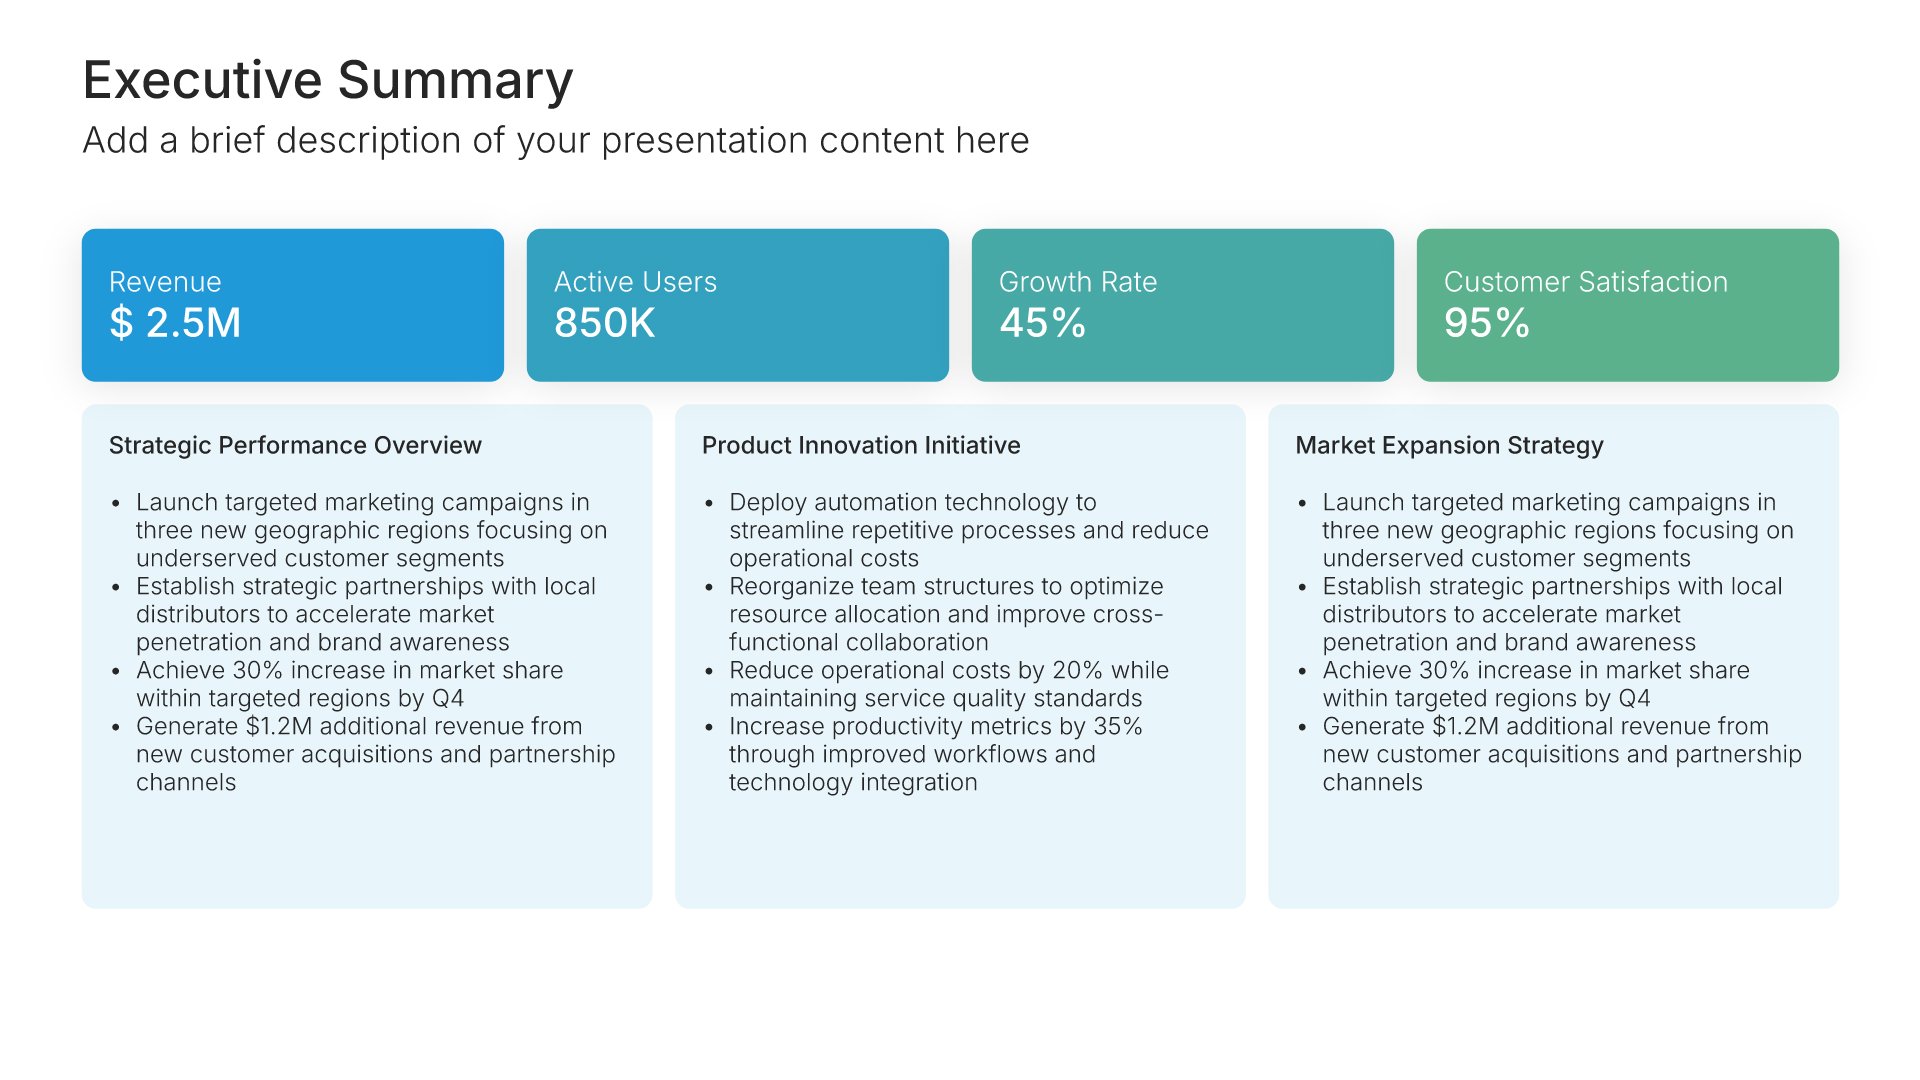
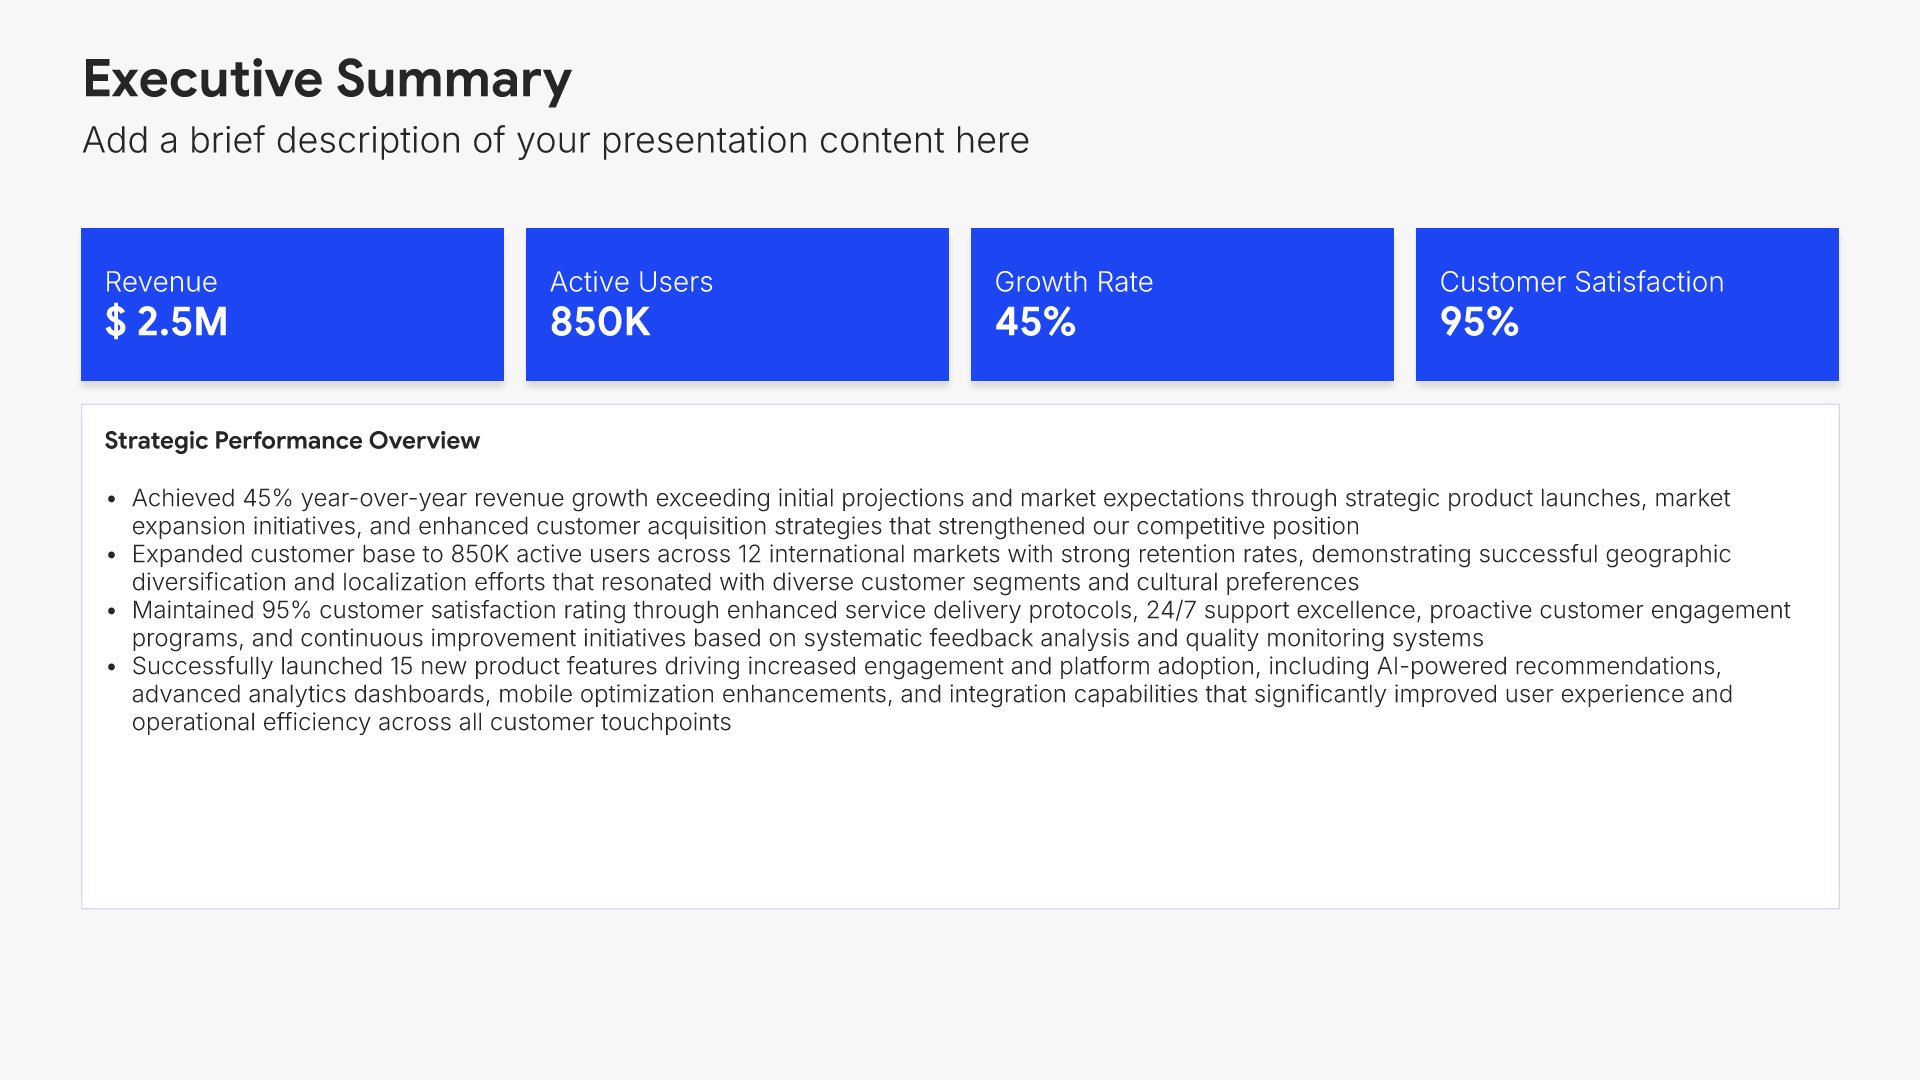
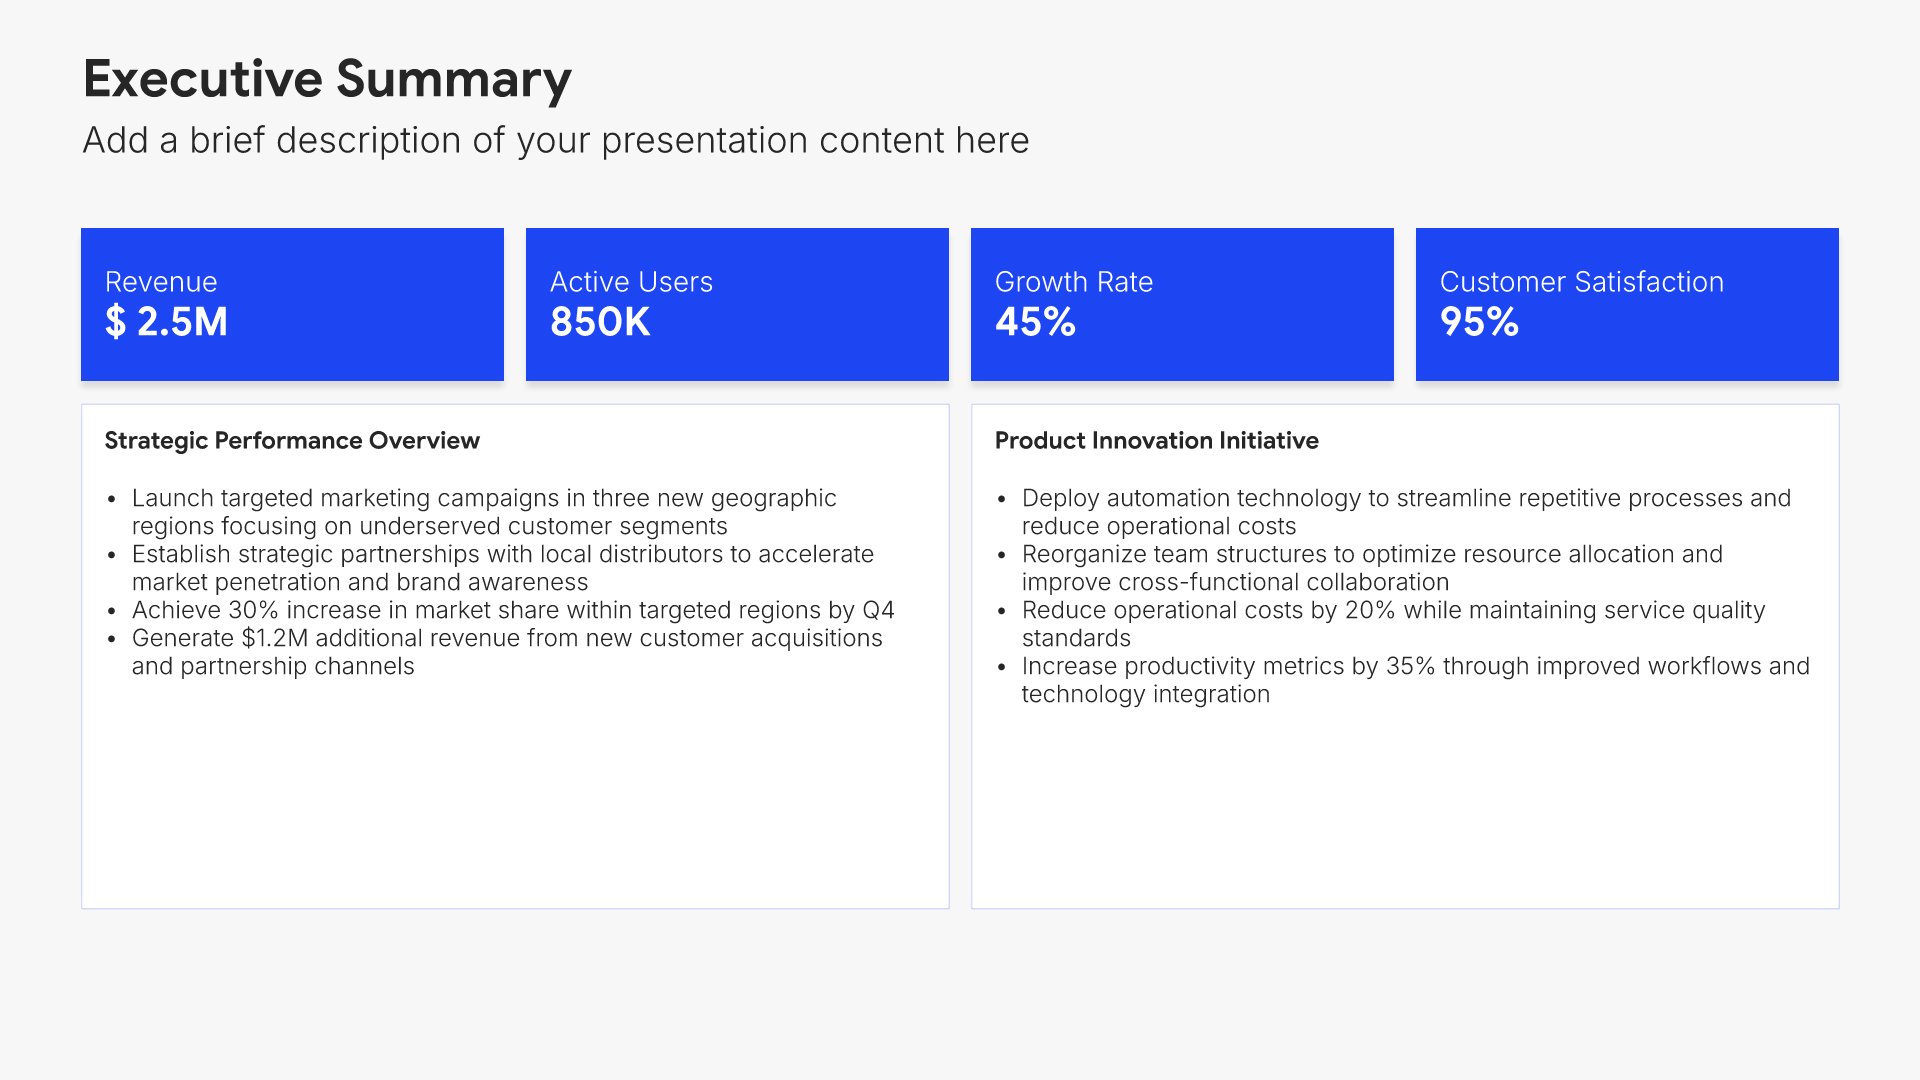
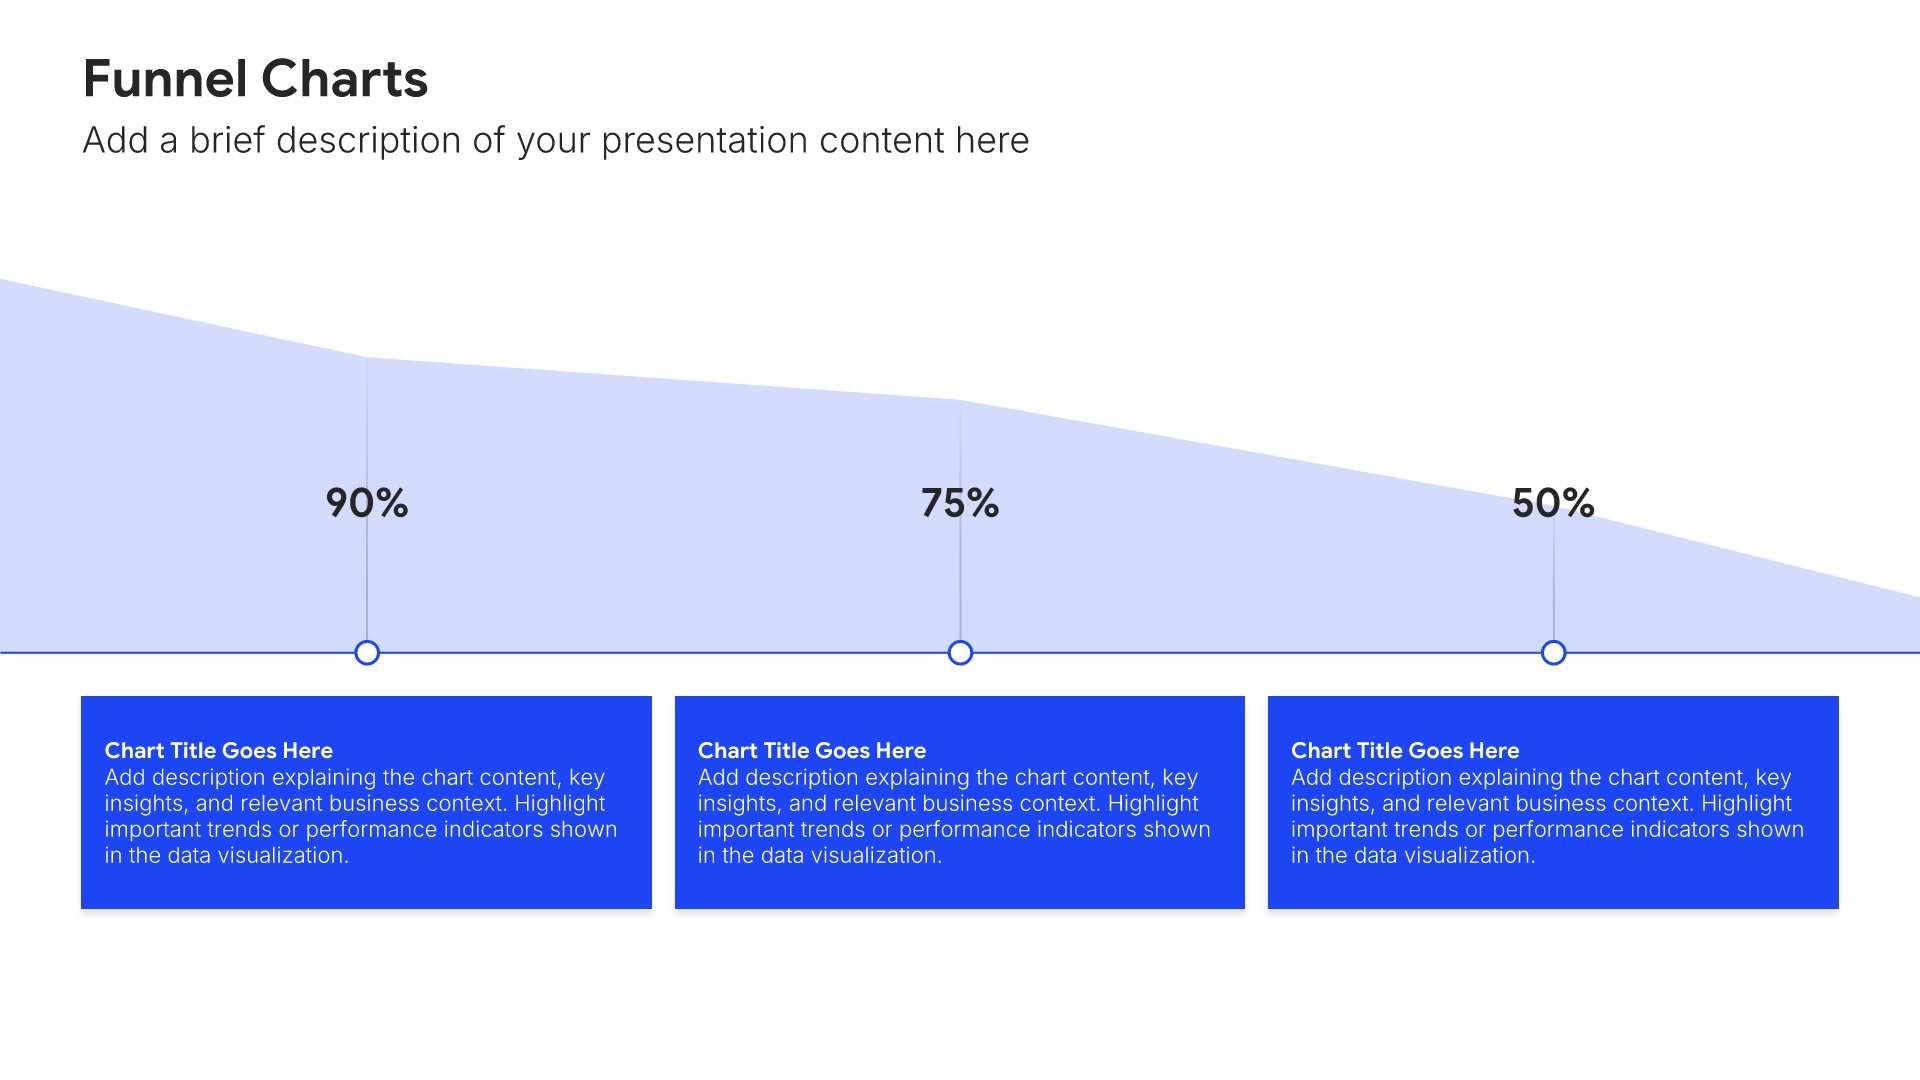
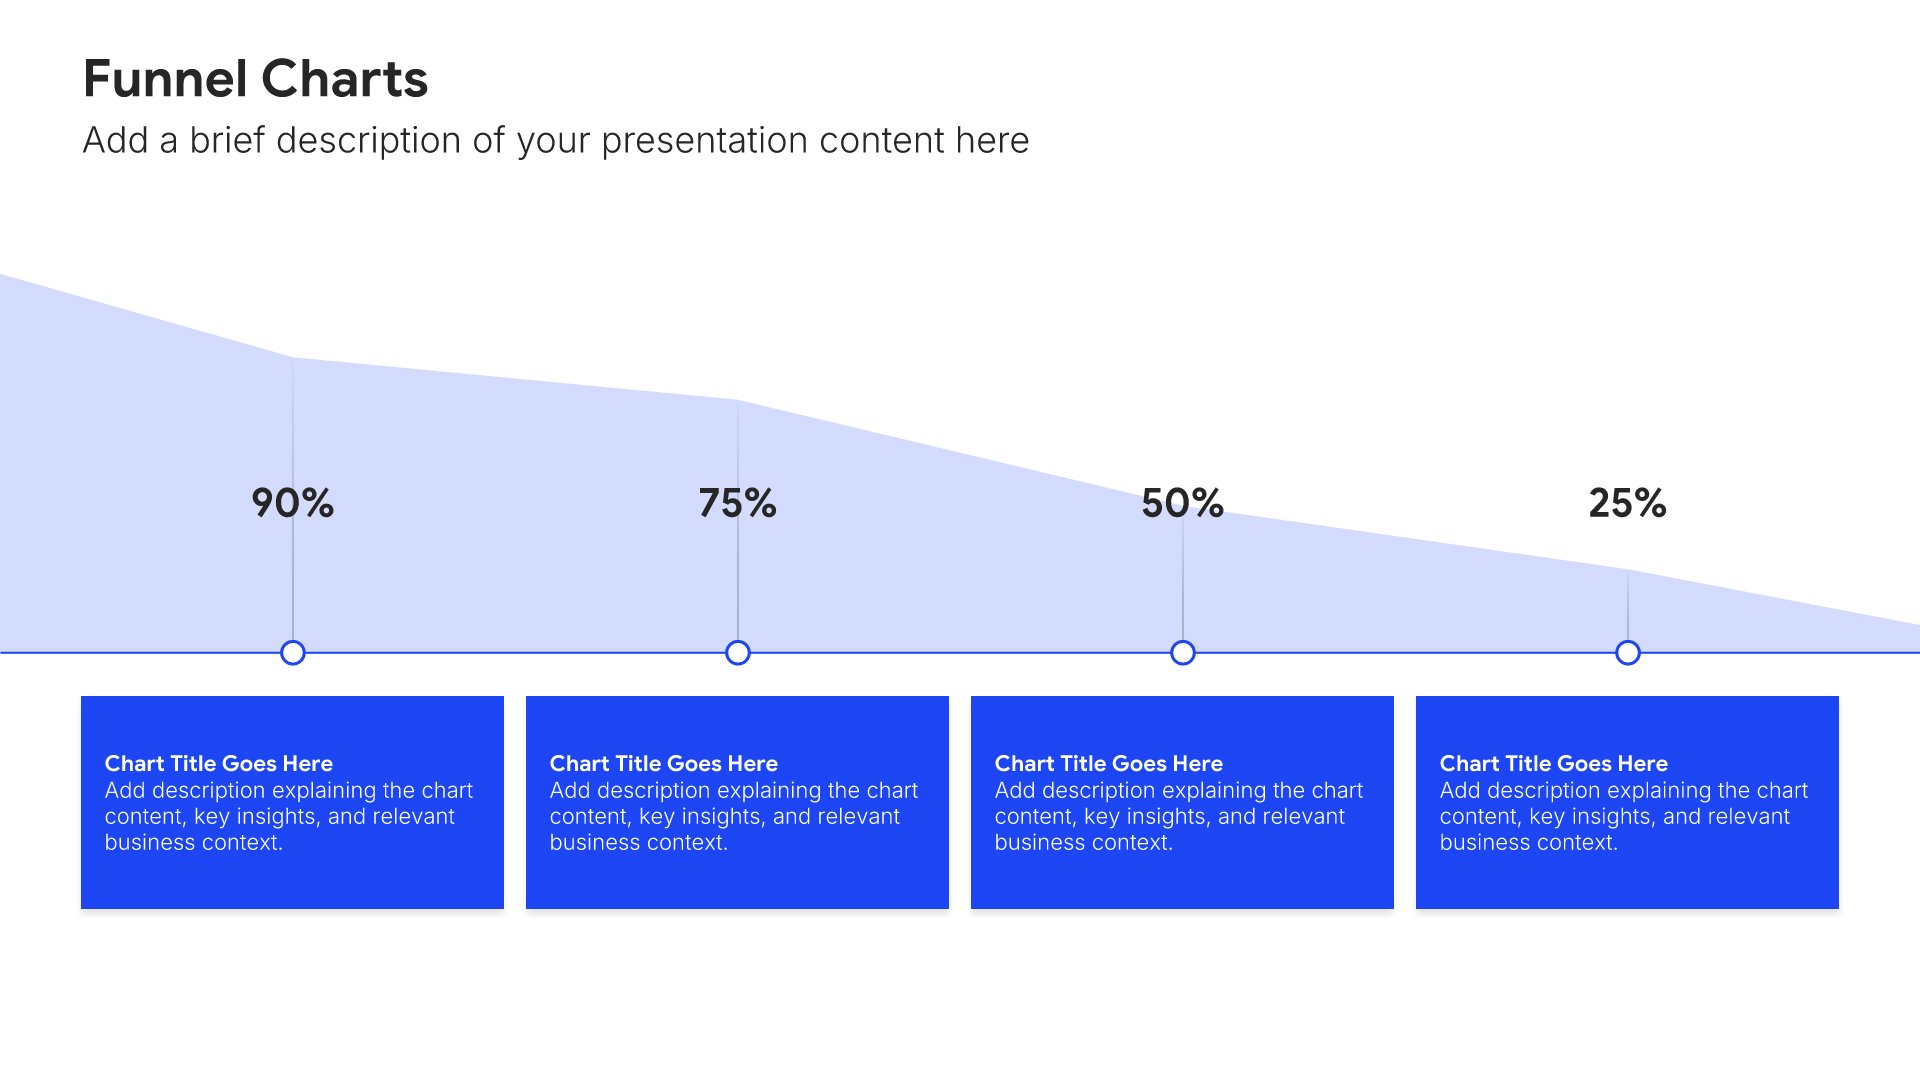
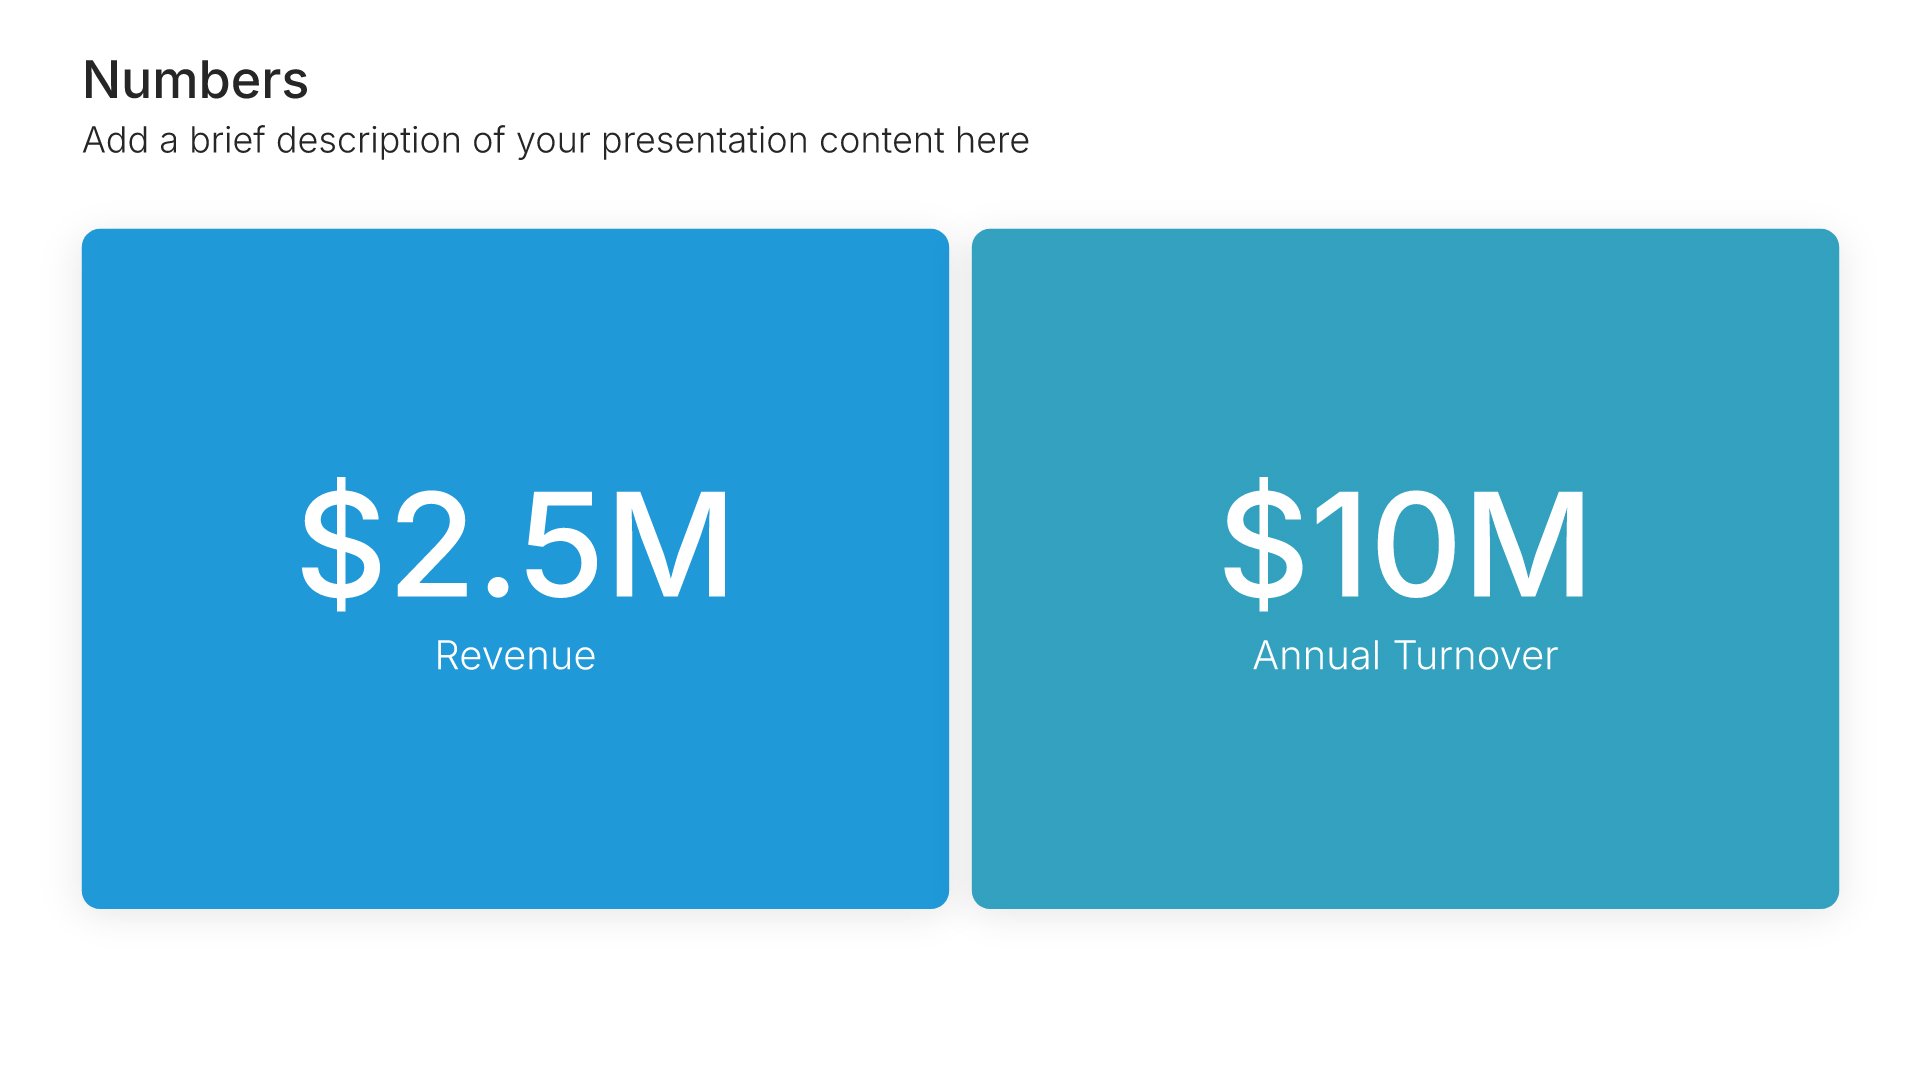
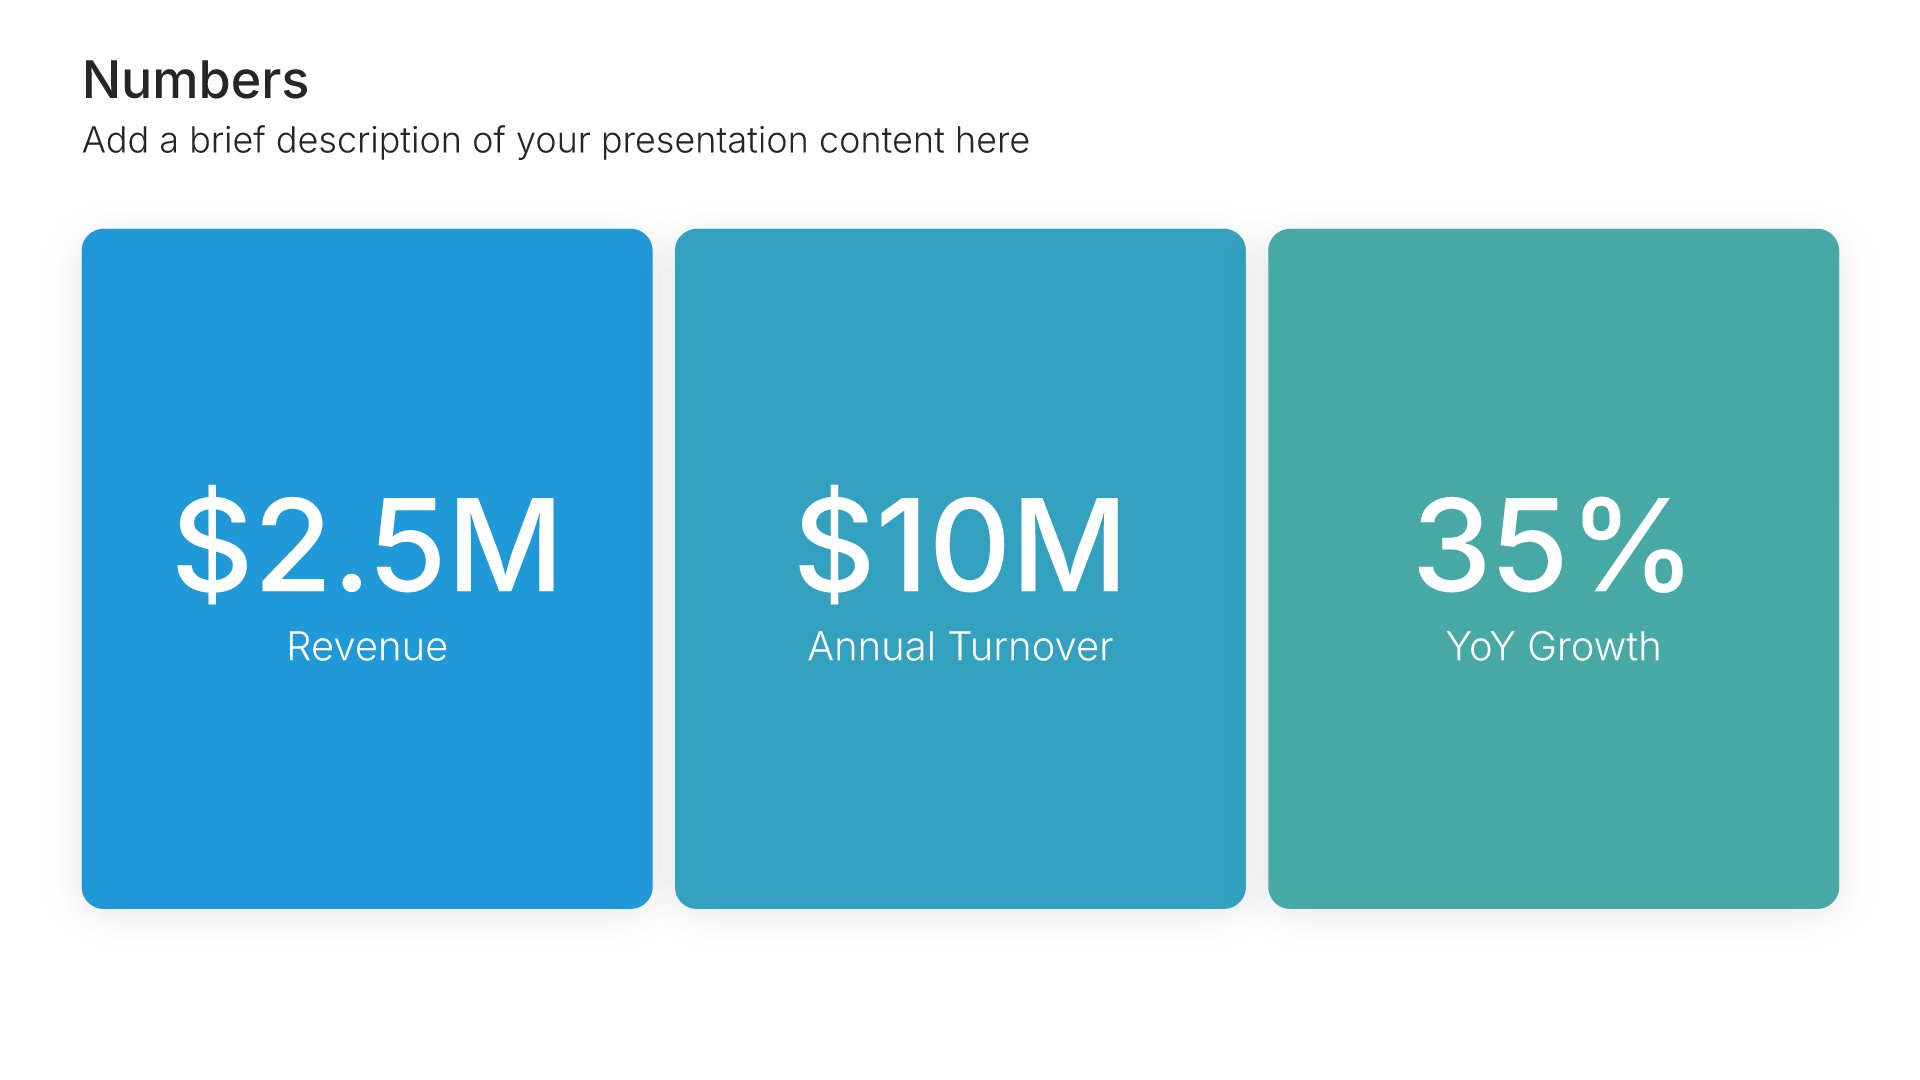
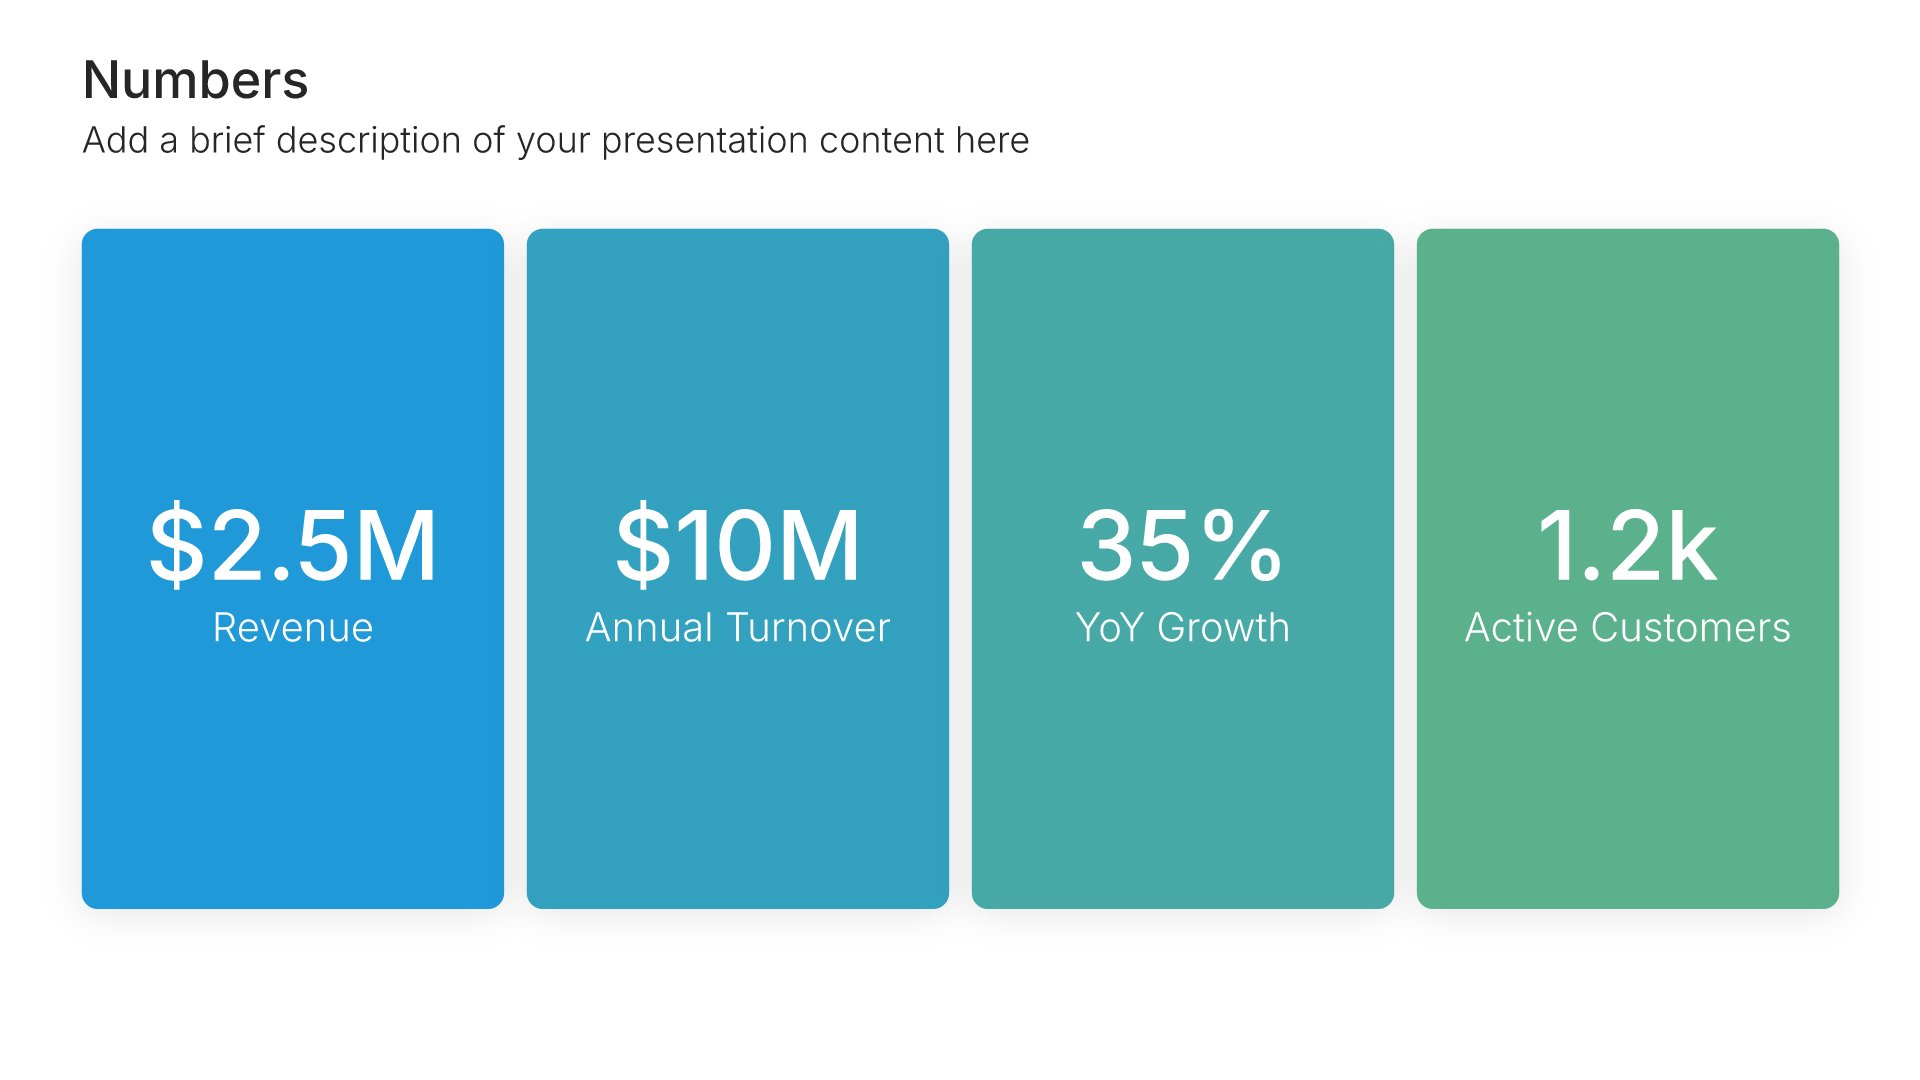
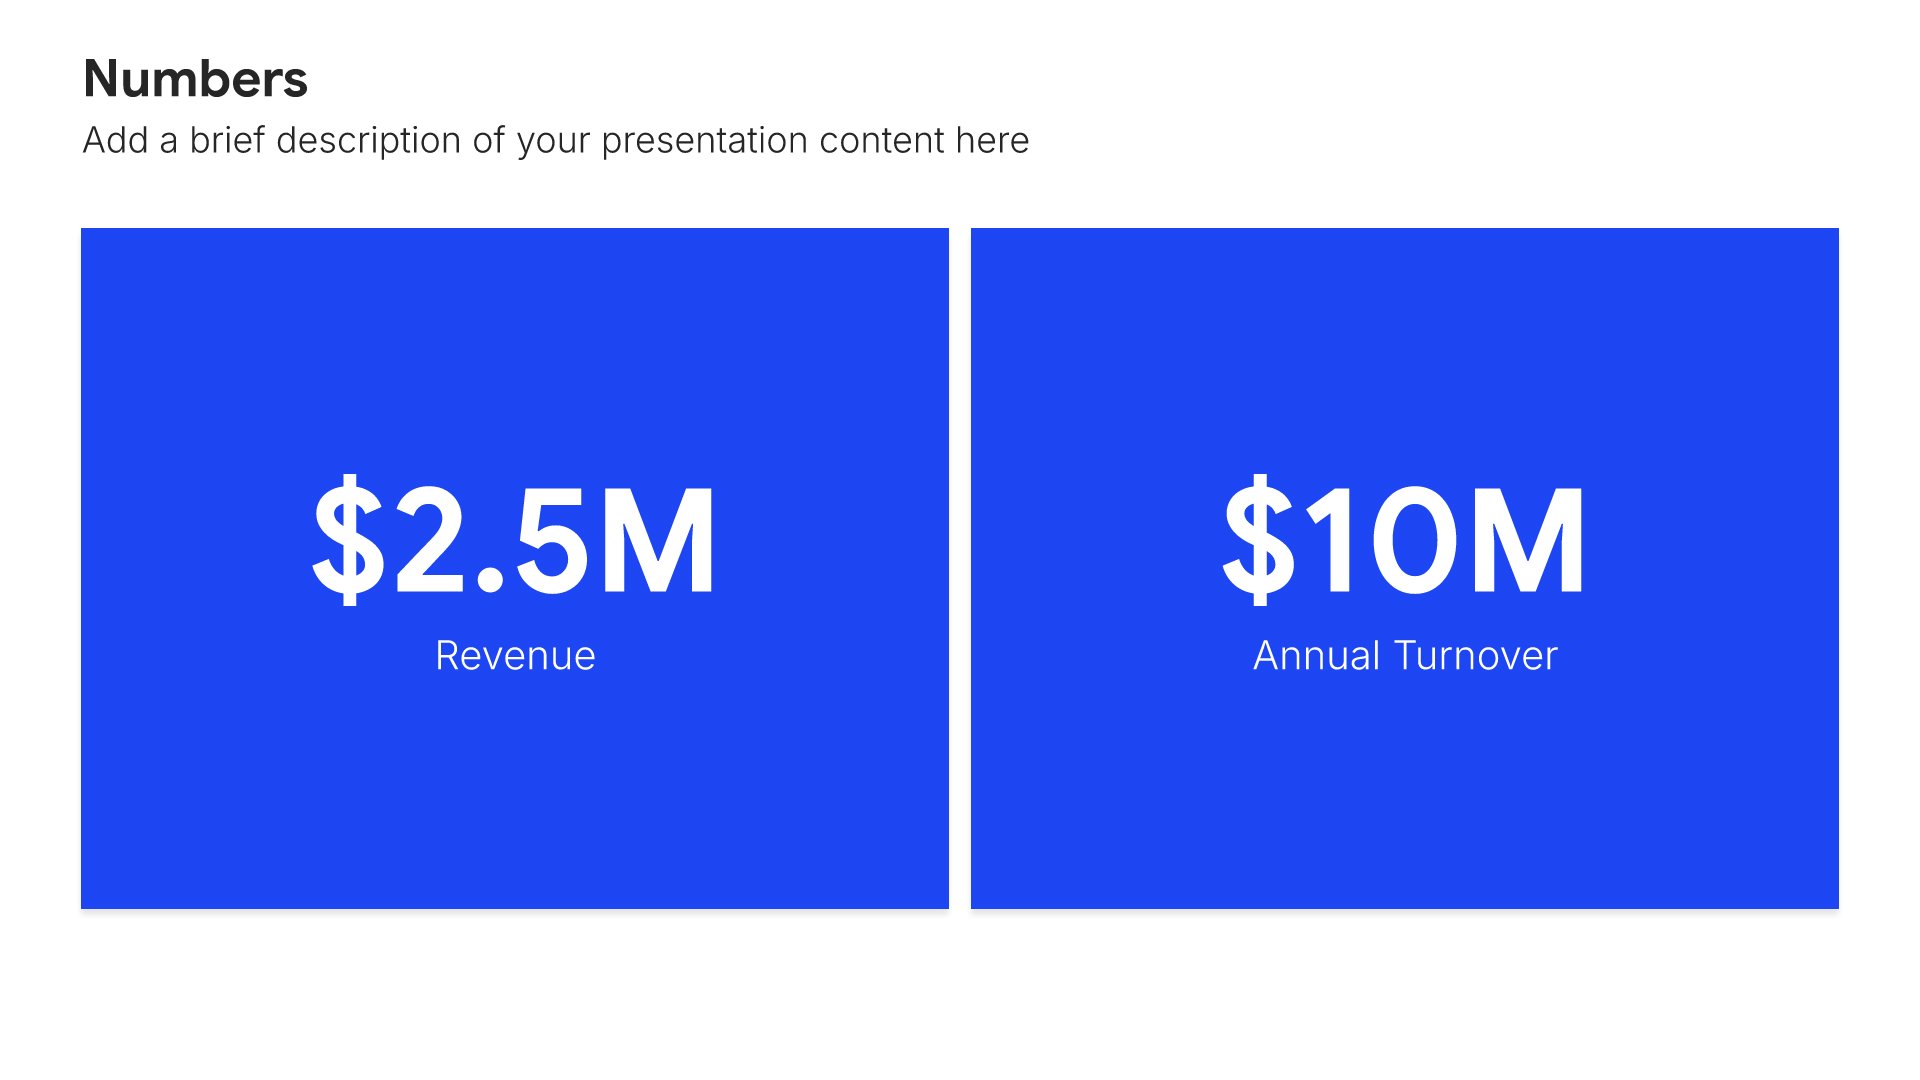
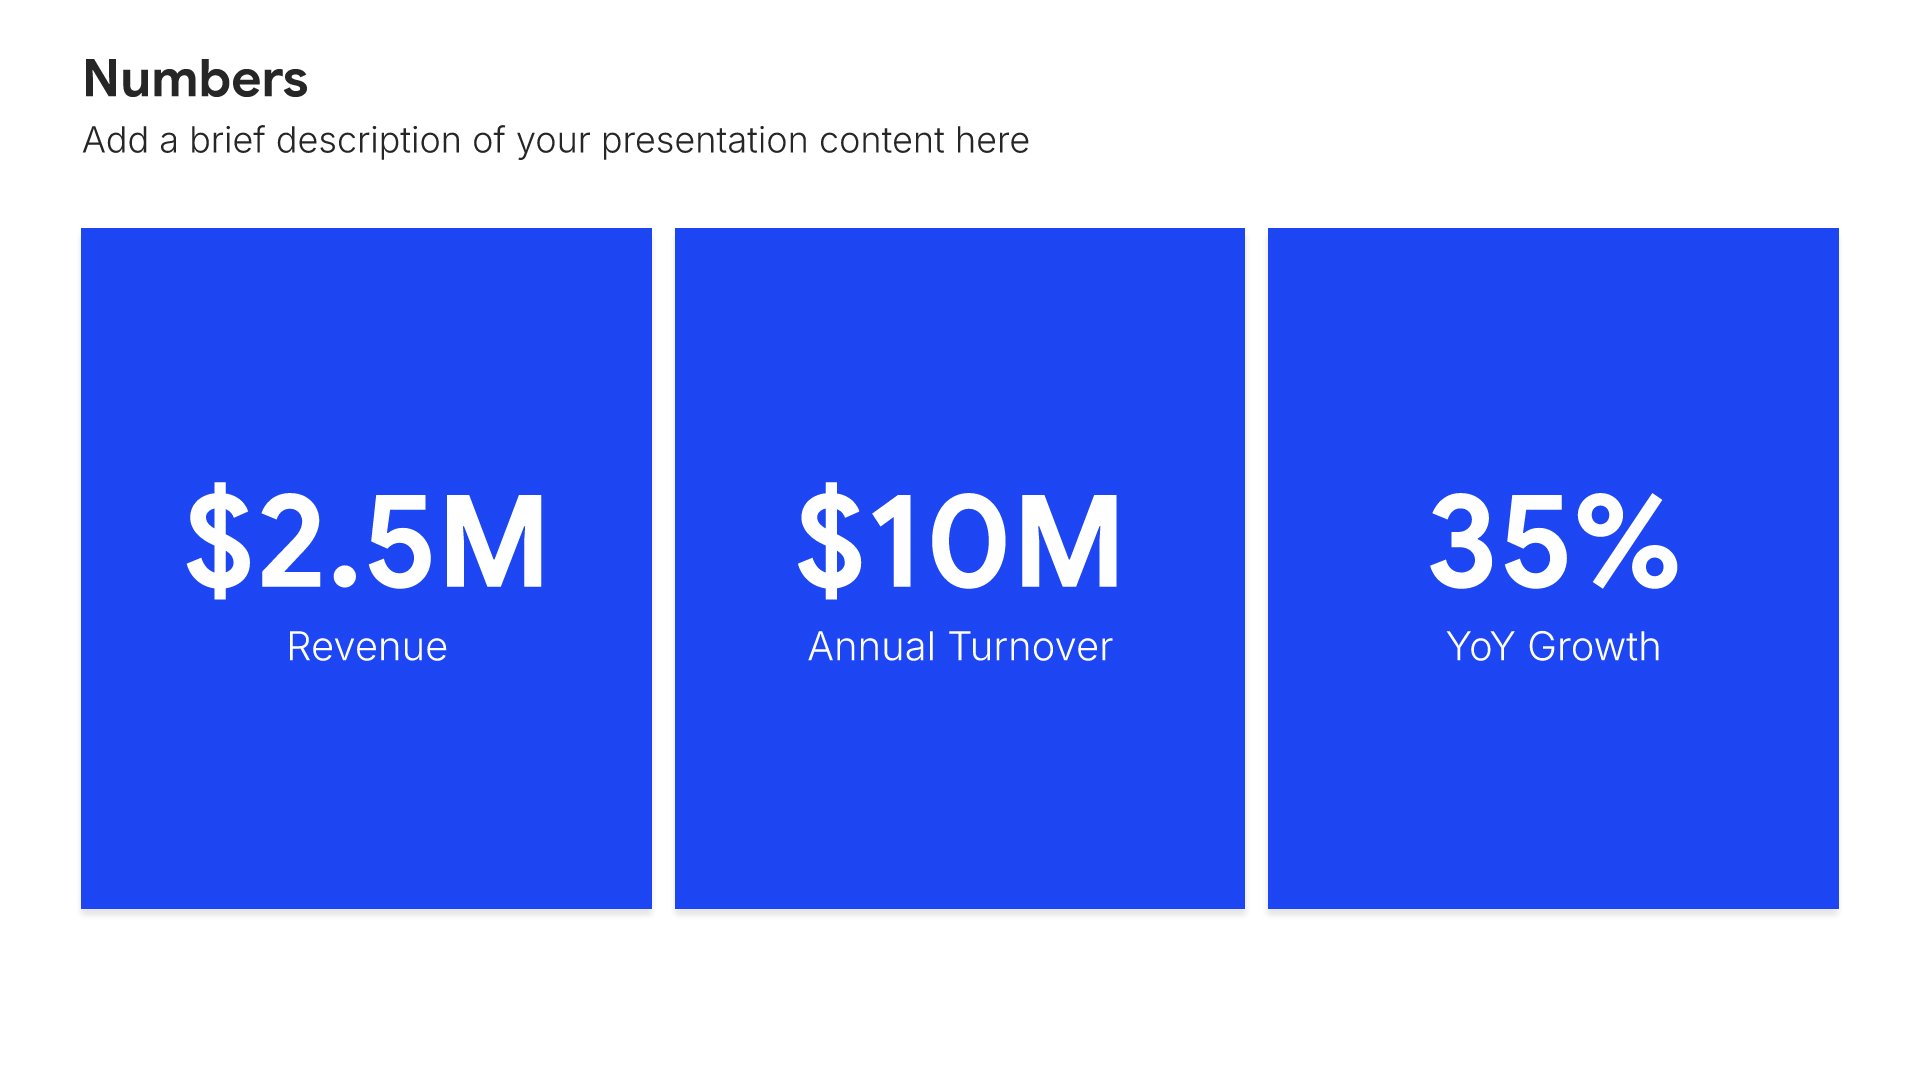
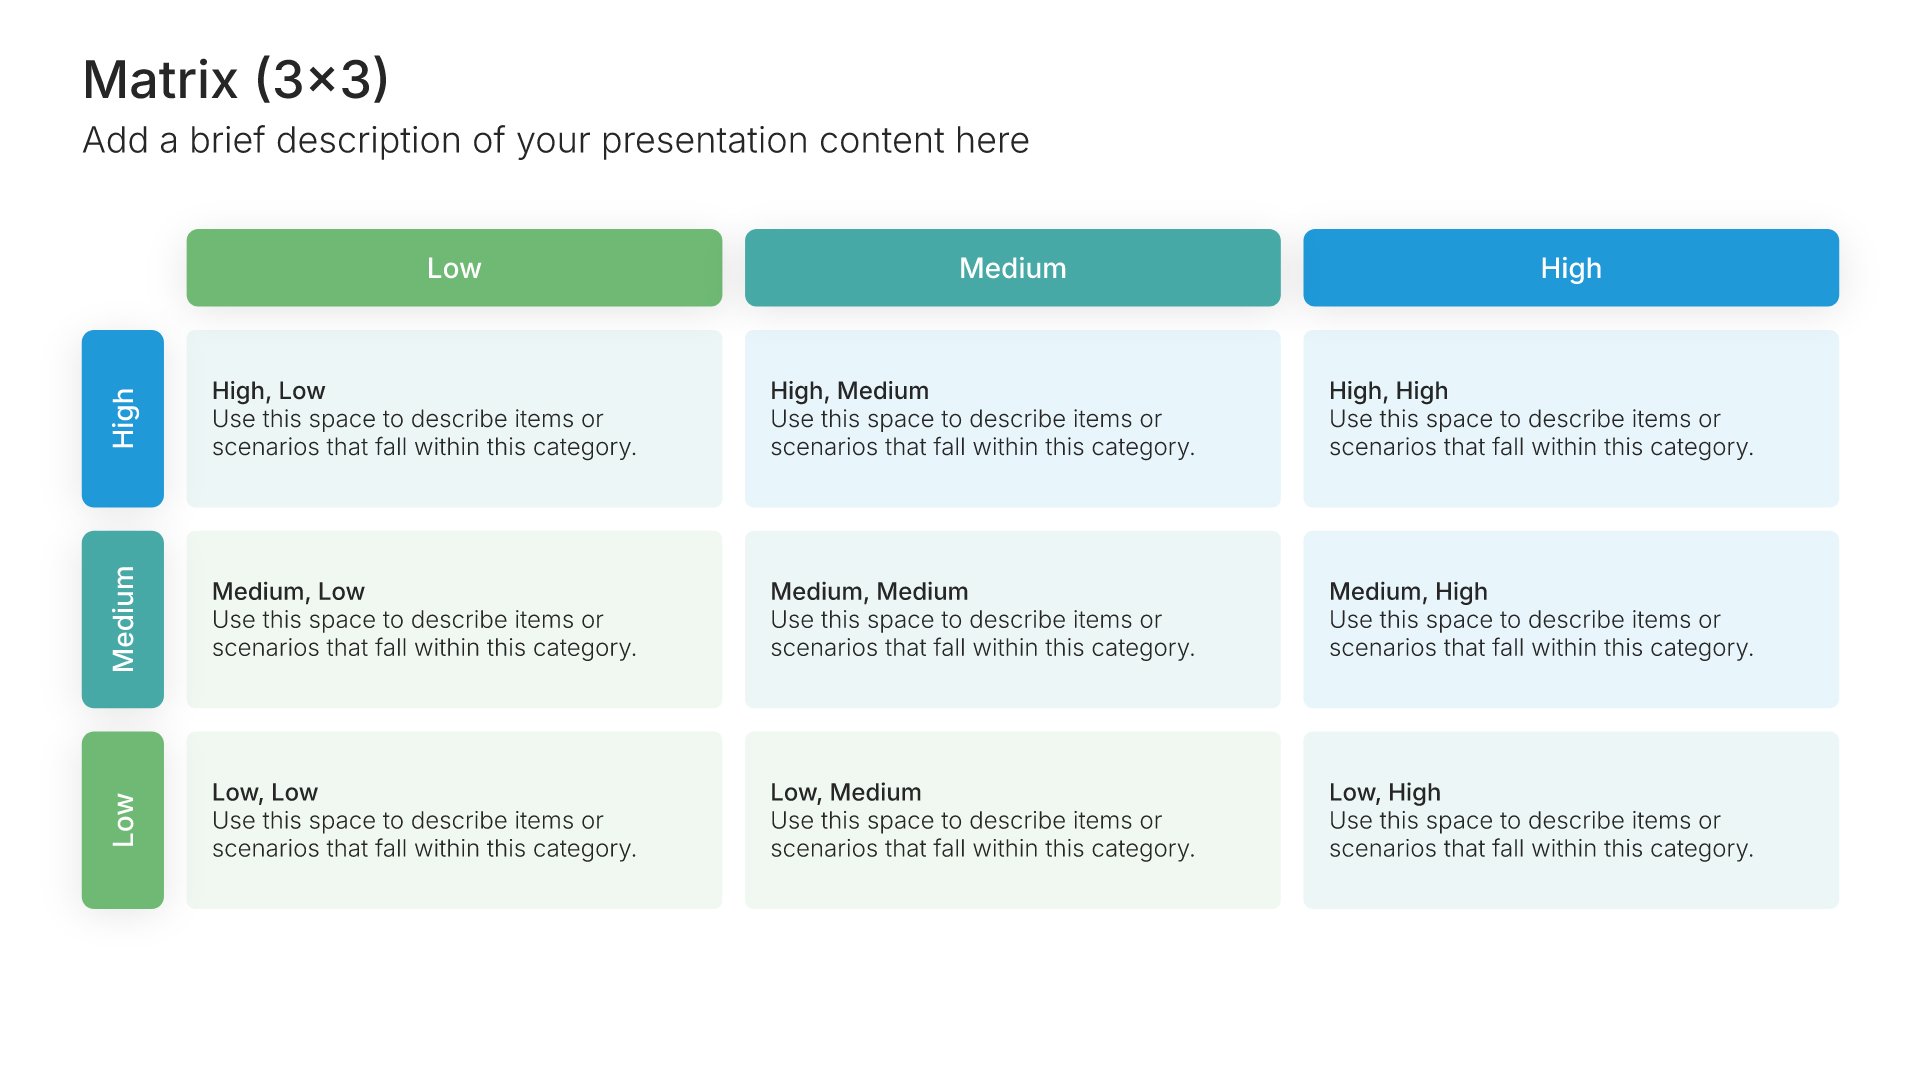
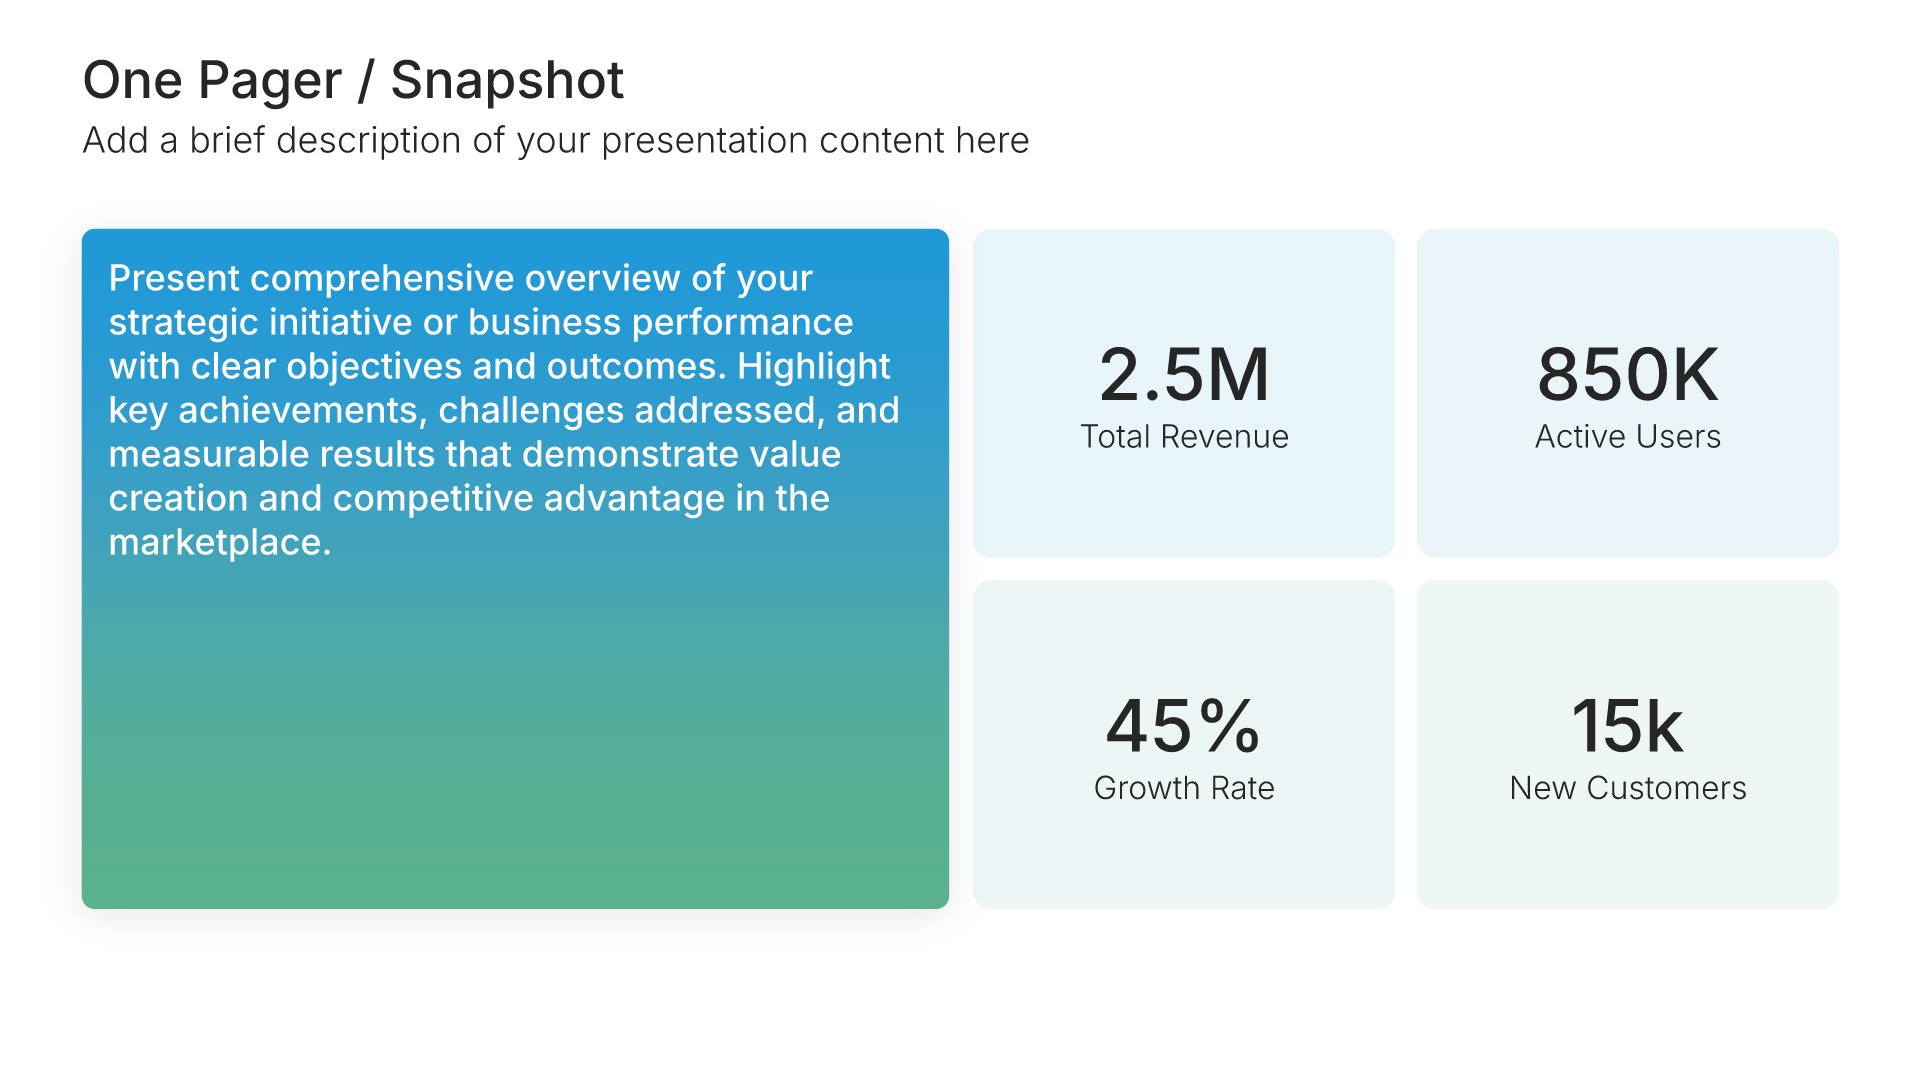
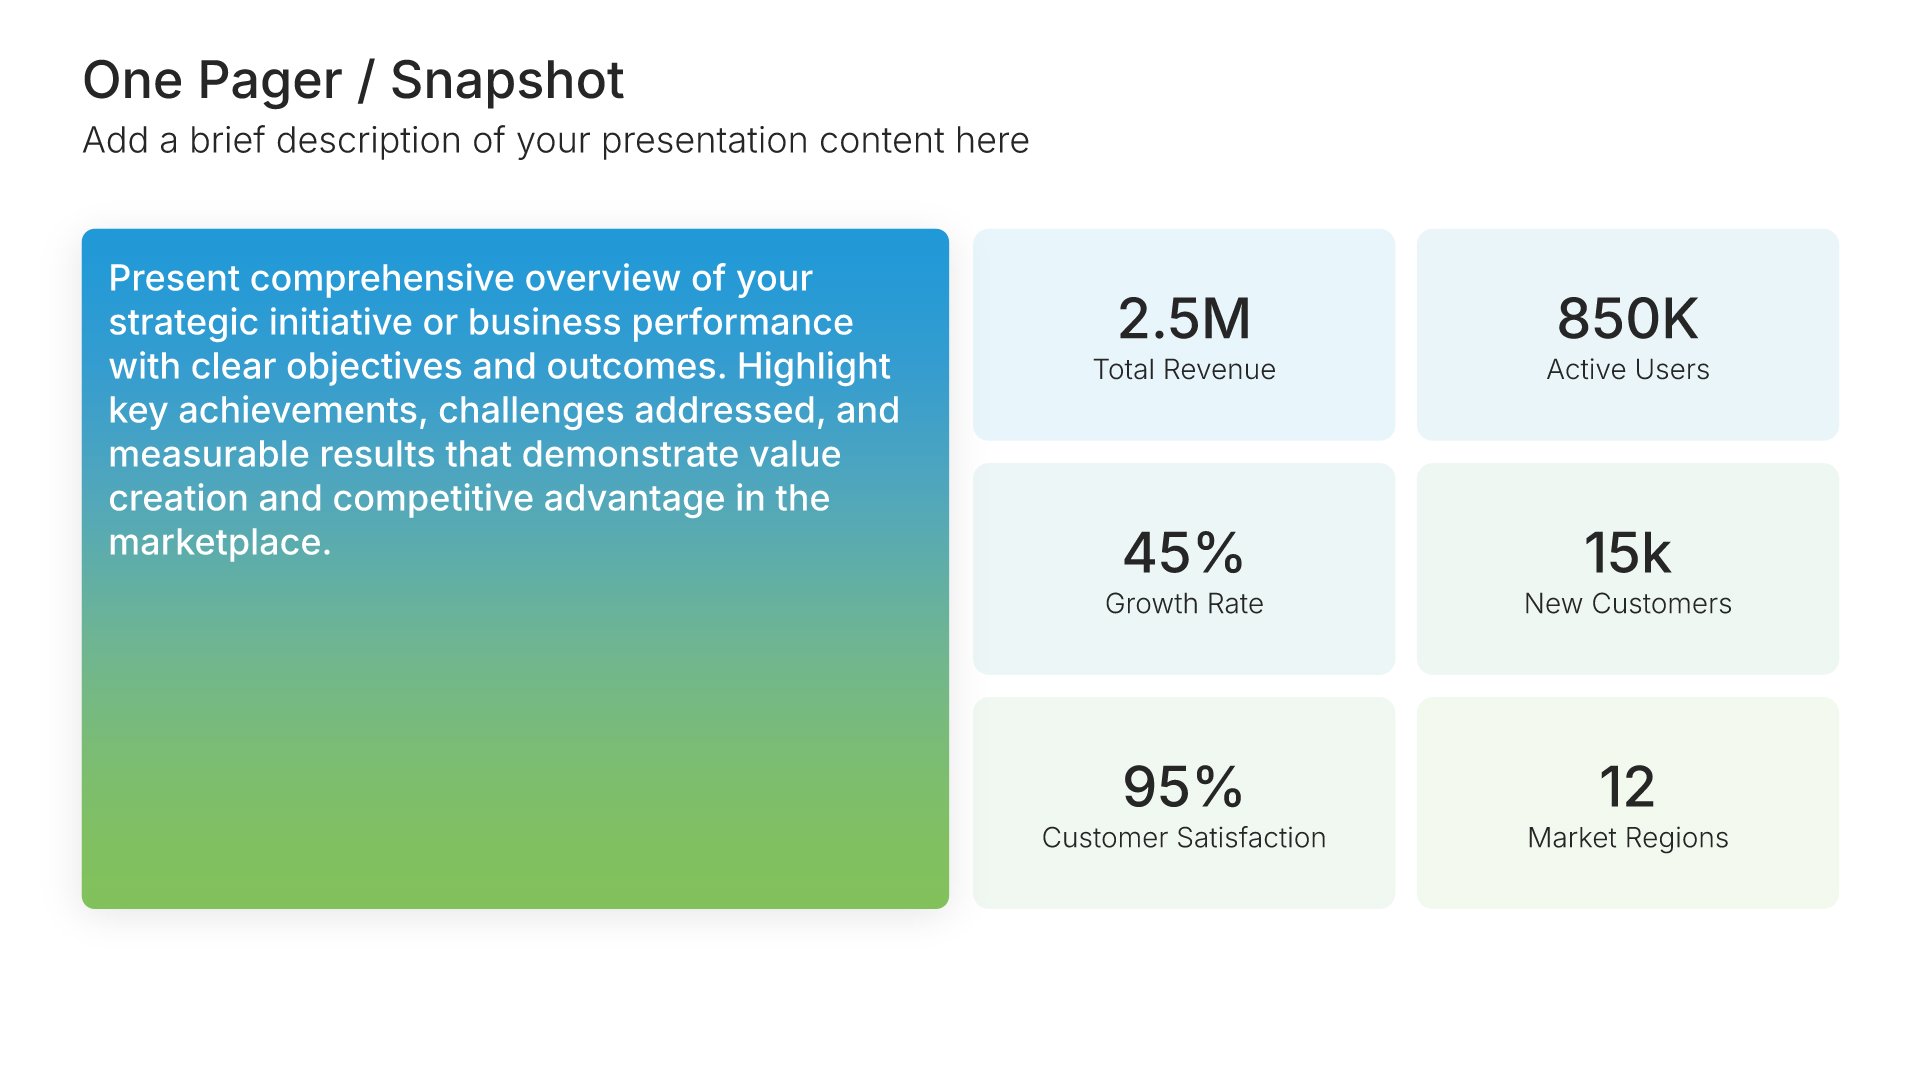
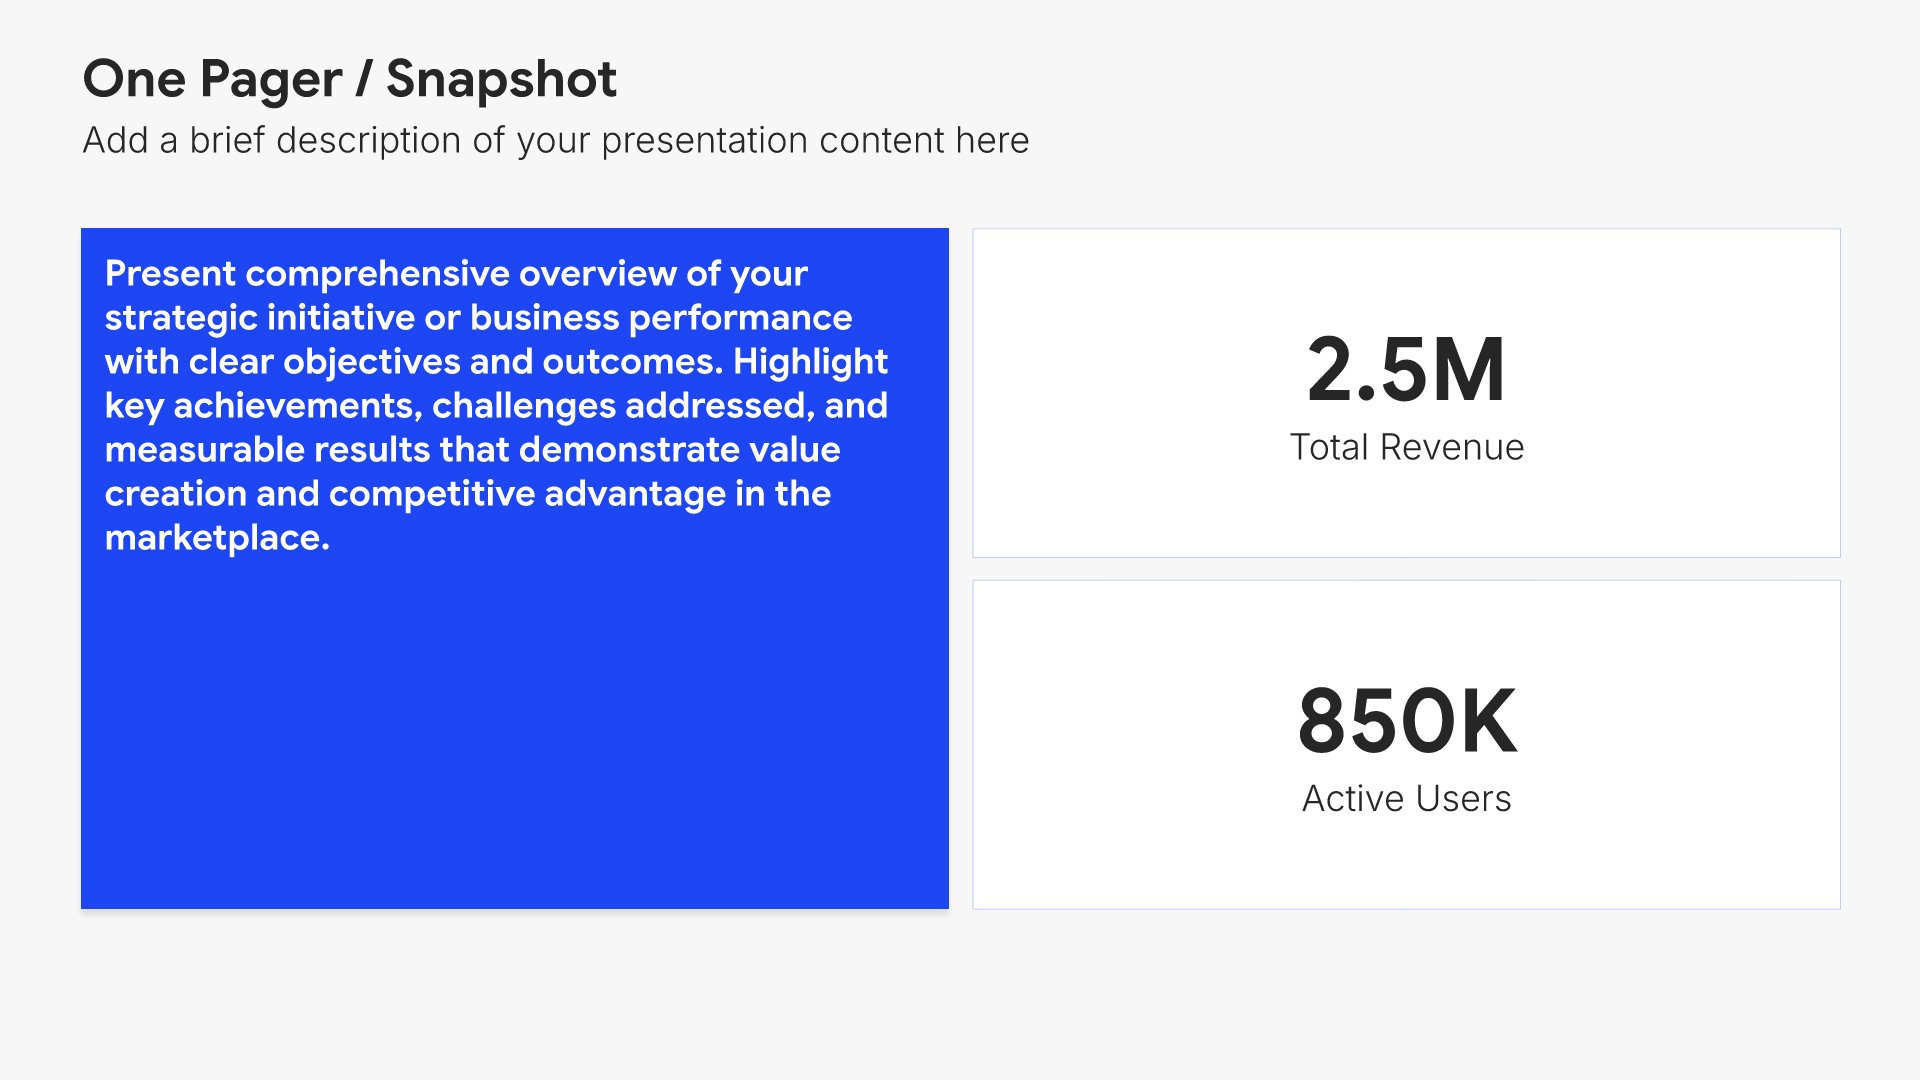
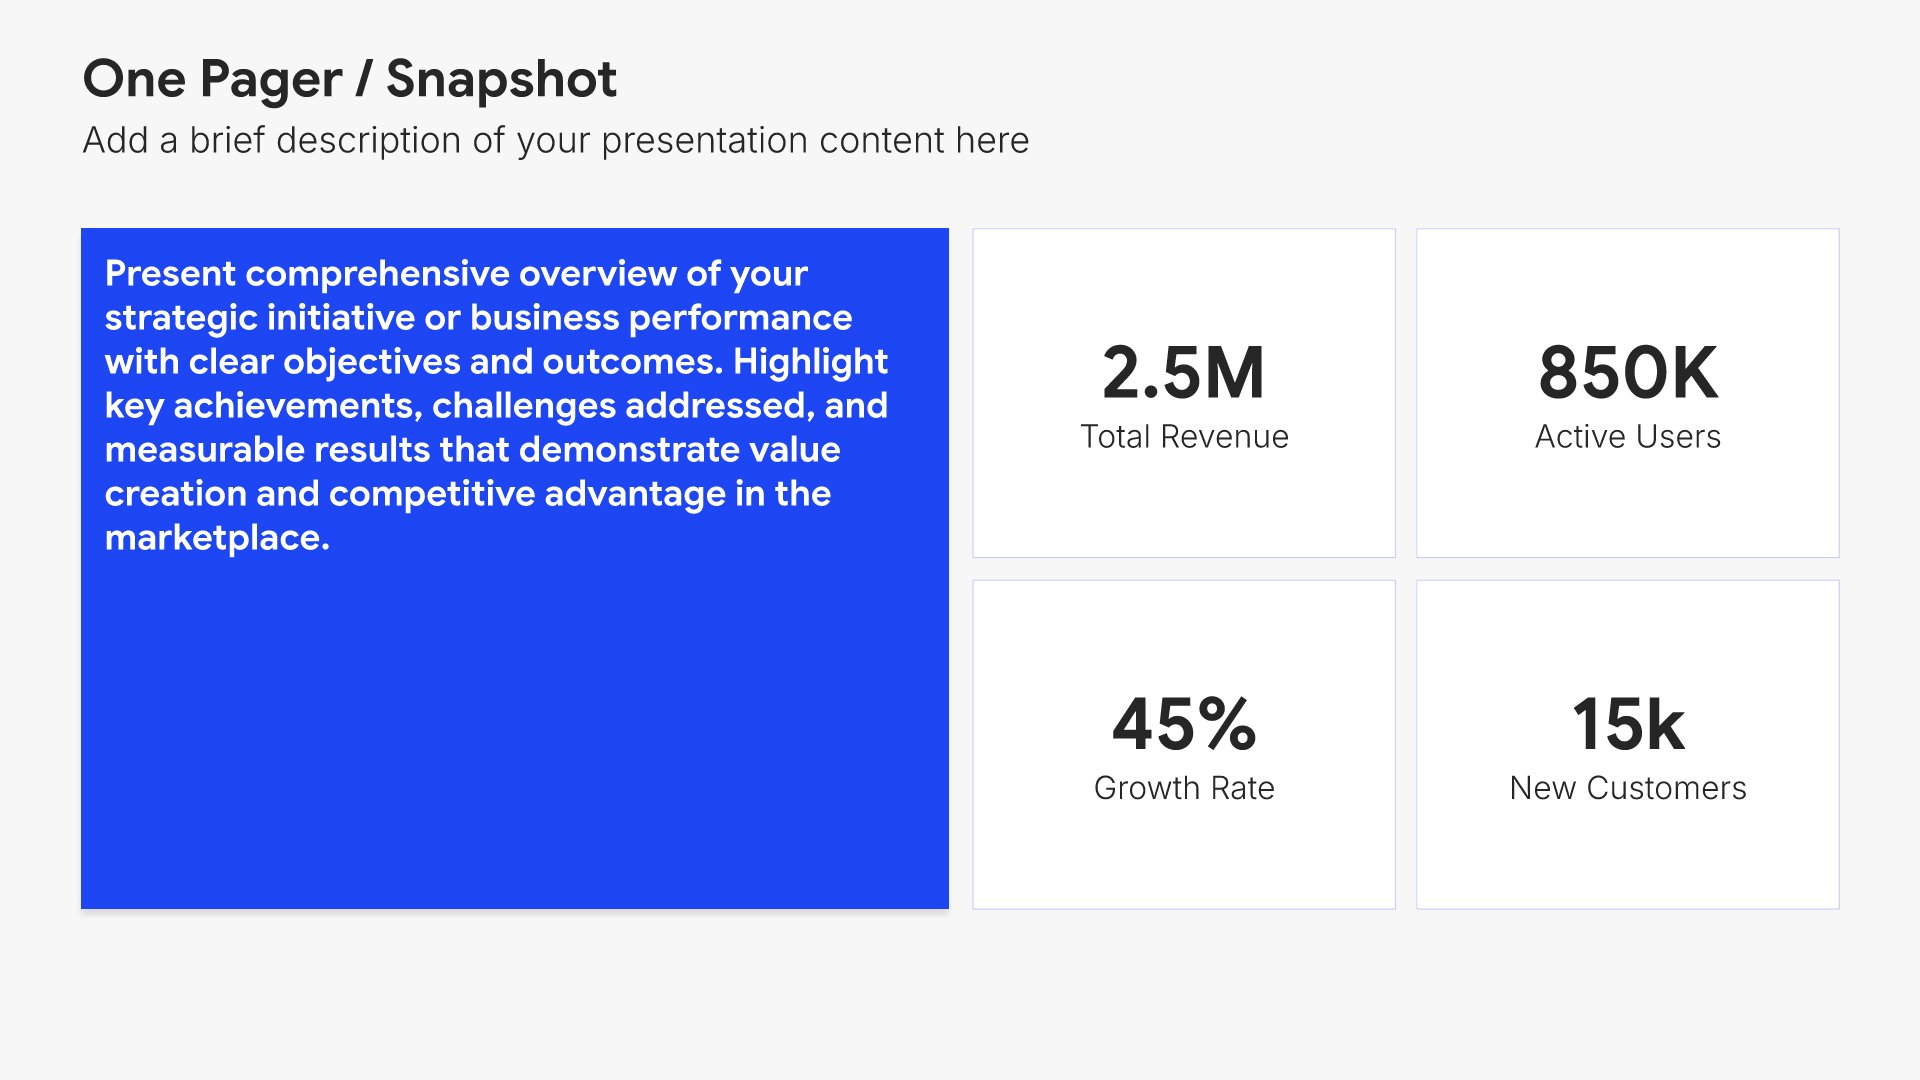
Swap icons and images instantly from our built-in libraries. Use Pointers to choose your count (2-box, 3-box, 4-box) and Variations to pick your design style. No more settling for "close enough." Get the exact slide you need.

Step 3

Brand Your Presentation

Add your logo, apply your brand colors, choose your fonts, and set custom backgrounds. One click and your entire presentation looks like it was made just for you. Because it was.

Step 4

Export Your Presentation

When you're ready, export to PowerPoint, Google Slides, or Keynote with a single click. Continue editing in your favorite tool if you want. Your workflow, your way.

Try Choladeck for free today and experience the ease of creating remarkable presentations.

No Sign-in or Credit Card Required

Wait!

Before you go, have you had the chance to experience Choladeck? If not try out – Choladeck for absolutely FREE!!

No Sign-in or Credit Card Required

Experience Choladeck Yourself!
Why just read about it when you can experience it? Dive into our presentation library – absolutely FREE!

No Sign-in or Credit Card Required