Pricing

BCG matrix template slides

BCG matrix slides sort your products or business units by market growth and market share, so it's clear which to invest in and which to rethink. Pick one of 8 layouts, brand it to your company in one click, place each product, and export to PowerPoint, Google Slides, or Keynote.

Free to start. No credit card required.
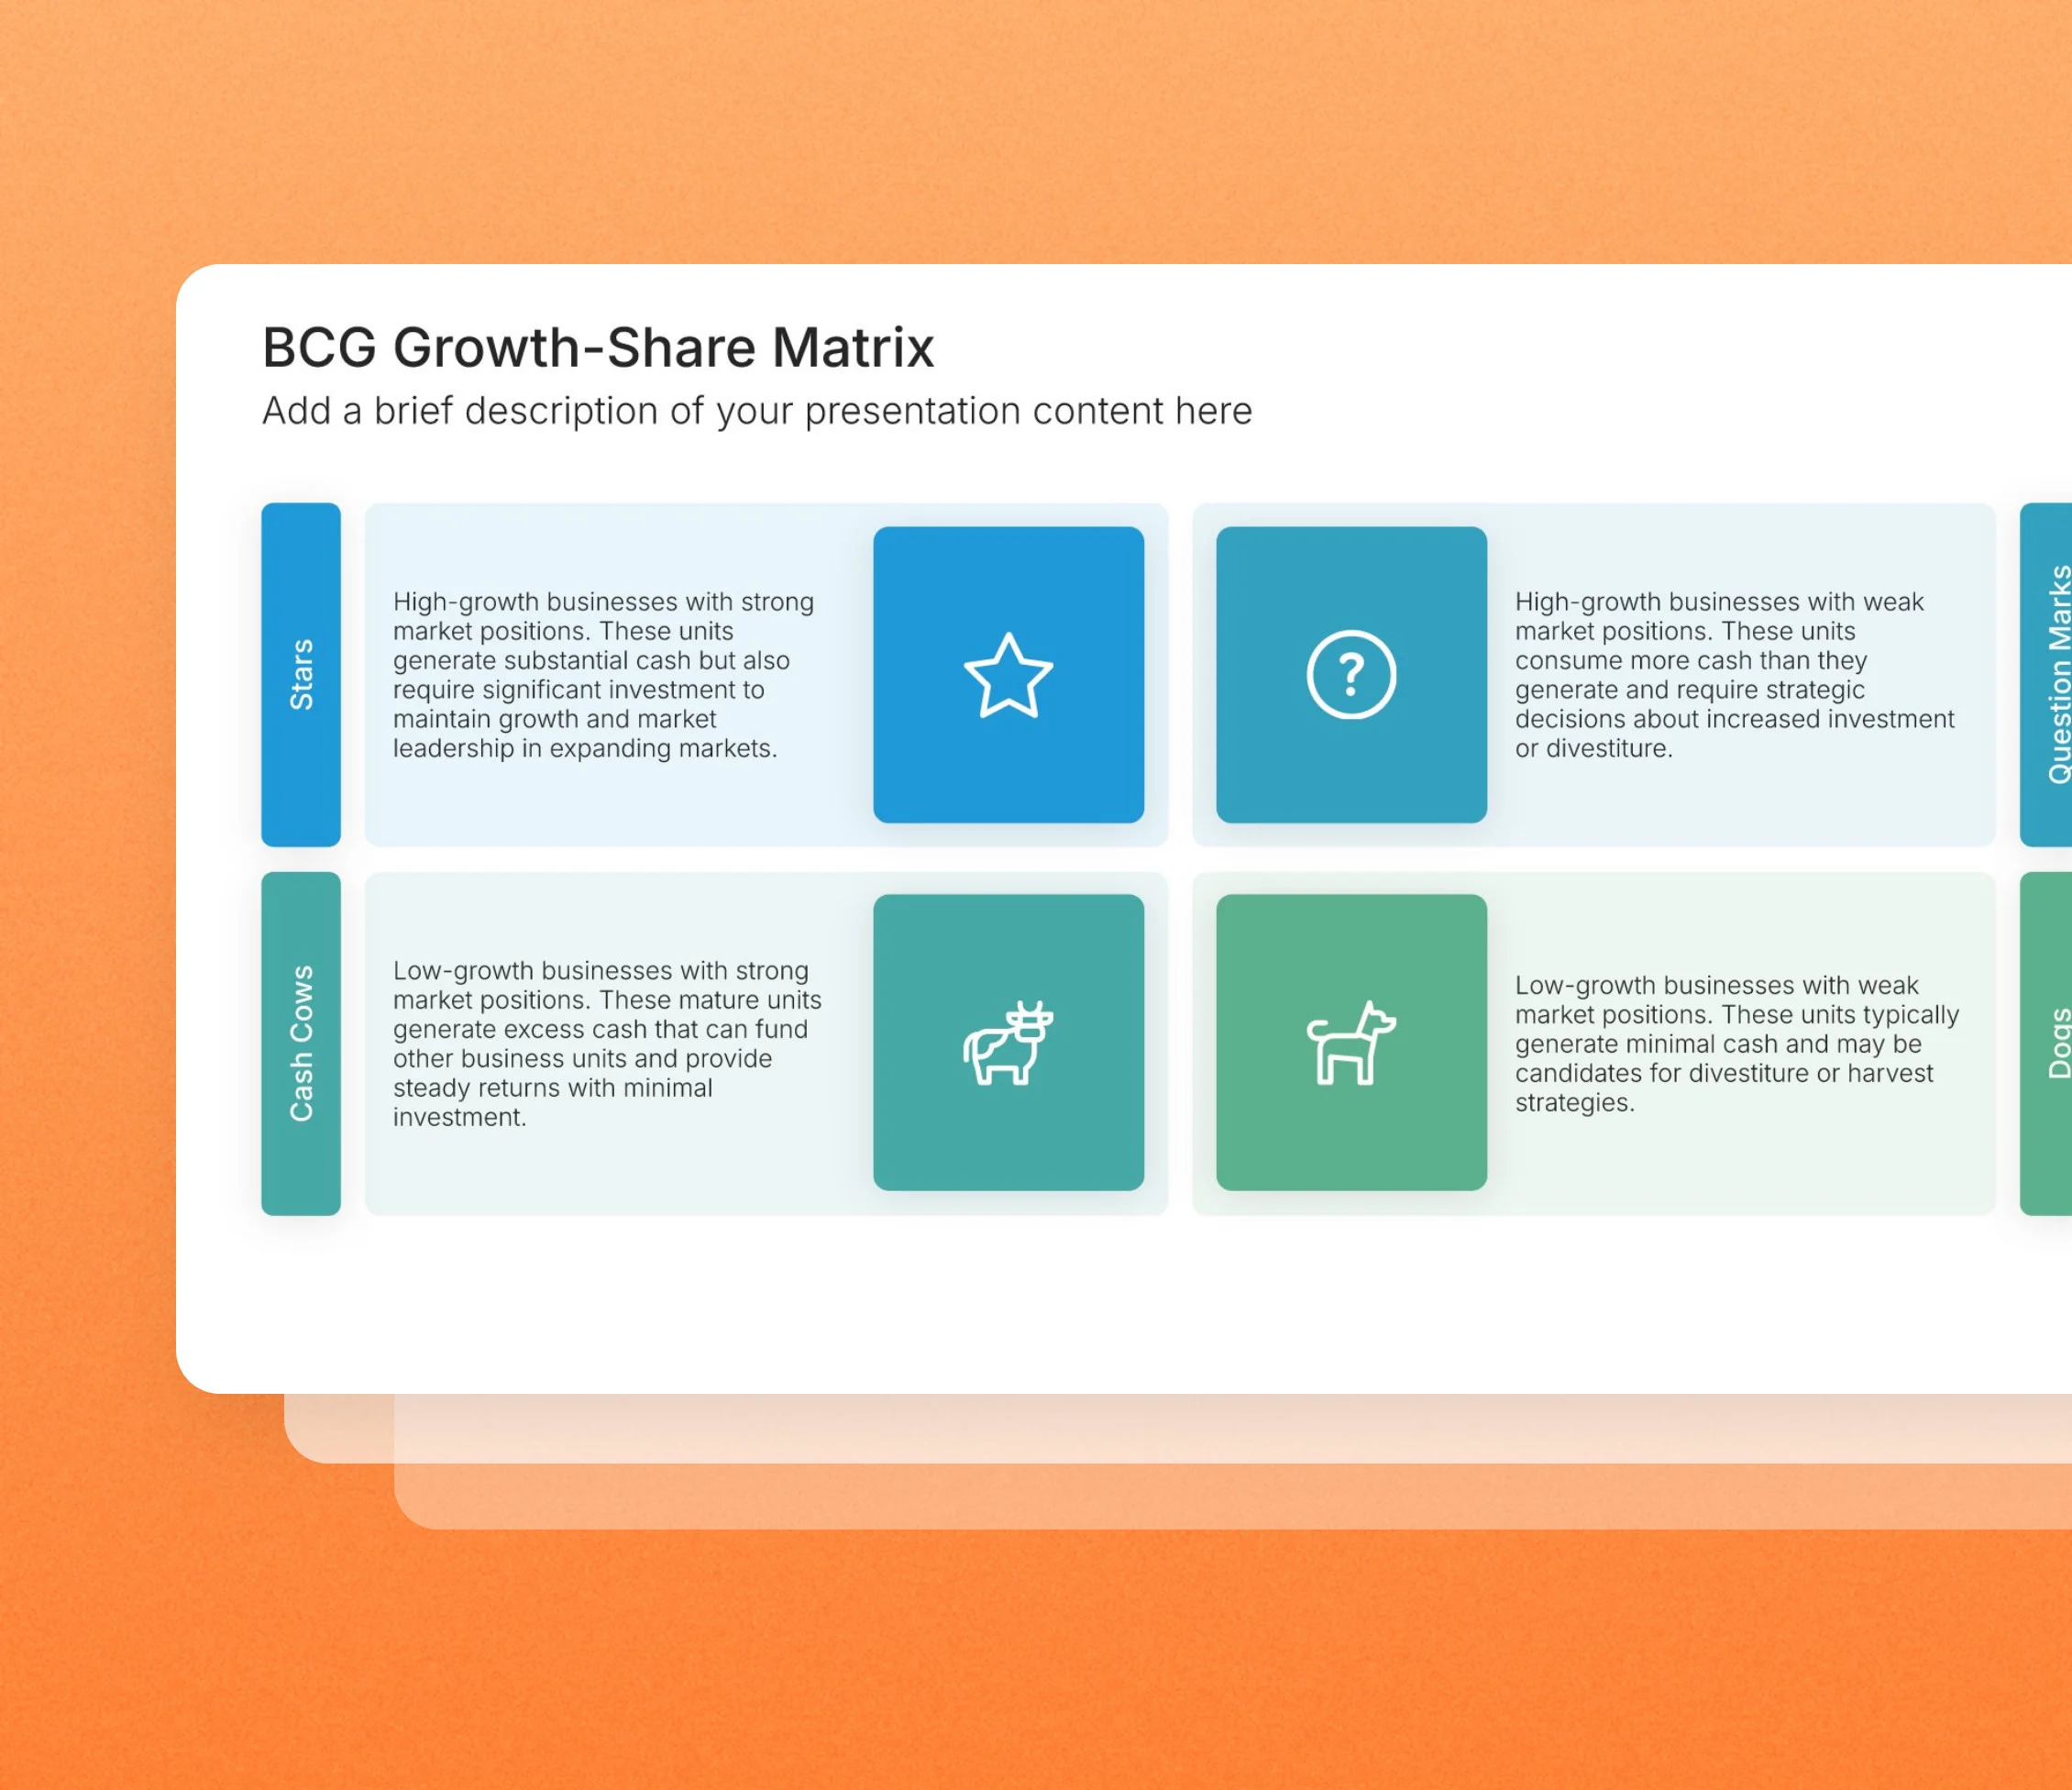
BCG matrix template slides in the Choladeck slide library

Browse BCG matrix slides

8 ways to map your product portfolio, all fully editable.
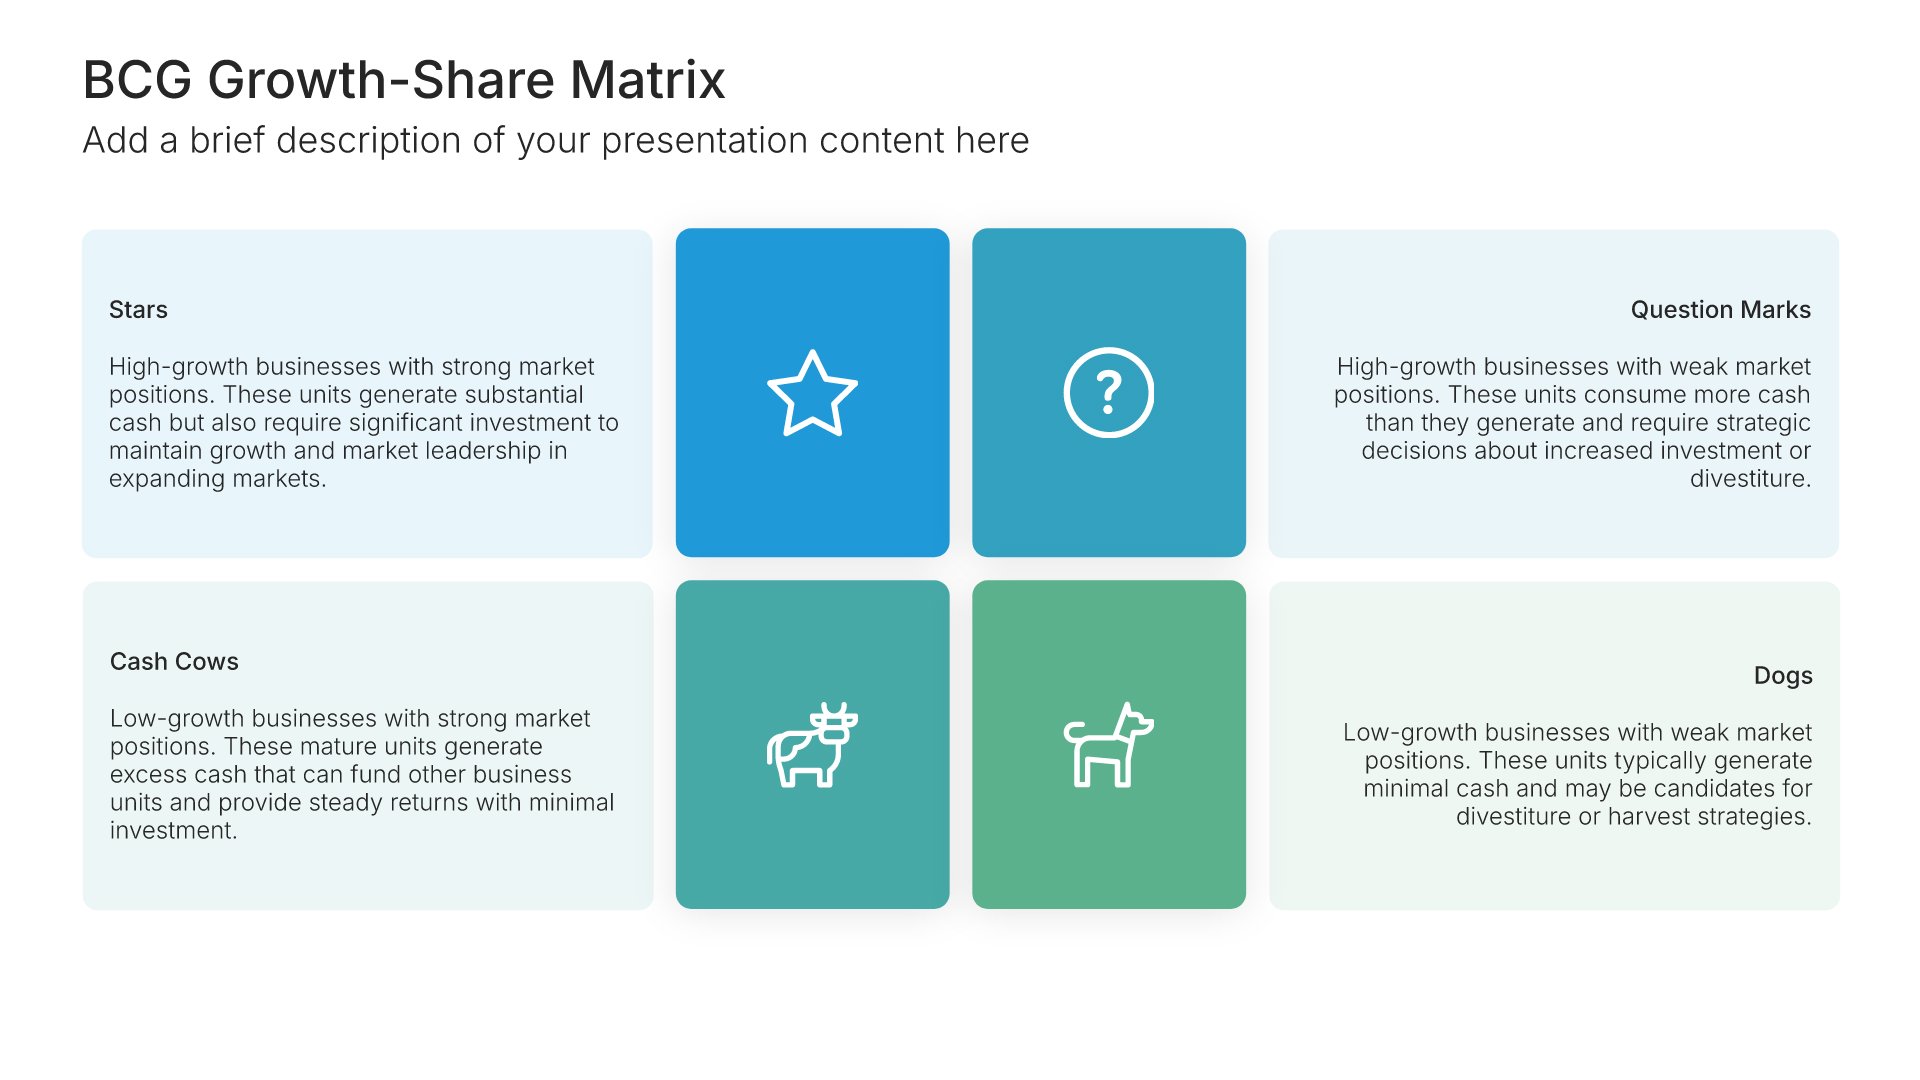
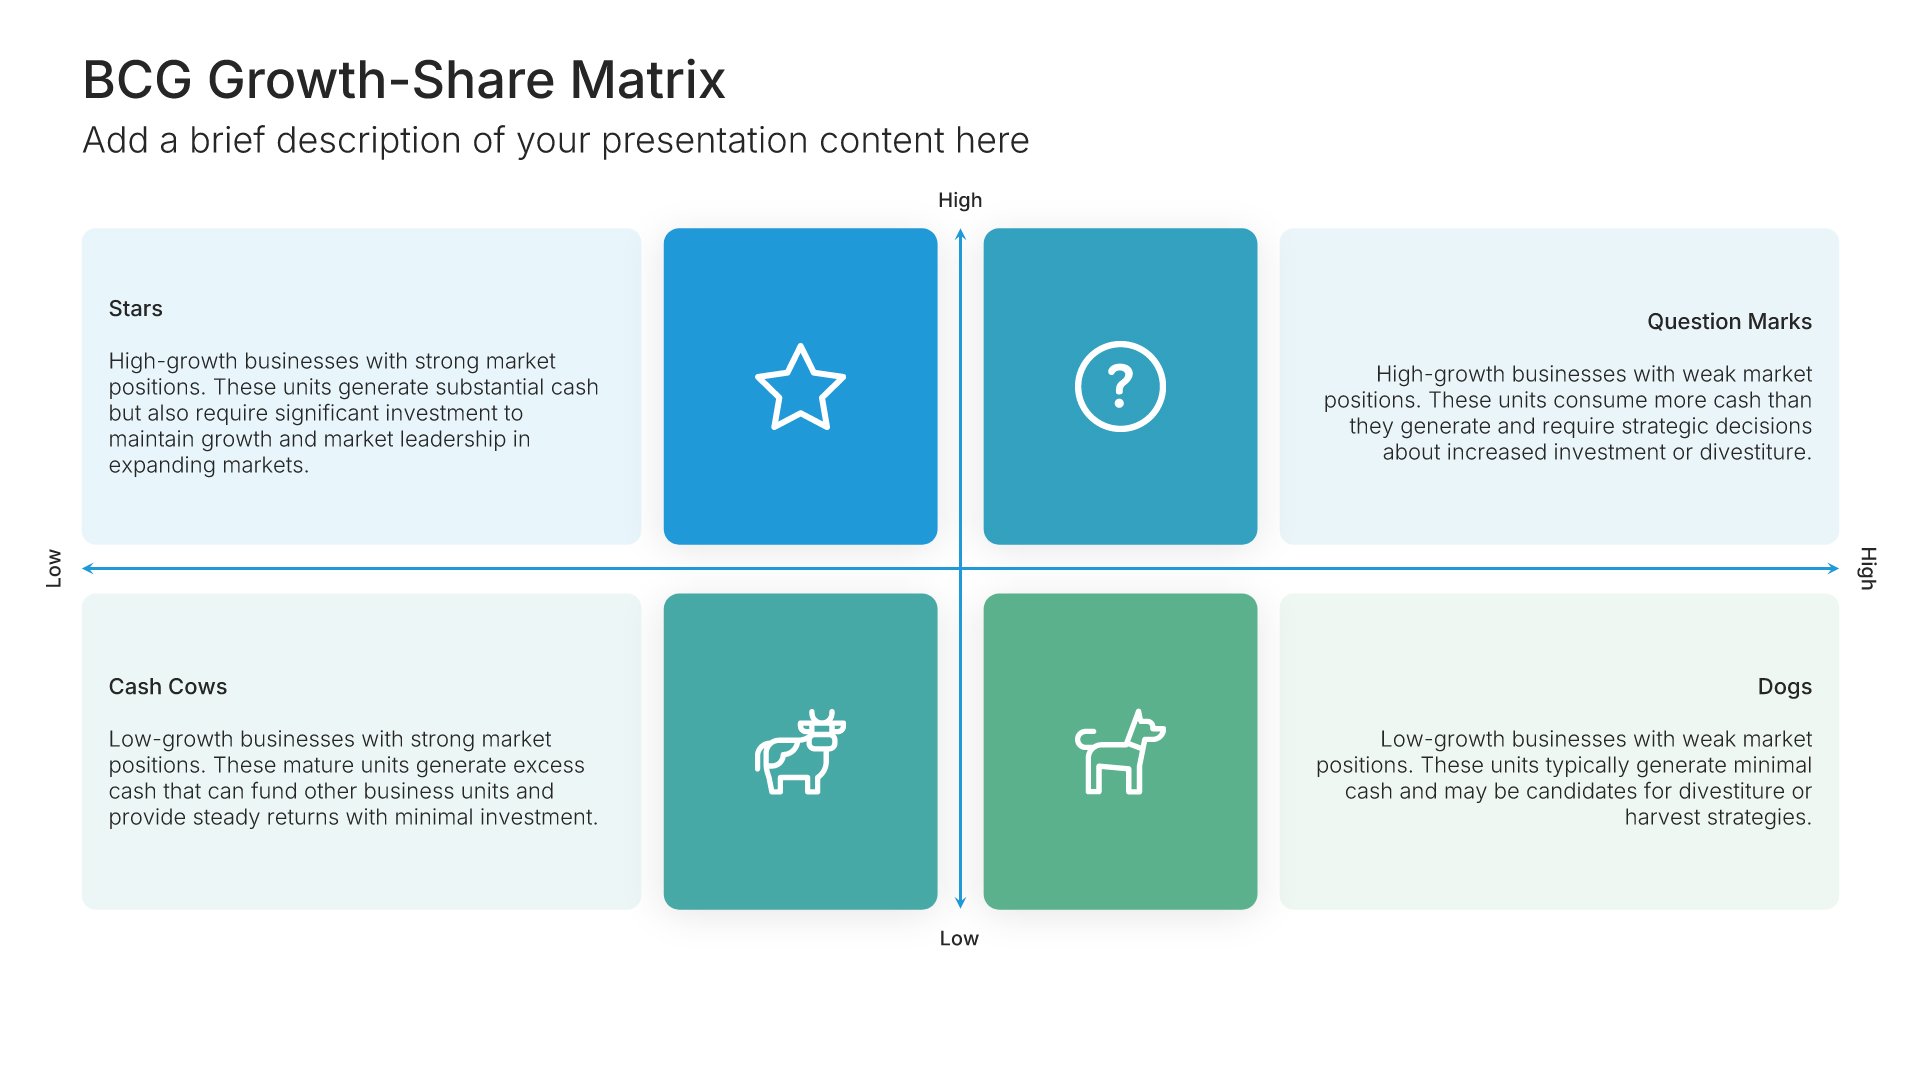
BCG Growth-Share Matrix • Slide Library • Layout 01 of 8

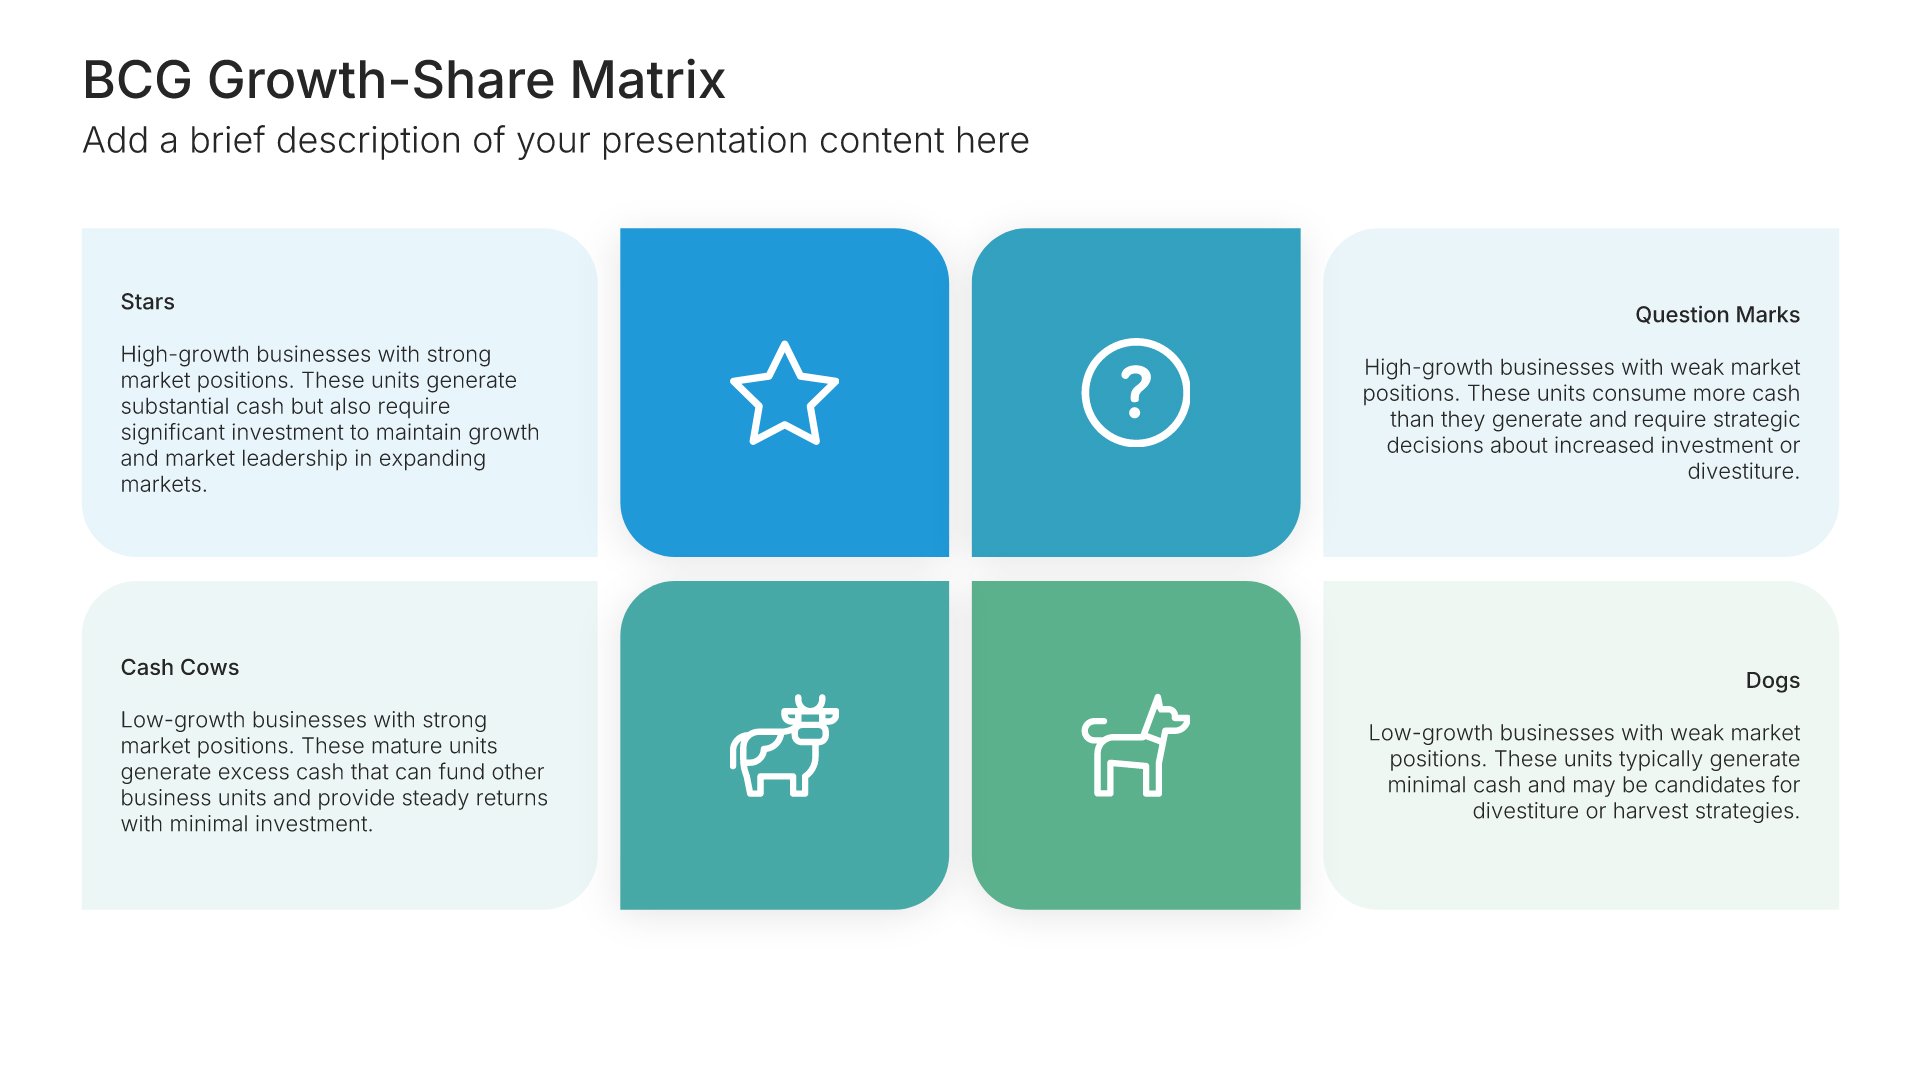
BCG matrix template slide, layout 01

Layout 01

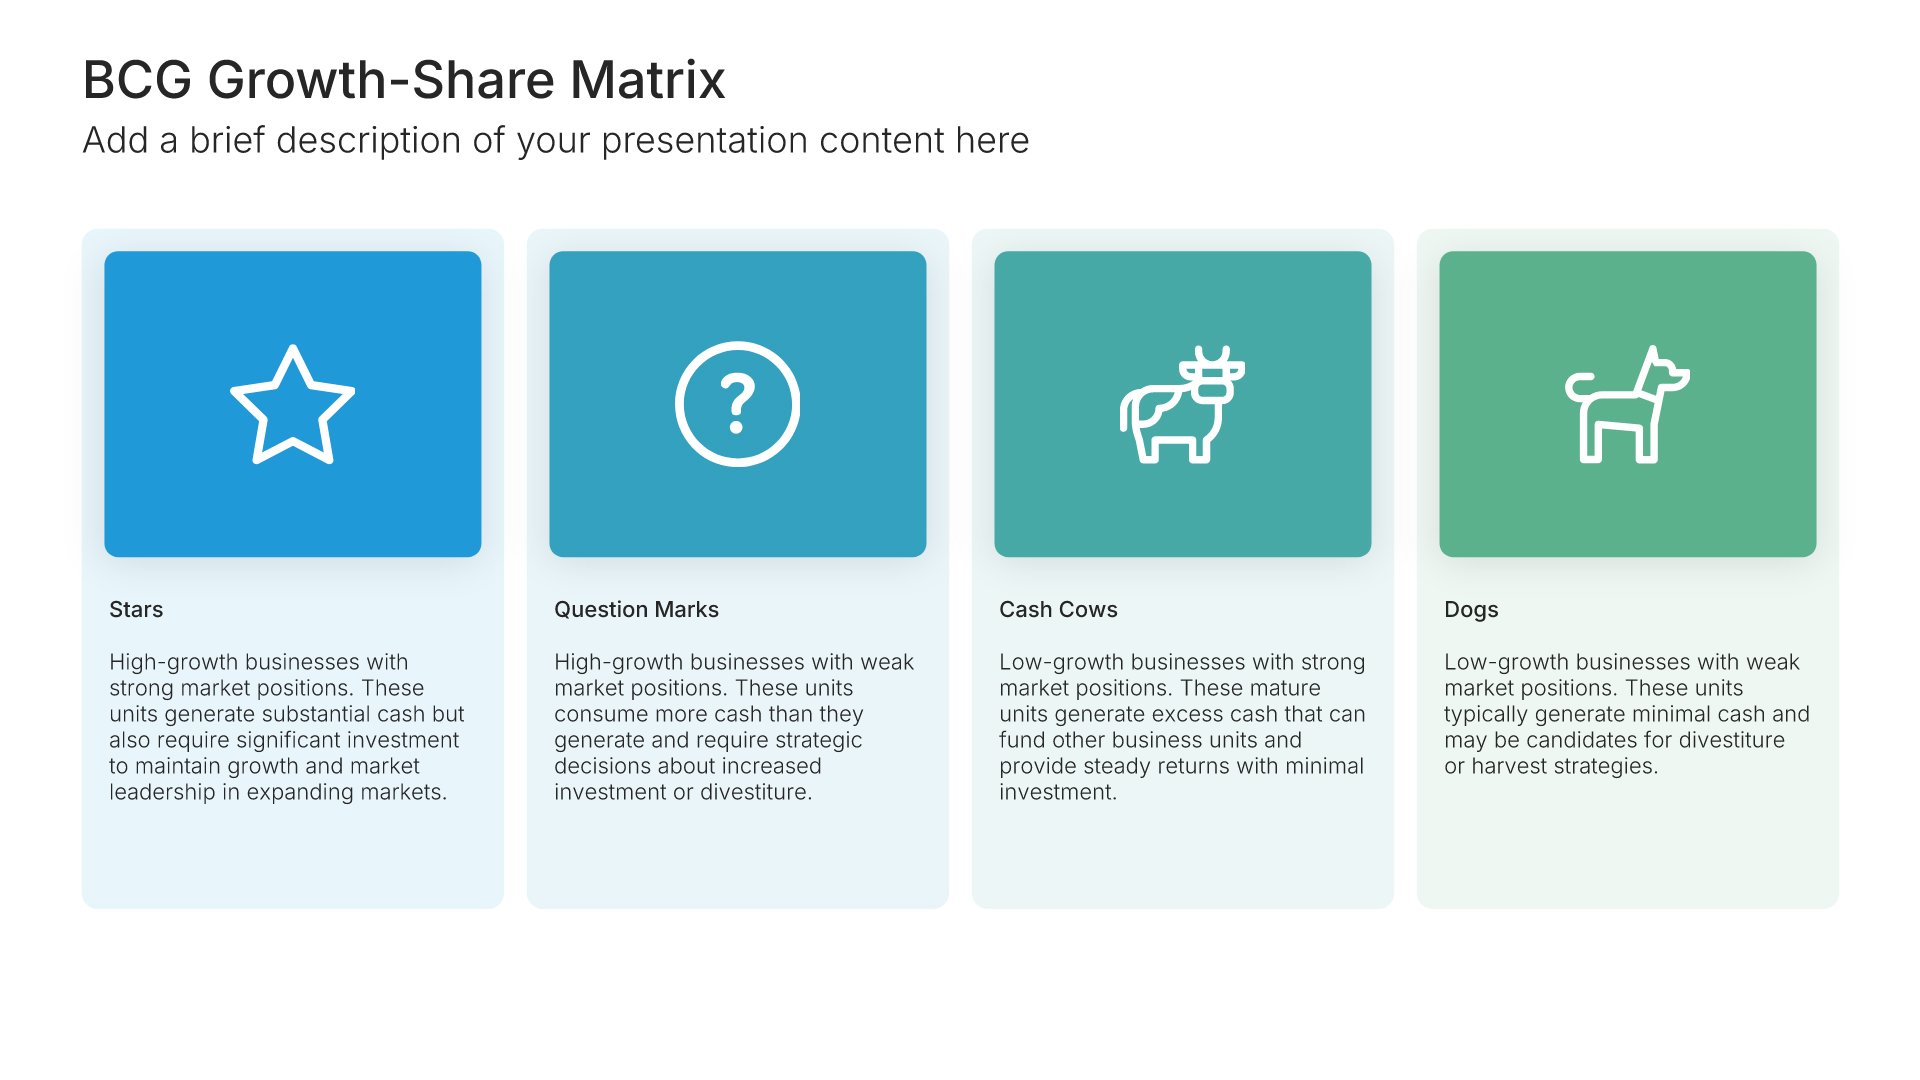
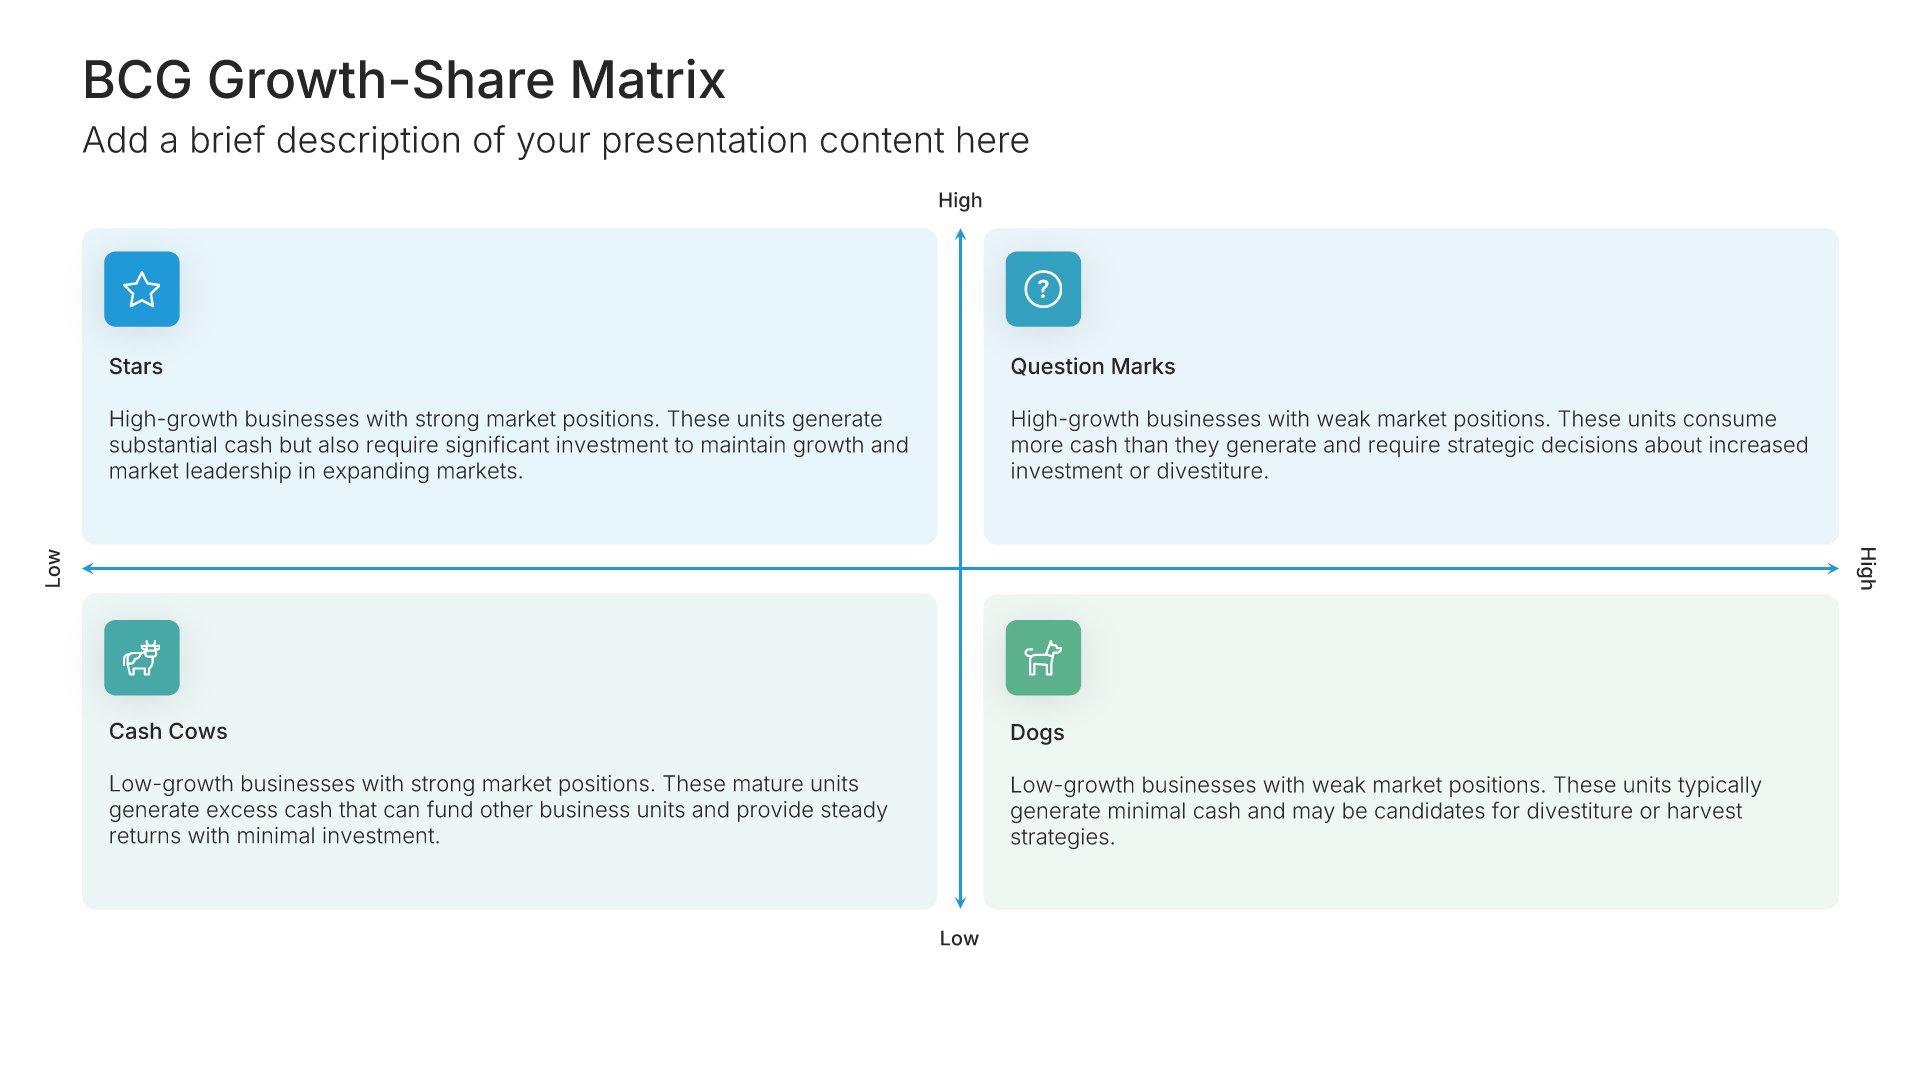
BCG matrix template slide, layout 02

Layout 02

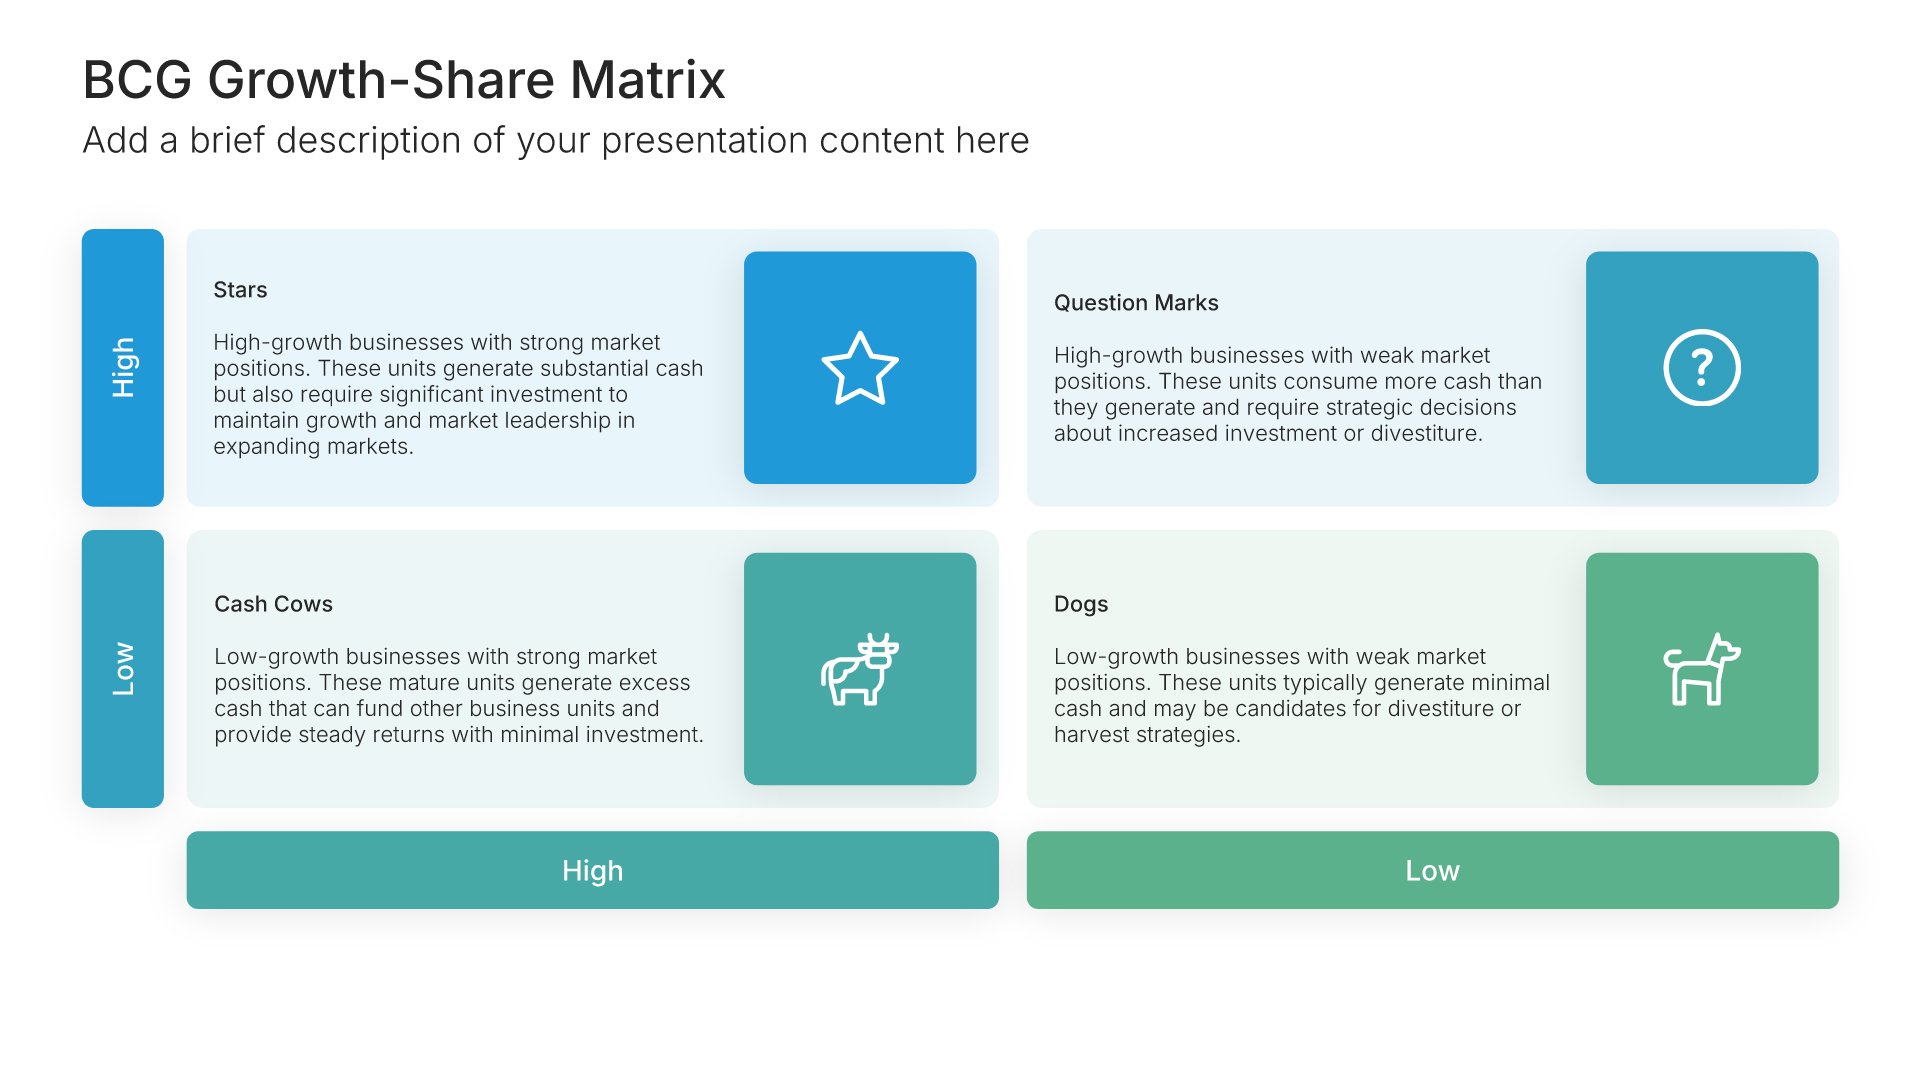
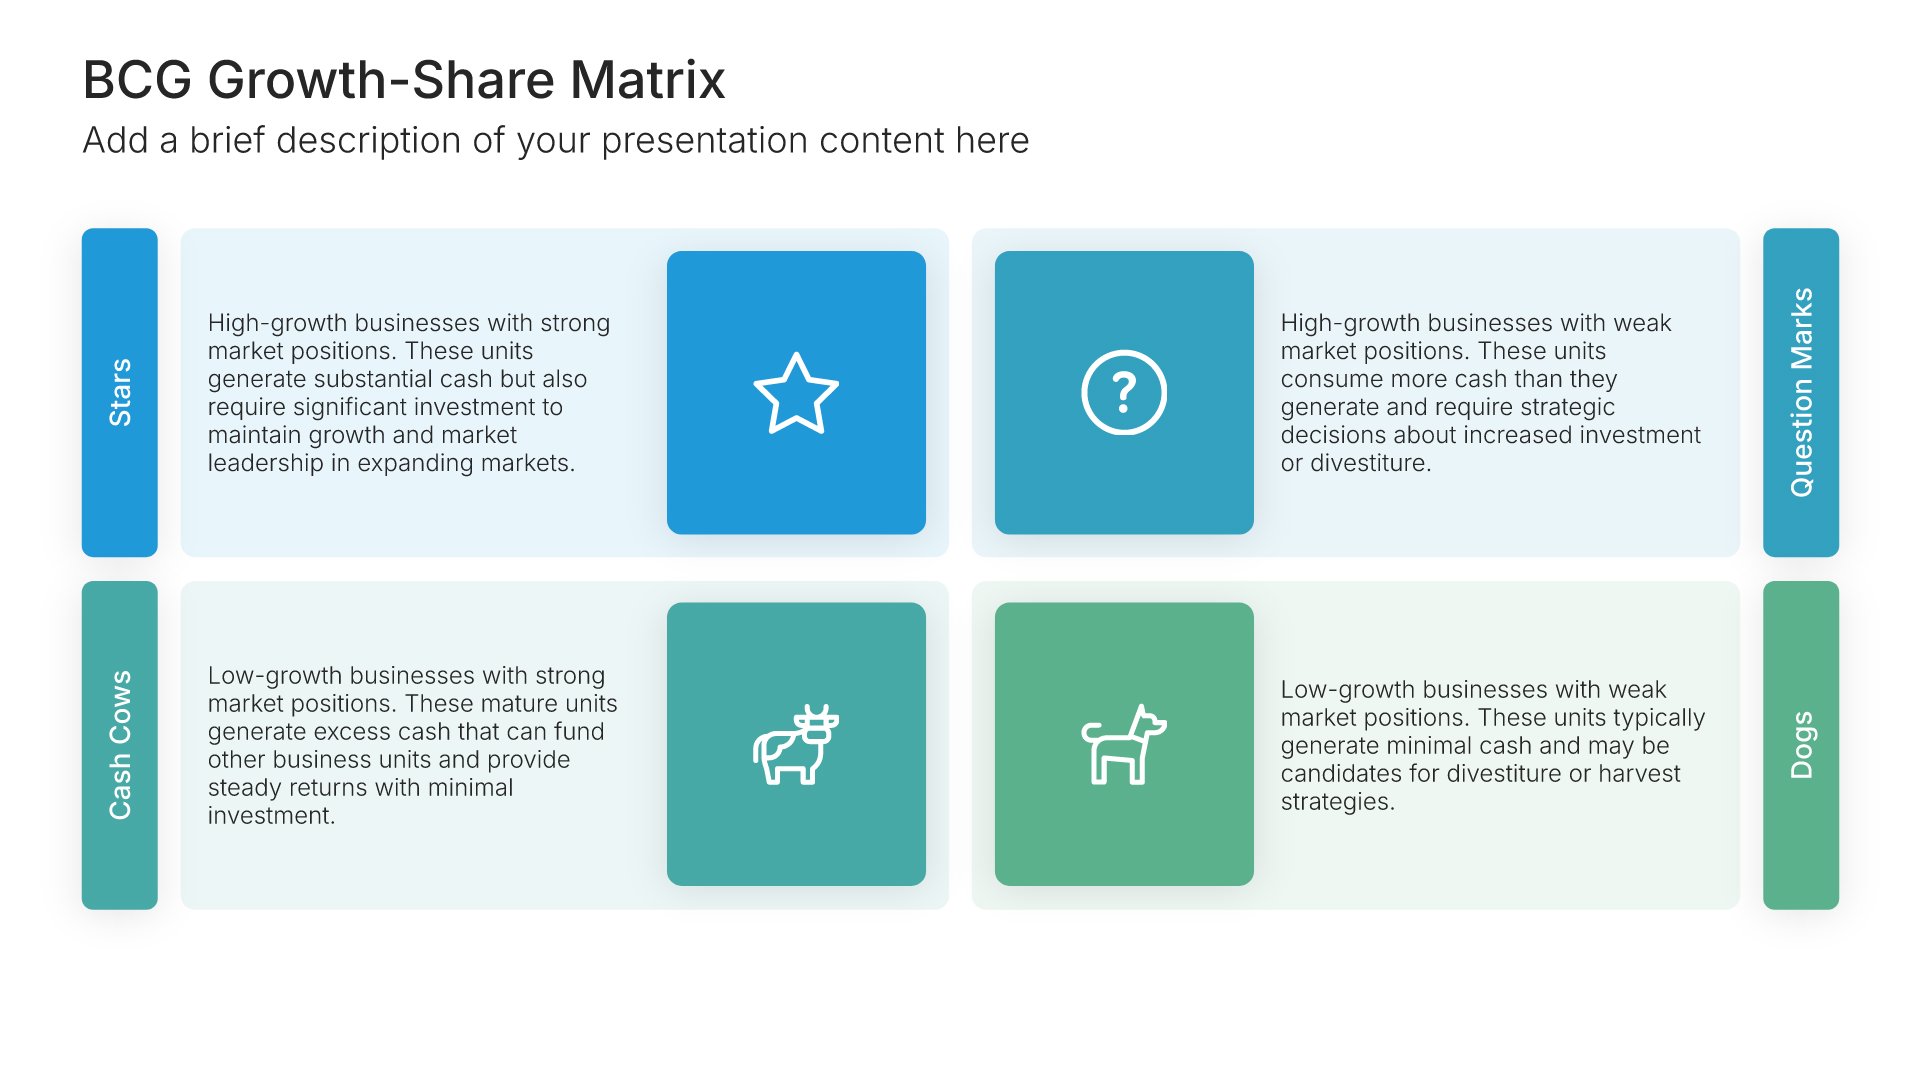
BCG matrix template slide, layout 03

Layout 03

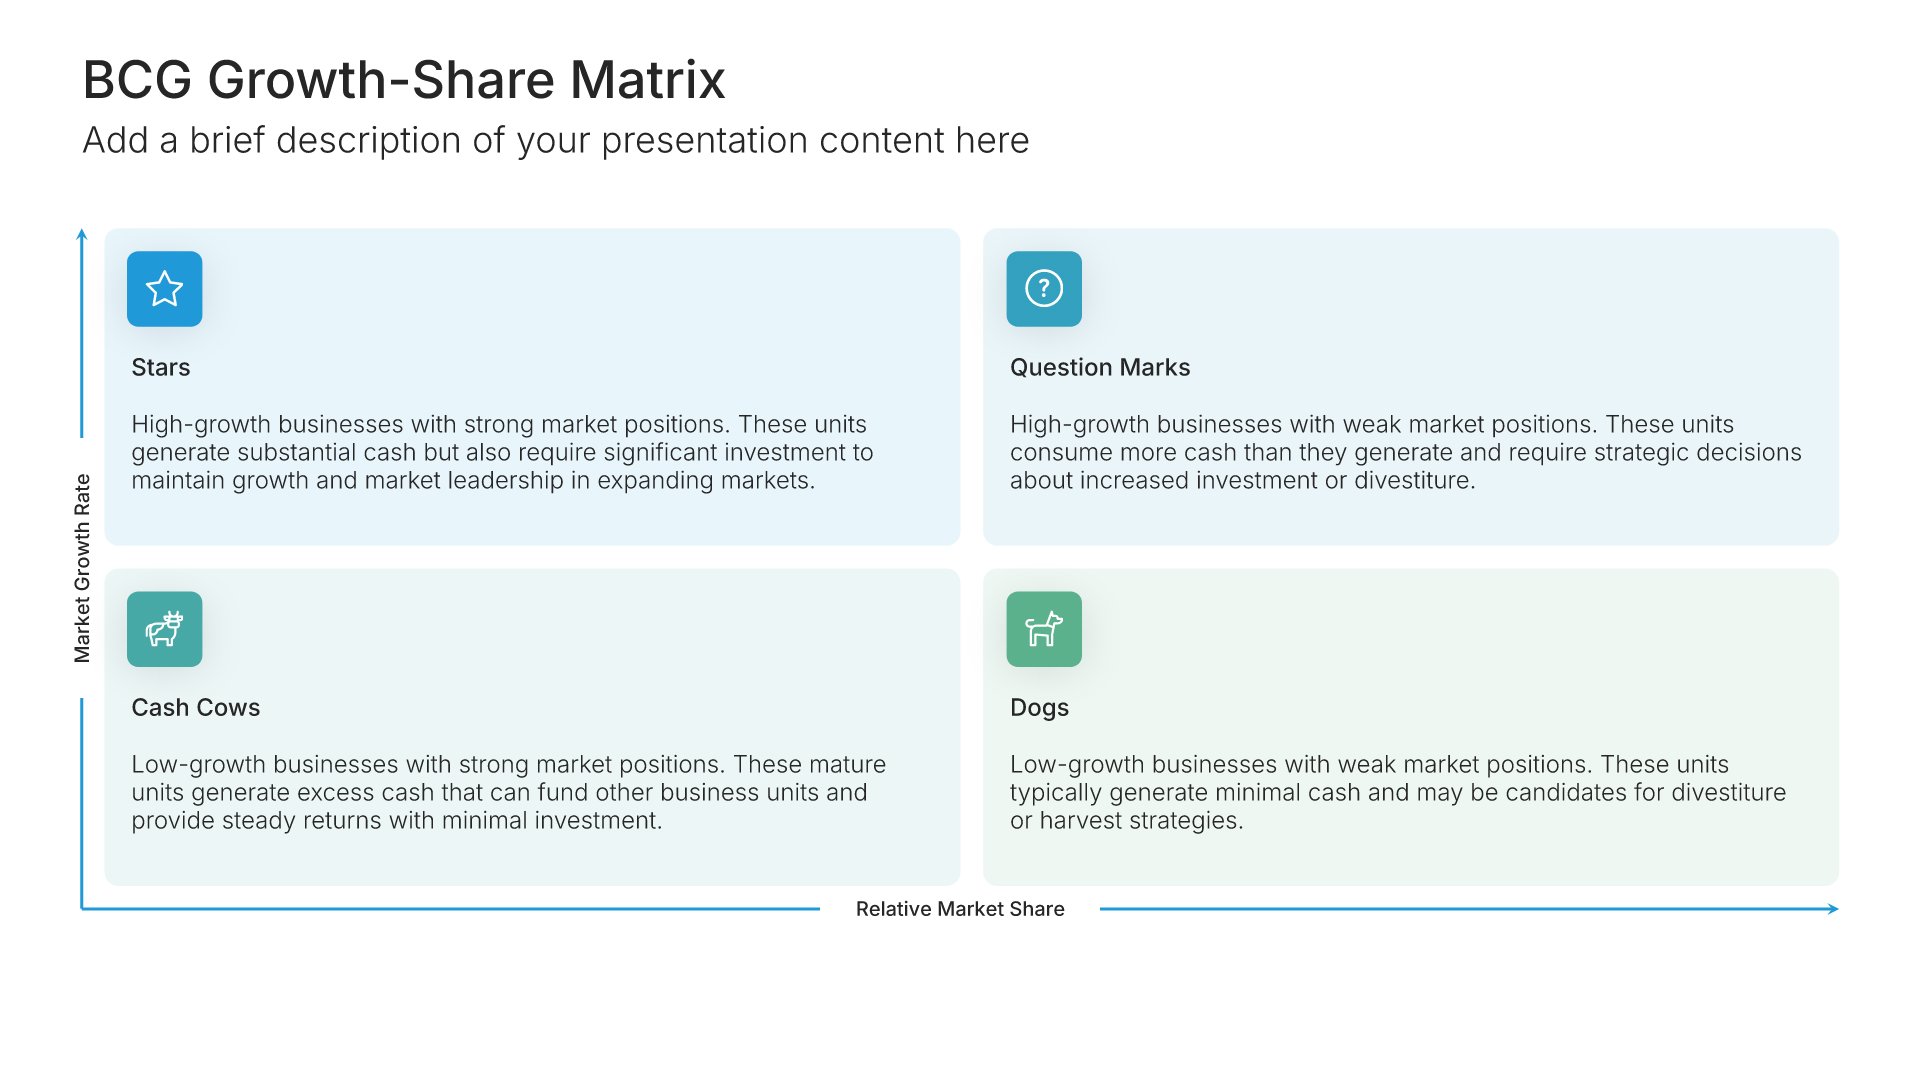
BCG matrix template slide, layout 04

Layout 04

BCG matrix template slide, layout 05

Layout 05

BCG matrix template slide, layout 06

Layout 06

BCG matrix template slide, layout 07

Layout 07

BCG matrix template slide, layout 08

Layout 08

About our BCG growth share matrix slides

What the slide does, how to use it, your brand, and a file you can edit anywhere.

Built to show your whole portfolio in one view

The BCG Growth-Share Matrix was created by Boston Consulting Group in 1970 to help companies decide where to put their money. It plots each product by market growth and relative market share, which places it in one of four groups, each with a different role in the portfolio. A BCG matrix template shows the whole portfolio in one view. Our BCG slides keep the four quadrants clearly labeled, so the audience reads the portfolio at a glance.

Why the quadrants tell the story

A portfolio listed in a table is just data. Placed on the matrix, each product has a clear role: stars to grow, cash cows to fund the rest, question marks to decide on, and dogs to fix or exit. So the slide answers the question the audience is really asking, which is where the money should go.

Brand the whole presentation in one click

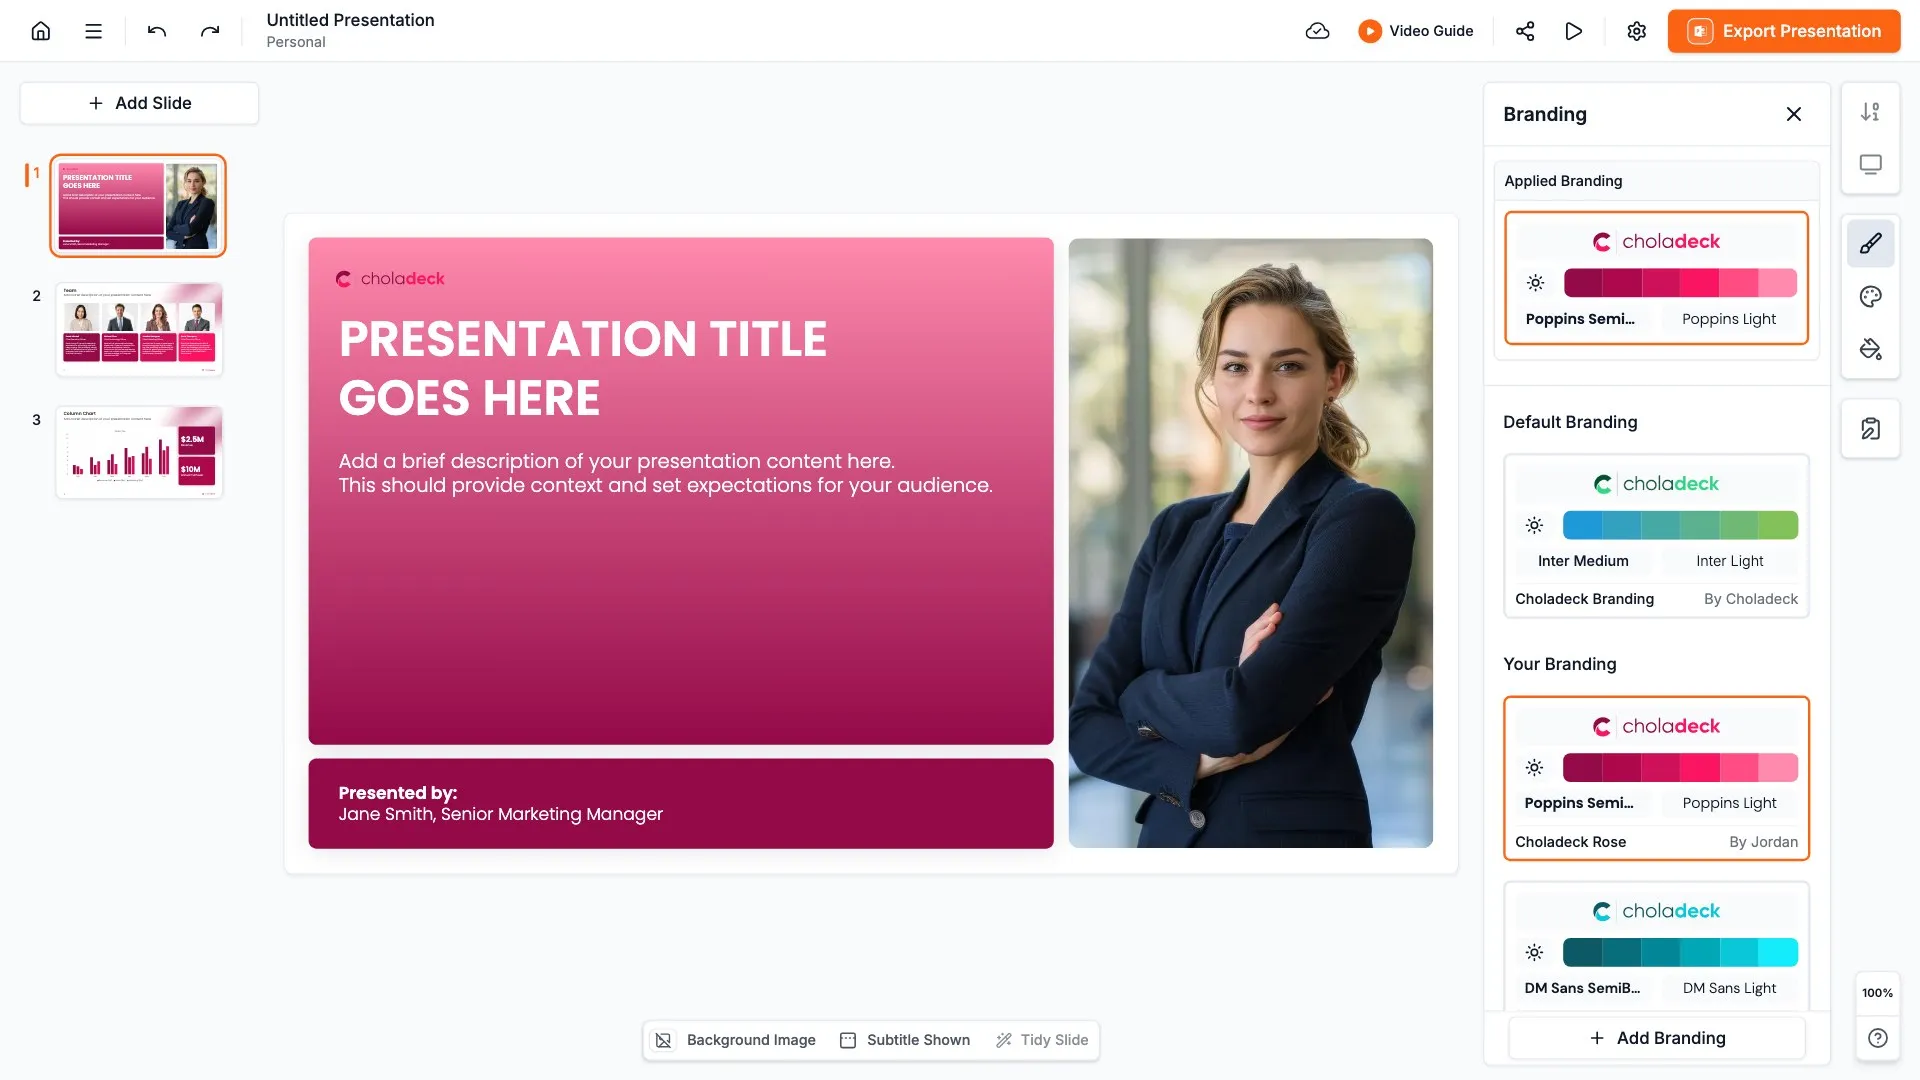
Add your logo, colors, fonts, and background once. It applies to the whole presentation and the entire slide library at the same time. Portfolio reviews go to leadership and boards, so the slide should look like your company’s analysis, not a textbook diagram.

Export to PowerPoint, Google Slides, or Keynote

You get a real file, not a locked link. Export it and keep editing in the tool you already use. Quadrants, labels, and product positions stay editable, so you can move products as the numbers change.

How Choladeck works

From blank page to finished presentation in four steps.

STEP 01

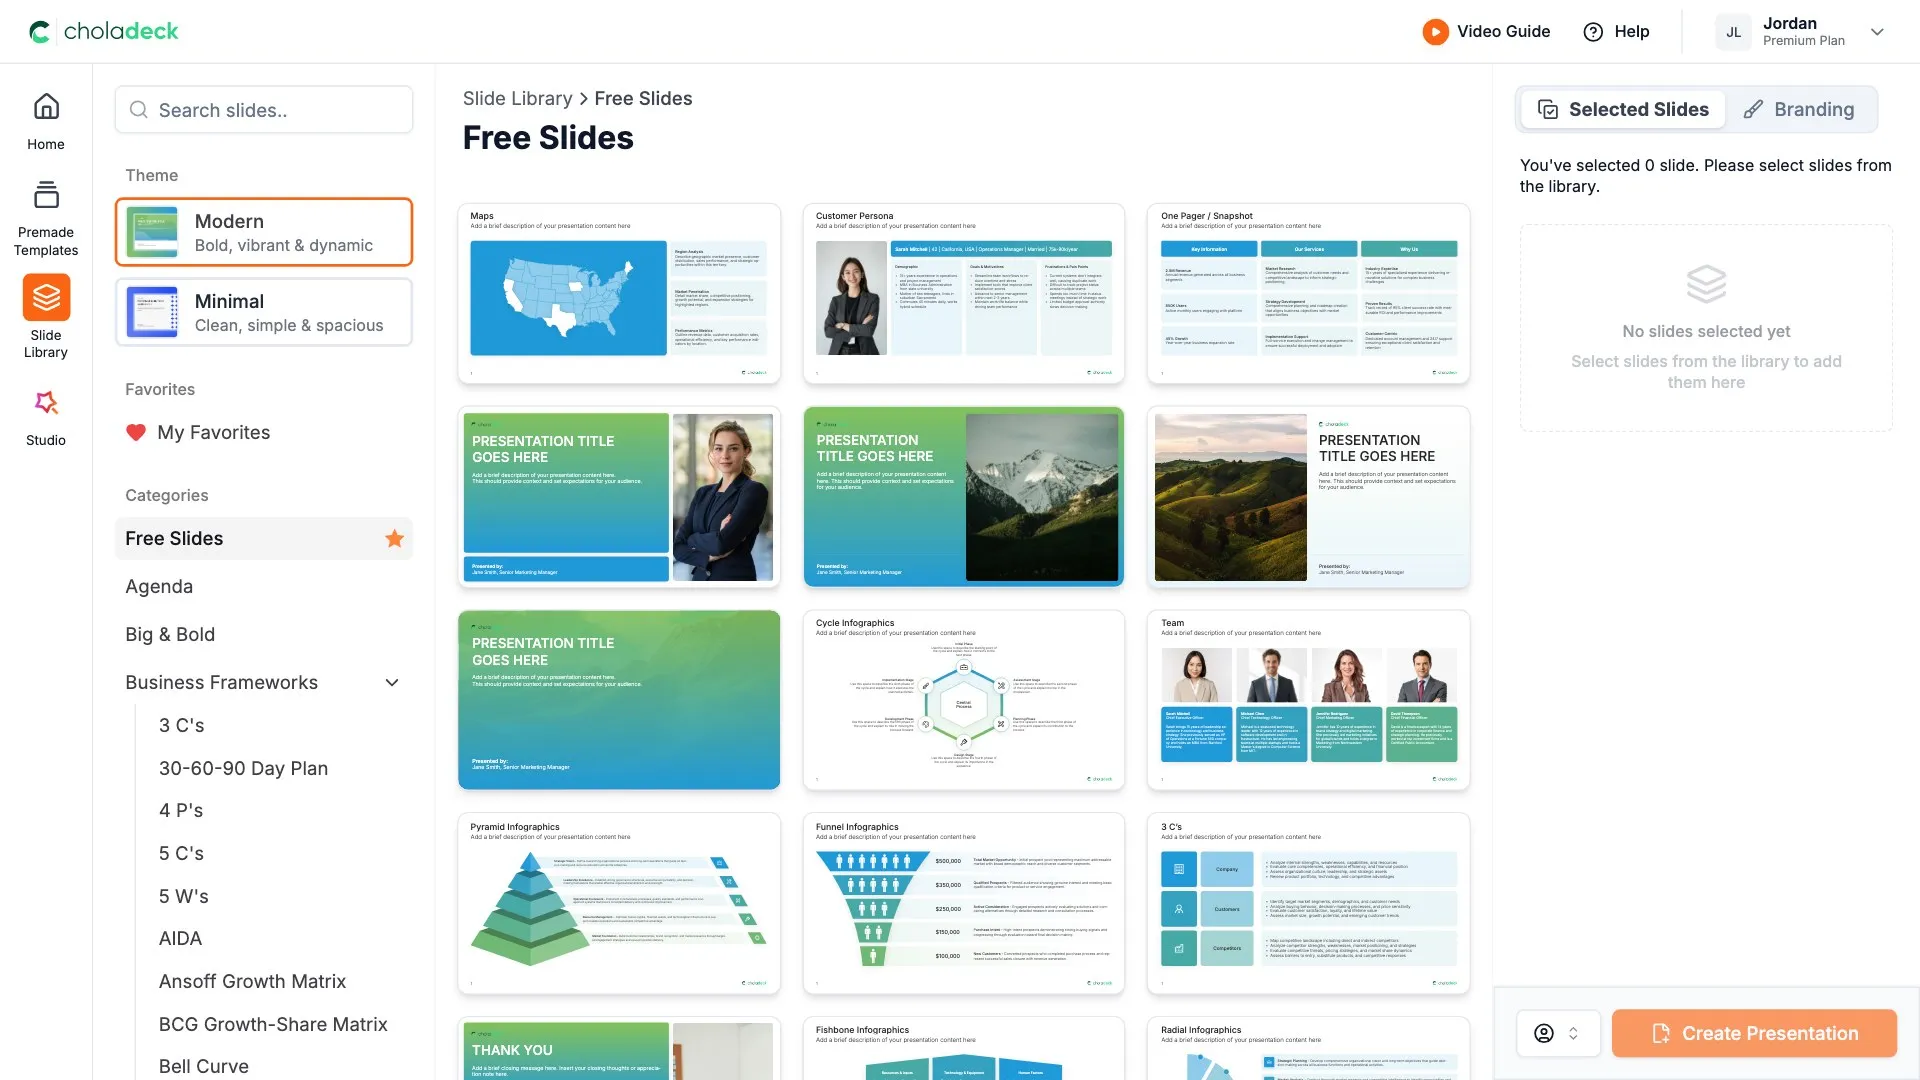
Browse 9,000+ slides across 134+ categories, or open one of the 74 premade presentations.

STEP 02

Add your logo, colors, and fonts in one click. The whole presentation instantly matches your company.

STEP 03

Add your text, numbers, charts, and tables. Everything on the slide is editable.

STEP 04

Send it to PowerPoint, Google Slides, or Keynote, and present.
Start from a template

Need a complete presentation instead?

If you're starting from nothing rather than fixing a few slides, open one of 74+ premade presentations instead. Each one is complete and built for one purpose, from pitch decks to business plans and company profiles.

Choladeck premade templates with the Type of Presentation filter and the Consulting Company Profile deck shown larger

Questions about BCG matrix slides

How the slides work, and how far you can change them.

Using the slides

Can I edit these slides in PowerPoint?

+

Yes. Export to PowerPoint, Google Slides, or Keynote, and every quadrant and product position stays editable. Nothing is locked and nothing is a flat image.

How do I brand them to my company?

+

Add your logo, colors, fonts, and background once. It applies to the whole presentation and the entire slide library at the same time.

Can I mix them with other slides from the library?

+

Yes. Add a BCG matrix slide to any premade template, or pair it with Ansoff or SWOT slides from the library. Branding applies across all of them.

About the BCG matrix

What are the four quadrants of the BCG matrix?

+

Stars, cash cows, question marks, and dogs. Stars have high growth and high share, cash cows low growth and high share, question marks high growth and low share, and dogs low growth and low share.

What's the difference between the BCG matrix and the Ansoff matrix?

+

The BCG matrix assesses the products you already have. The Ansoff matrix looks at where to grow next. Many strategy presentations use both.

Where does a BCG matrix slide go in a presentation?

+

In a portfolio or strategy review, before the investment decisions. It sets out the current position the decisions respond to.

Your next BCG matrix slide is already designed

Pick a layout, brand it in one click, add your content, and export.

Free to start. No credit card required.