
Charts and tables are now structured, editable parts of supported Choladeck slides. Bring in your own data, choose from 13 chart families, refine how the result is presented, and edit table content and layout directly inside the presentation.
The same experience follows your presentation brand, works across desktop and mobile, and carries structured charts and tables into PowerPoint. This update brings data-led slides into the same Choladeck workflow as the rest of your presentation.
Choose the Right Chart for the Message

The chart editor includes 13 chart families for comparisons, trends, composition, relationships, change, and mixed-series presentations. A visual selector lets you preview another chart type before applying it to the current data.
Compare Categories
- Column for vertical comparisons across categories
- Stacked Column for comparing totals and their component series
- Bar for horizontal comparisons, including categories with longer labels
- Stacked Bar for showing composition across horizontal categories
Show Trends and Accumulation
- Line for movement across an ordered sequence
- Stacked Line for several series presented cumulatively
- Area for trends with visual emphasis on magnitude
- Stacked Area for showing how multiple series contribute over time
Explain Composition, Relationships, and Change
- Pie for part-to-whole comparisons in one series
- Doughnut for part-to-whole views with support for concentric series
- Scatter for relationships between X and Y values
- Waterfall for the positive and negative steps behind a total
- Combo for combining different series types and supported secondary-axis views
Switching chart type keeps the data in the editor, allowing you to test which visual structure communicates the point most clearly.
Bring Your Own Data Into the Chart
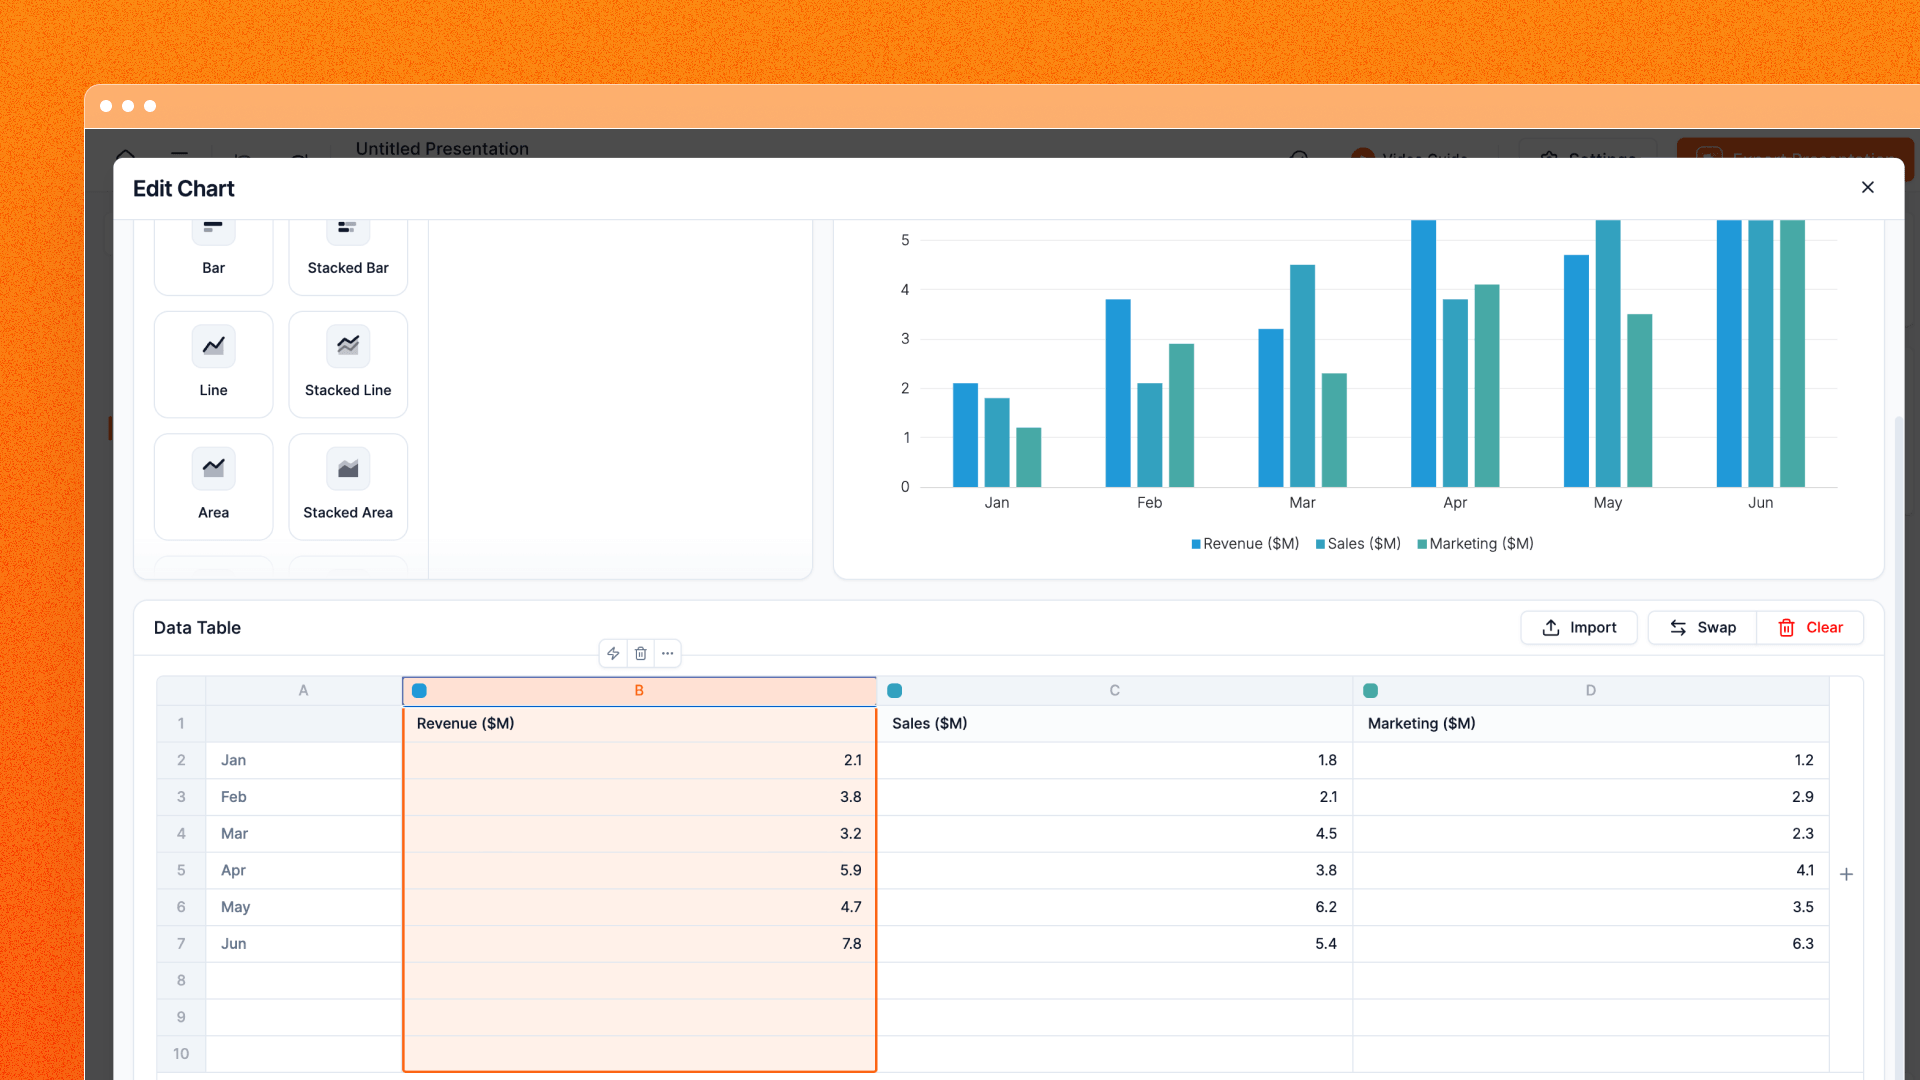
The chart data editor provides a spreadsheet-style workspace for labels and values. Enter data directly, paste a range from a spreadsheet, or replace the chart dataset with a CSV or XLSX file.
Rows and columns can be inserted, deleted, reordered, cleared, hidden, and formatted. Multi-row and multi-column selection makes it possible to apply an action to a complete data block, while copy and paste supports the tabular structure already used in spreadsheet tools.
Importing a file includes a confirmation before the current dataset is replaced. Once the data is in place, the chart preview updates as you work, keeping the numbers and the visual result together.
This workflow is particularly useful for recurring reports, financial updates, market comparisons, survey results, and any slide where the structure stays useful while the underlying numbers change.
Shape How the Chart Communicates
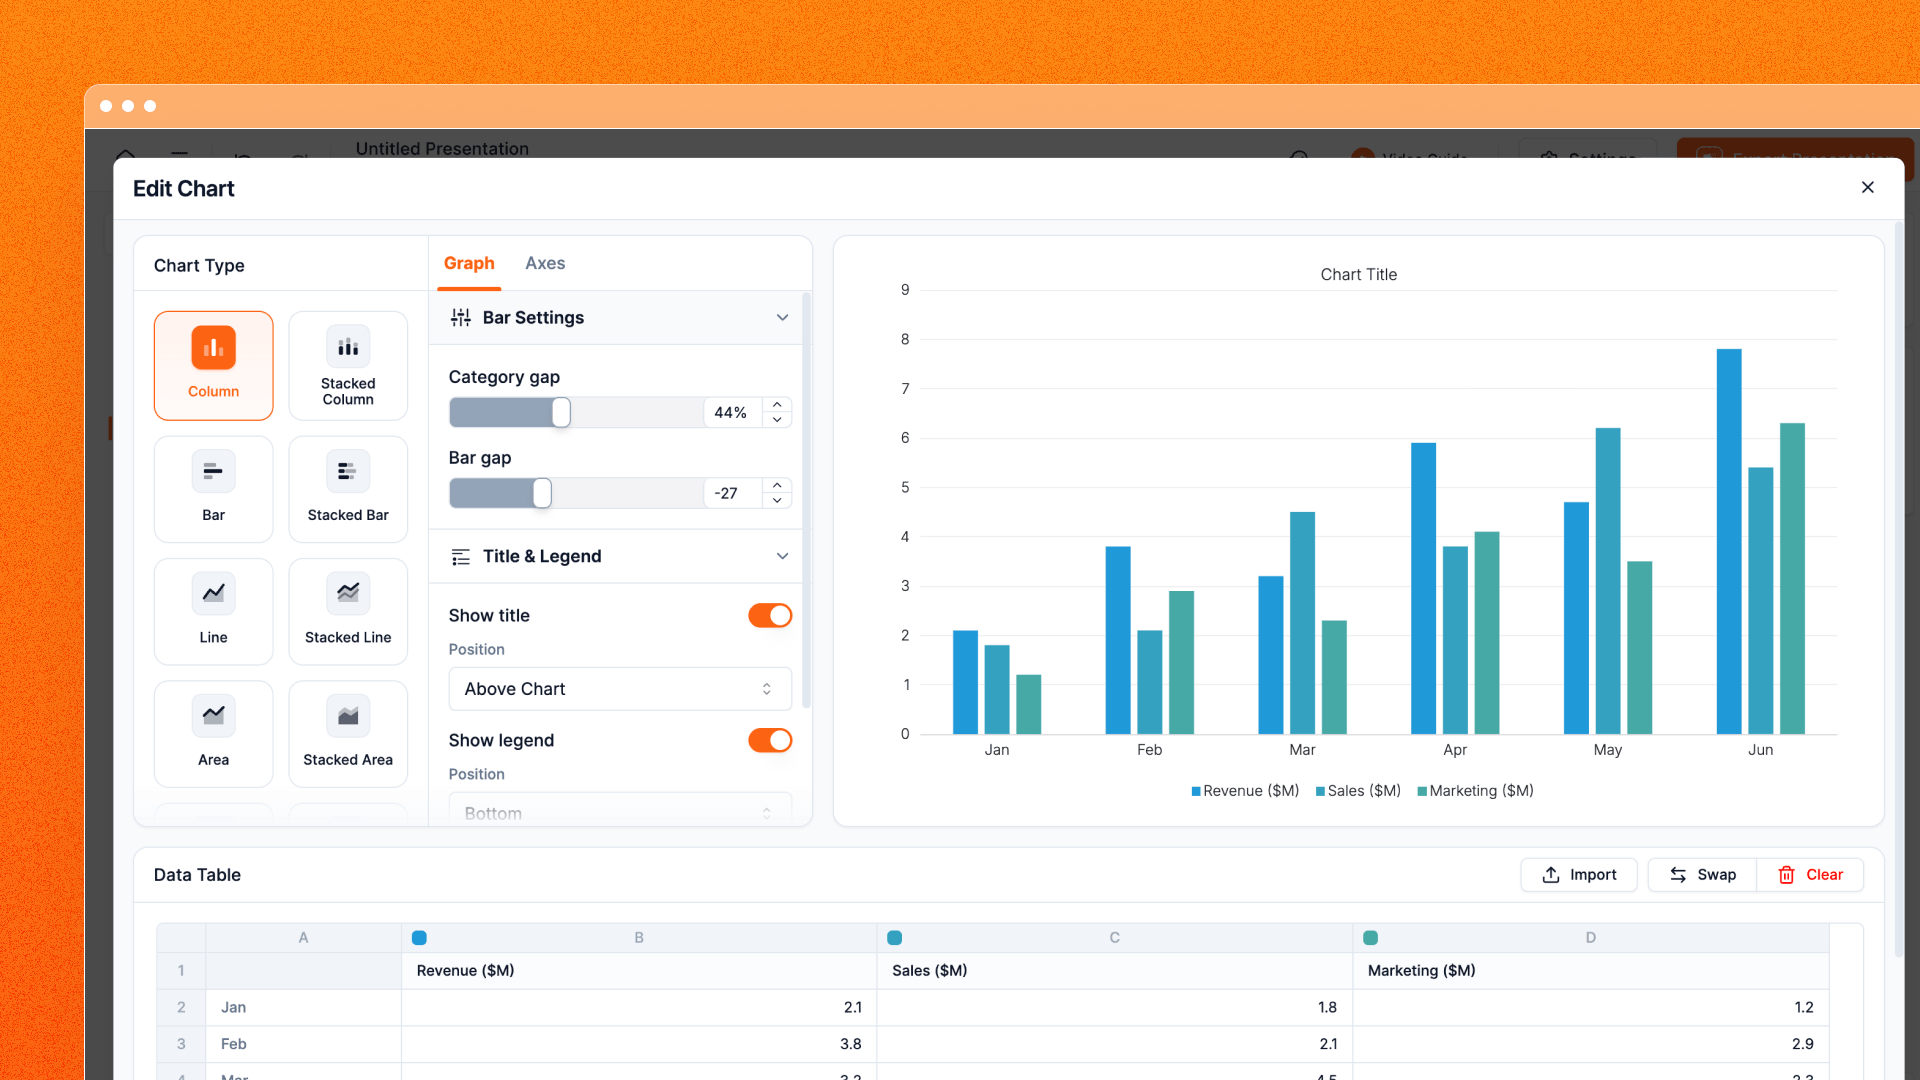
Chart controls cover both the overall composition and the details that make data readable in a presentation.
Titles and legends can be shown and positioned to suit the slide. Axis controls cover visibility, labels, gridlines, number formats, and supported minimum, maximum, and interval choices. Data-label positions, line and marker settings, and bar spacing provide additional control over how each series is presented.
The editor also includes chart-specific options where they matter. Pie and doughnut charts support rotation, explosion, and slice borders. Scatter charts provide X/Y mappings and line modes. Waterfall charts can identify totals, while Combo charts can assign supported chart types and axes by series.
These controls are designed around presentation use, with closer alignment between the chart shown in Choladeck and the version prepared for PowerPoint.
Edit Presentation Tables Directly

Supported presentation tables can be edited as structured content inside the slide. Select one cell or a rectangular group of cells, update the text, and apply formatting across the selection.
Table controls include text formatting, links, lists, fills, borders, padding, and text direction. Rows and columns can be added, removed, resized, or distributed evenly. Cells can also be merged and split where the table structure calls for it.
Keyboard navigation supports moving through cells with arrows and Tab, while copy, paste, Delete, and Backspace behave in a familiar tabular way. Clearing cell content retains the surrounding formatting, helping the designed table remain intact as its content changes.
The result is a table that can carry real presentation content while preserving the visual structure of the original slide.
Edit Charts and Tables From Mobile

Chart and table editing also adapts to phone-sized screens.
The mobile chart experience includes chart settings, graph and axis controls, and a dedicated data table. Rows, columns, and data selections use touch-friendly actions, while chart options open in mobile panels designed around the available screen.
Tables provide mobile access to text, link, fill, border, and padding controls, alongside touch-based row and column actions. Pinch zoom, keyboard-aware positioning, and selection following keep the part being edited visible as the canvas and mobile keyboard change size.
This gives mobile users a practical way to update a number, replace a label, adjust a chart, or revise a table while working away from a desktop.
Keep Data Slides Connected to the Presentation

Charts resolve colors and typography from the presentation’s active branding, helping the data visualisation fit the same visual system as the surrounding slides. When content moves between supported themes, chart and table placement, stacking, proportions, and table styling are reconciled with the destination design.
For content that grows beyond its designed space, Tidy identifies overflowing text and table cells and helps fit the affected slide. The export flow also warns when overflow remains and can take you back to an affected slide before the file is prepared.
Charts and tables remain structured PowerPoint objects in the exported file, preserving editable data and table content for teams that continue working in PowerPoint.
Large previews in Premade Templates and Slide Library also render charts as scalable graphics, with additional handling for sharper and more stable chart thumbnails on iOS.
Availability
Chart and table editing is available for structured charts and tables included in supported Choladeck slides. Open a slide containing one of these elements and select it to access the relevant data and presentation controls.
Normal presentation permissions still apply. The feature supports editing structured elements already included in compatible slide designs; this article does not introduce unrestricted blank chart or table insertion.
Try Charts and Tables in Your Next Presentation
Choose a supported slide with a chart or table, replace its sample content with your own information, and shape the result around the message you need to present. Use the chart family that fits the data, apply the presentation controls that improve readability, and keep the final result connected to your brand and PowerPoint workflow.
Open Choladeck and explore a chart or table slide from Premade Templates or Slide Library.