
Professional, editable charts and tables for your presentations
Every chart and table you need, professionally designed and ready for your numbers. Drop in your data, match it to your brand, and export to PowerPoint with everything still fully editable.
Free to start. No credit card required.
Trusted by thousands of professionals and teams worldwide










Good numbers deserve better
than a basic chart
Building charts is slow, they rarely look good, and they break the moment you export.
Building a chart takes too long.
You insert it, type in the numbers, then fix the axis and the styling. That's time going into formatting instead of the actual work.
The result looks basic and homemade.
Default charts come out with default styling. So the slide doesn't look professional, no matter how good the work behind it is.
Your data ends up looking flat.
A plain chart just puts the numbers on screen. So people read the numbers instead of seeing your point.
It doesn't match the rest of your presentation.
Charts come out in the tool's default colors, not yours. So the presentation stops looking like one piece of work.
Charts break when you export.
Most tools flatten your chart into an image. So you can't change anything, and you end up rebuilding it.
You're not always sure which chart to use.
Bar, line, waterfall, or something else. So the wrong choice makes good data harder to follow.
Professional charts and tables
for every kind of data
Designed to look professional, ready for your numbers, editable everywhere.
Charts and tables
Build any chart in seconds, edit it forever
Choladeck gives you professionally designed charts and tables for every kind of data you need to present. Pick the chart that fits, drop in your numbers, and it looks polished and on brand from the start. No building from scratch, no fighting with formatting. Everything stays fully editable, inside the platform and after you export.
Try Choladeck free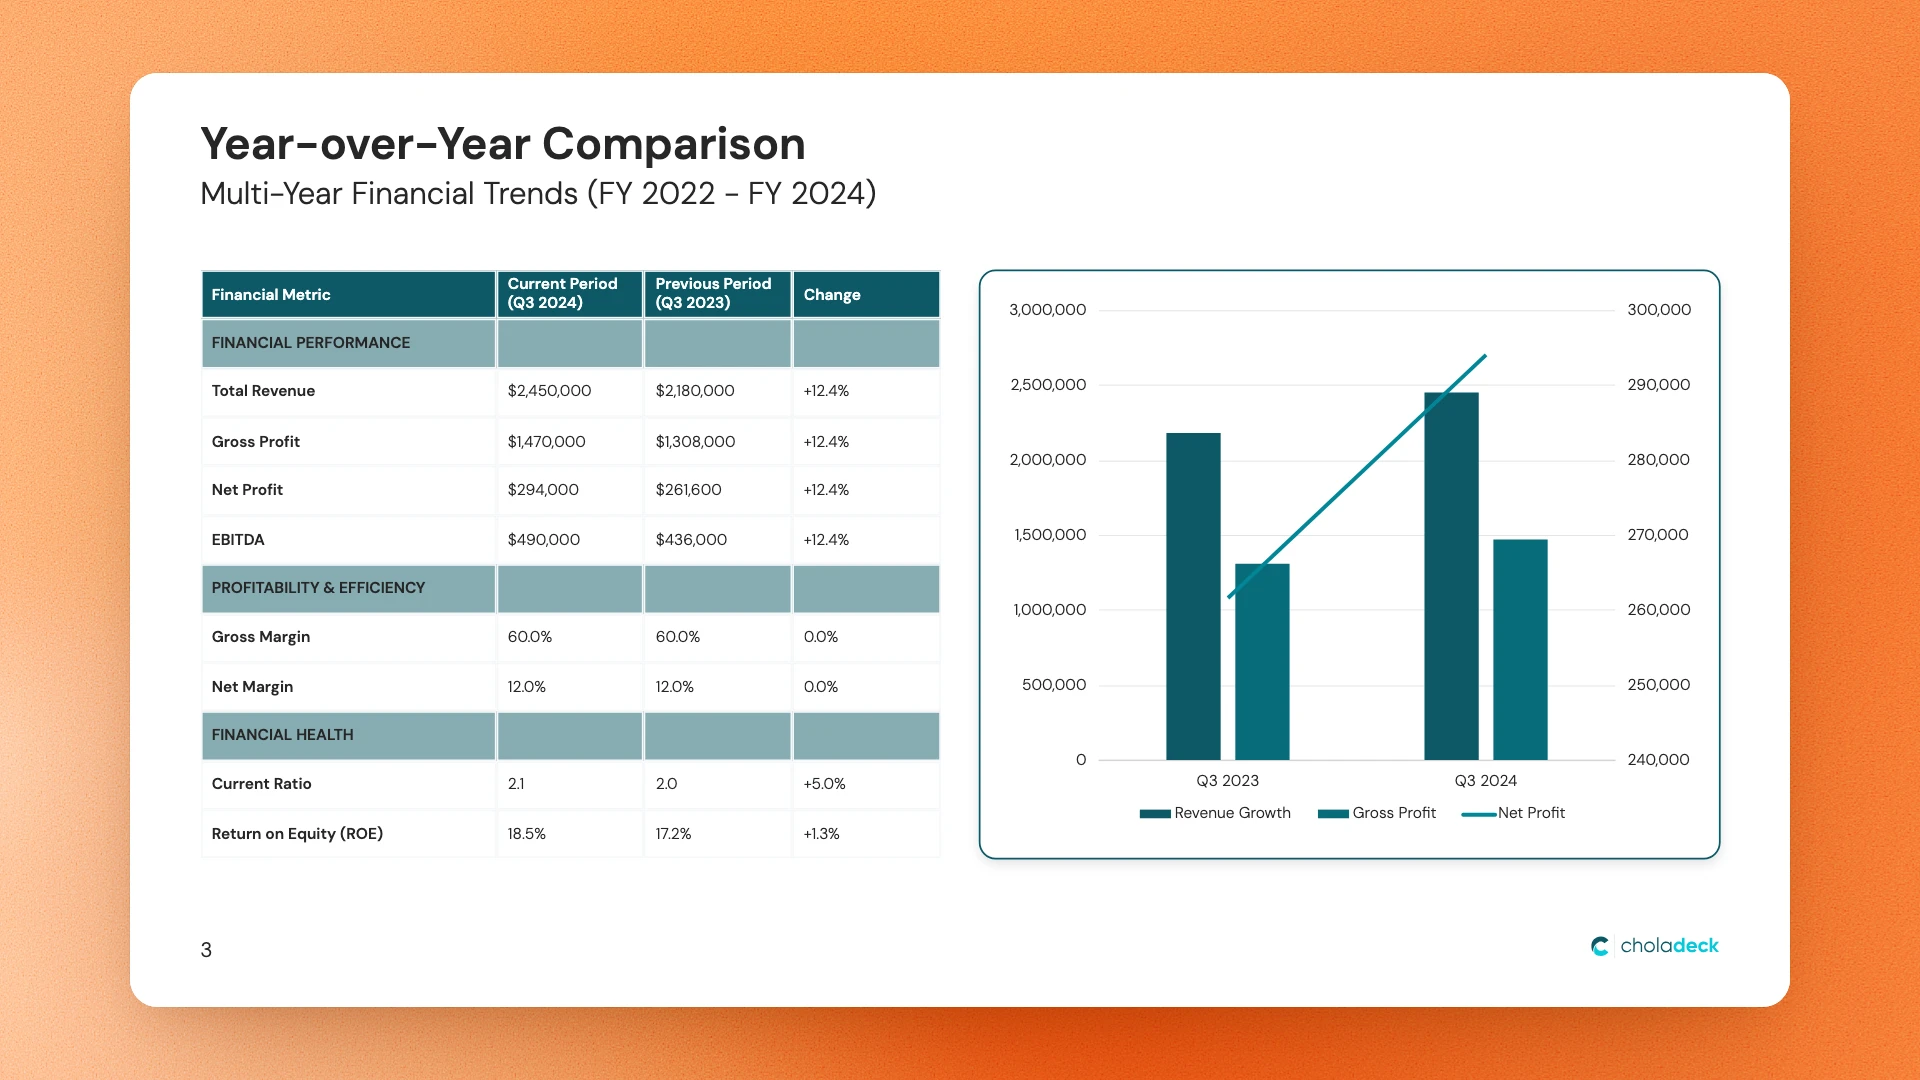
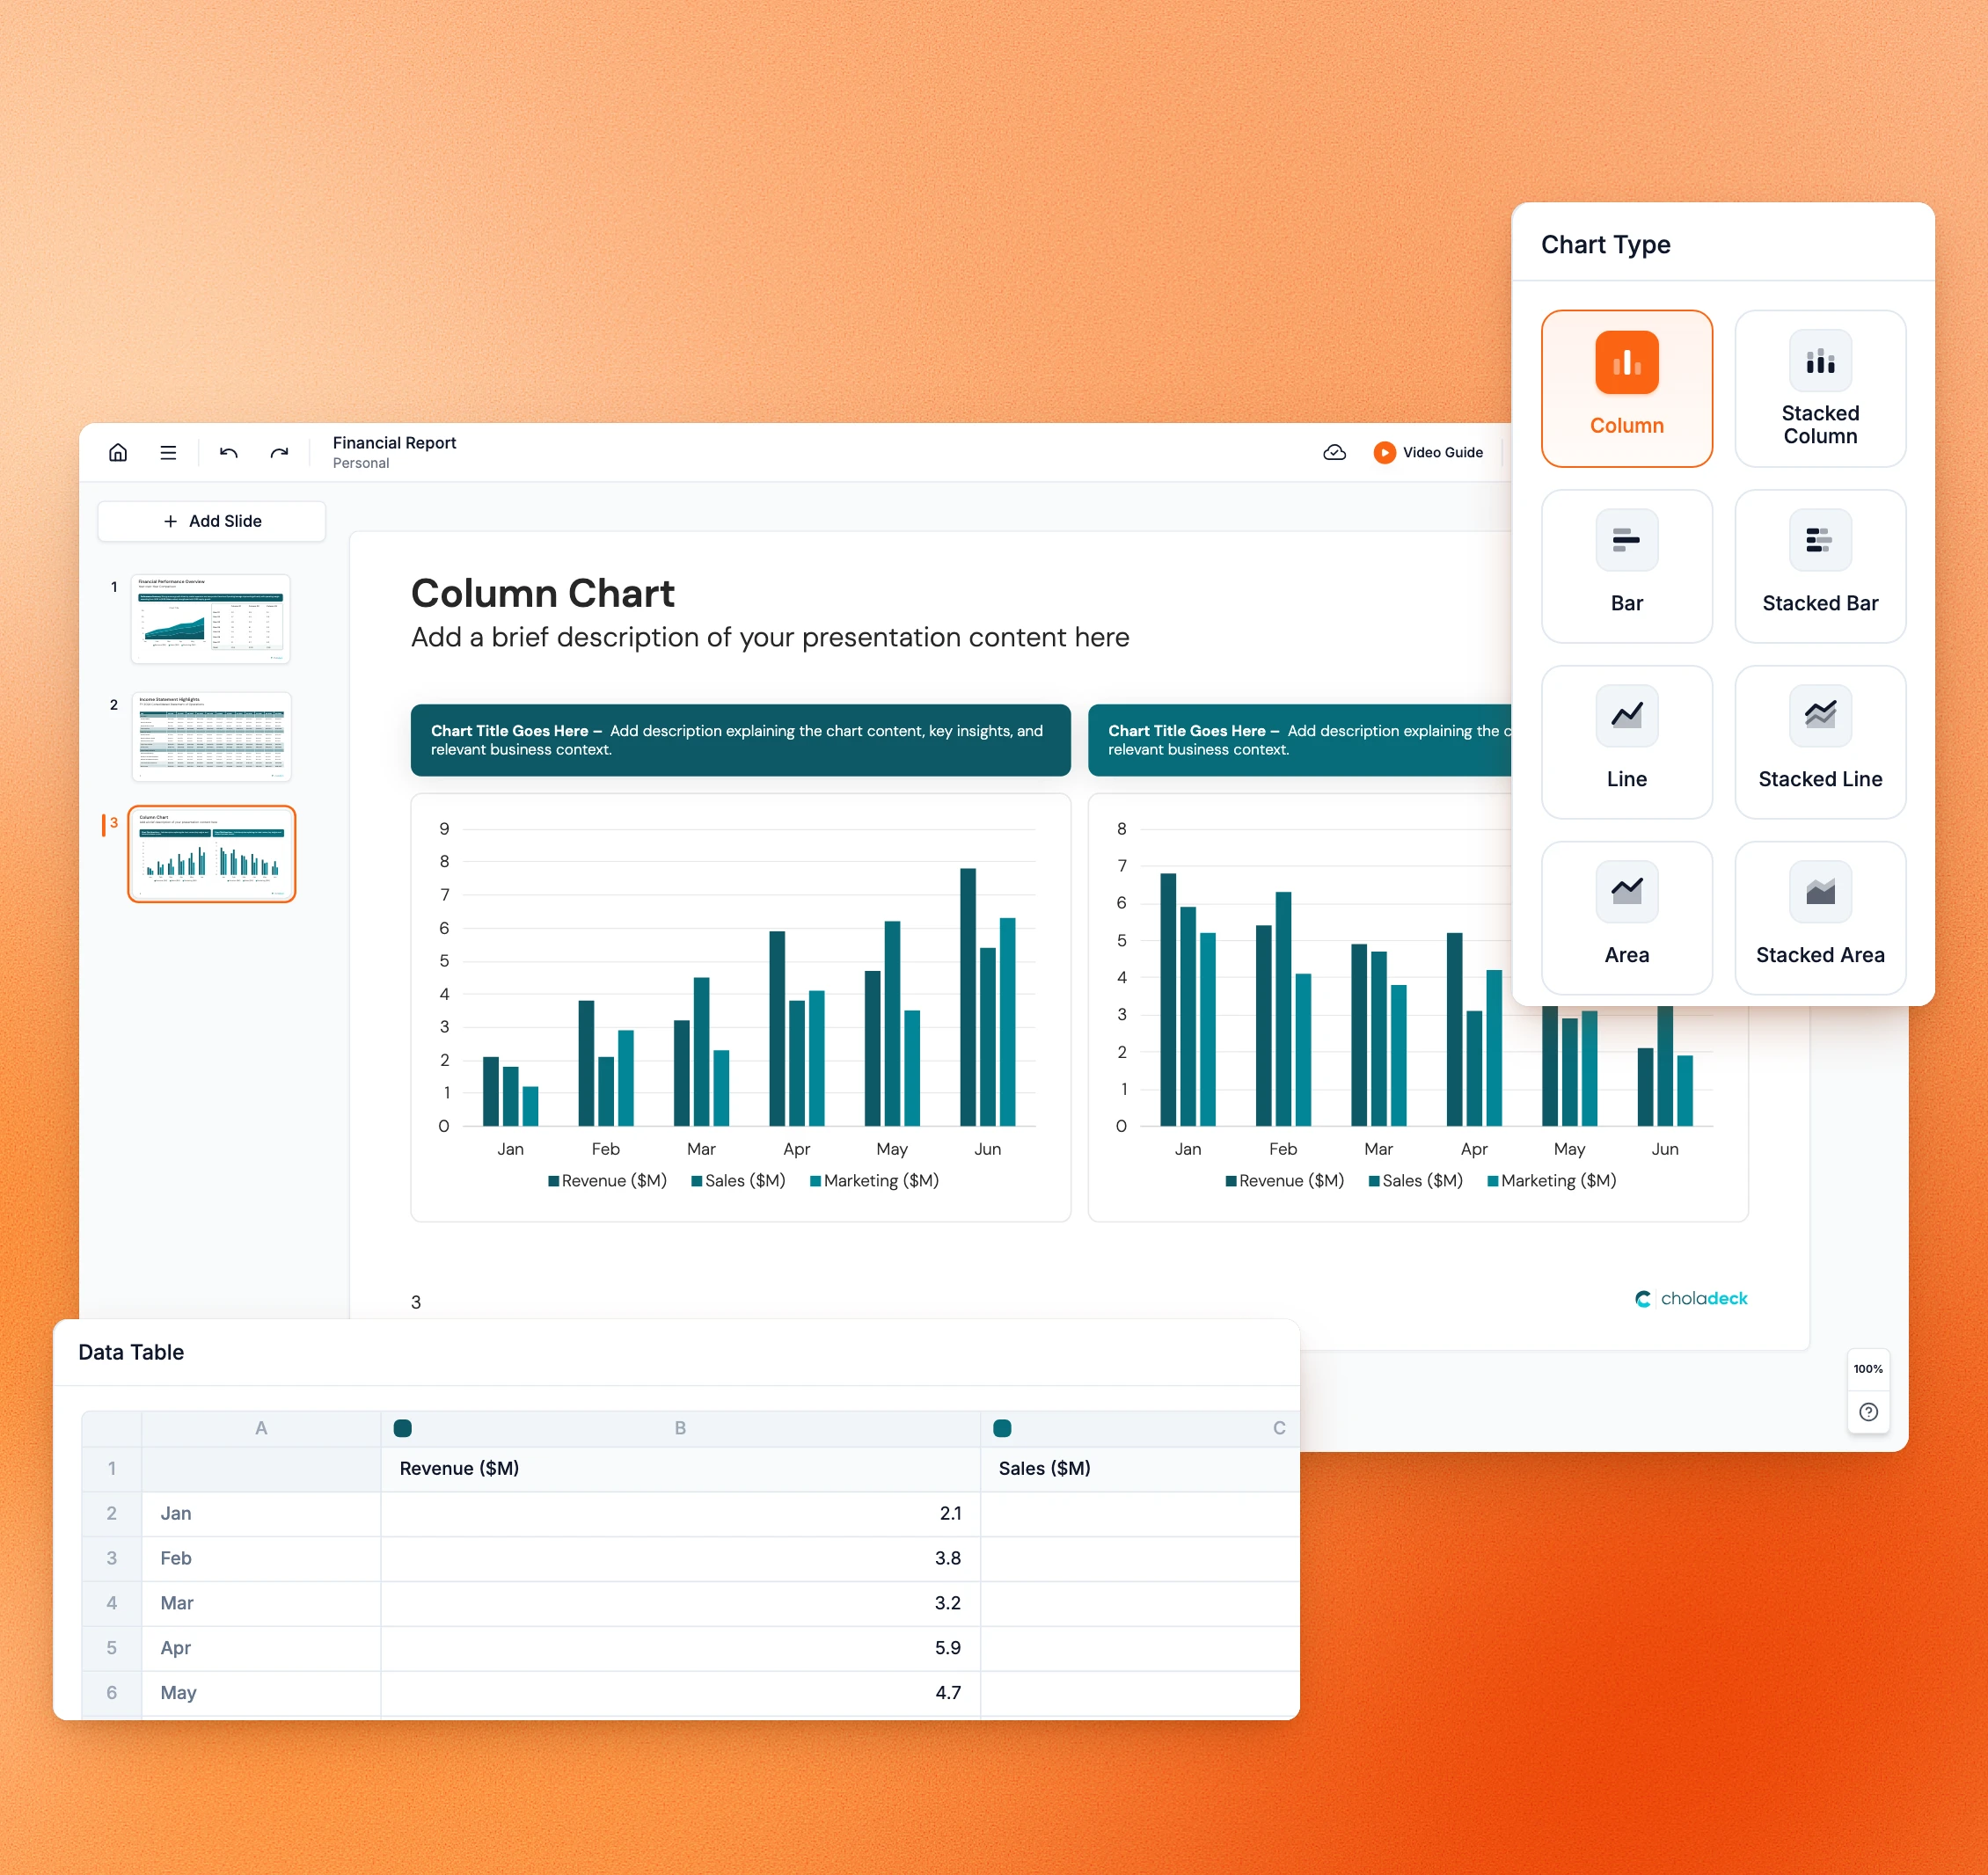
Every chart looks professional.
Designed to present well, so your data lands instead of sitting flat on the slide. Every chart looks like it was made by a designer.
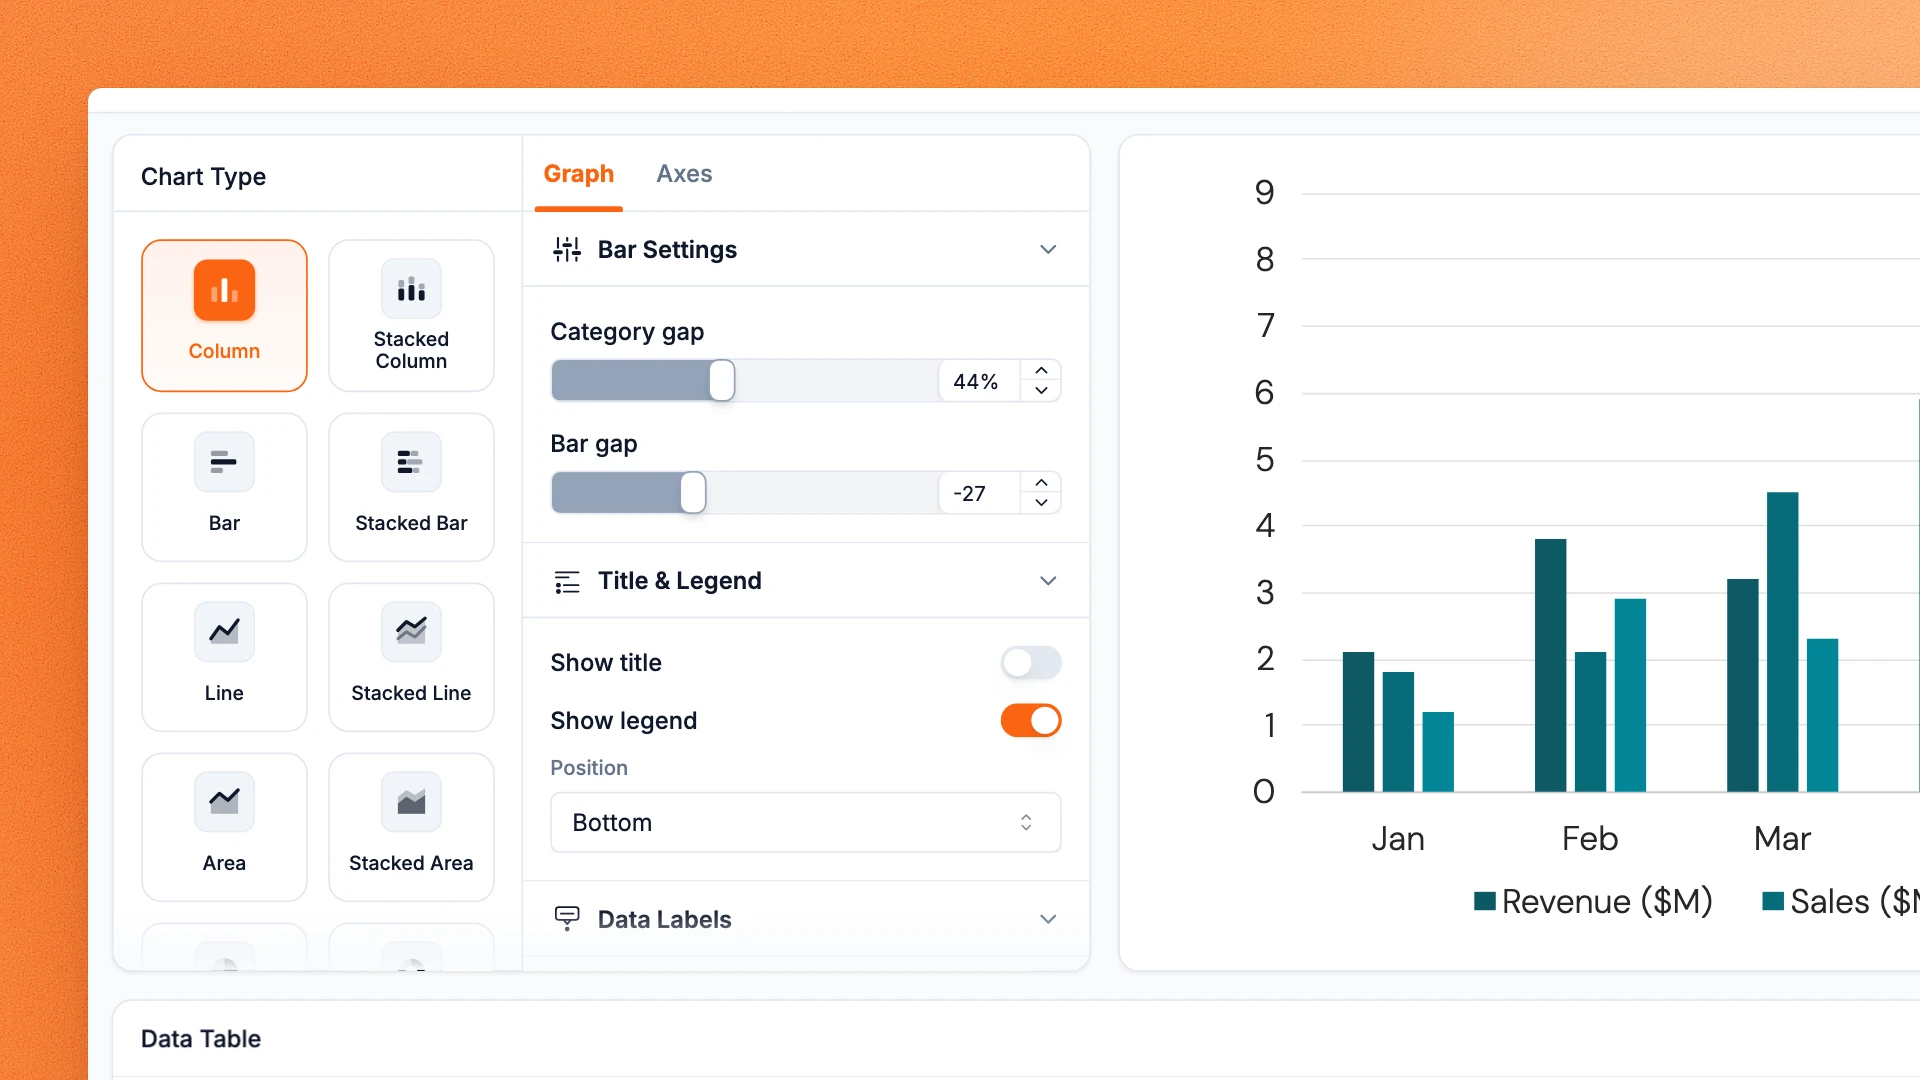
The right chart for any data.
From simple comparisons to waterfalls and combos, there's a chart type for whatever you're showing. 13 types, ready to use.
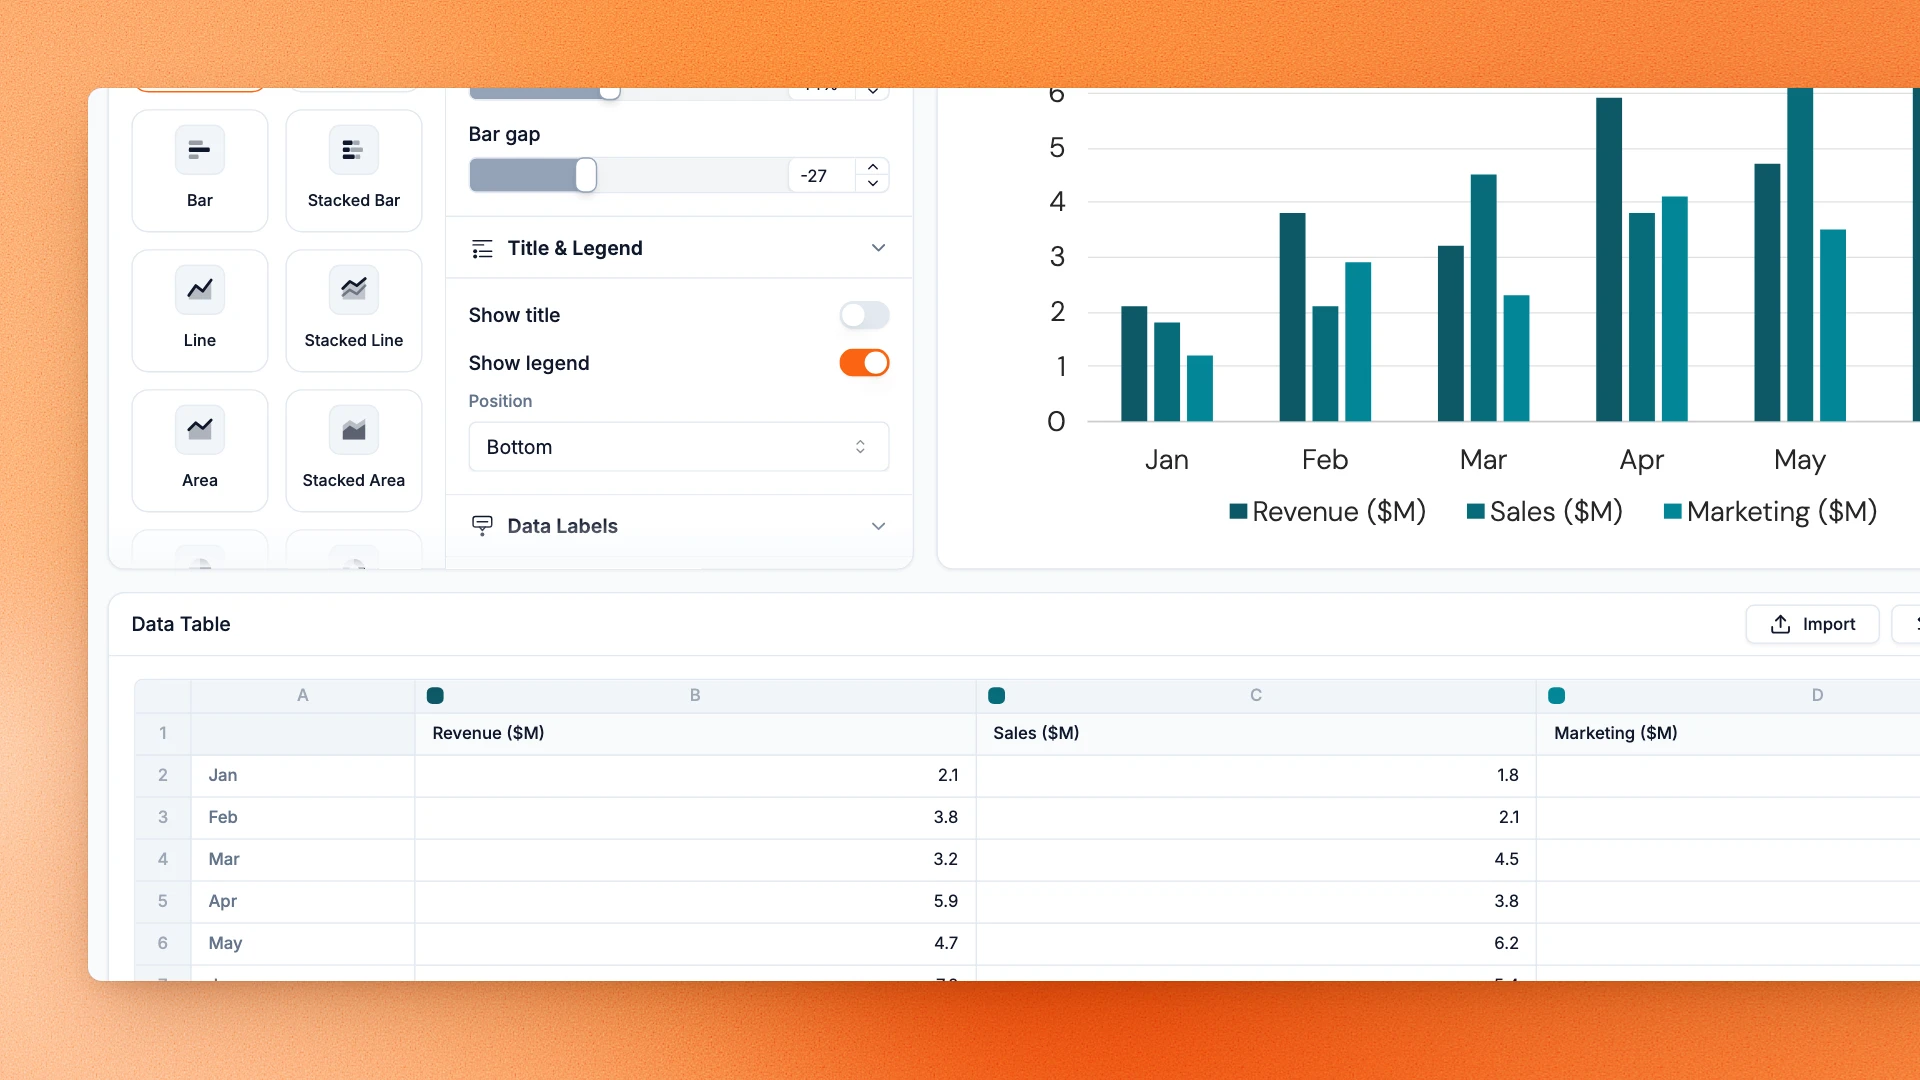
Just drop in your numbers.
Pick a chart, add your data, and it's done. Professionally designed and formatted from the start.
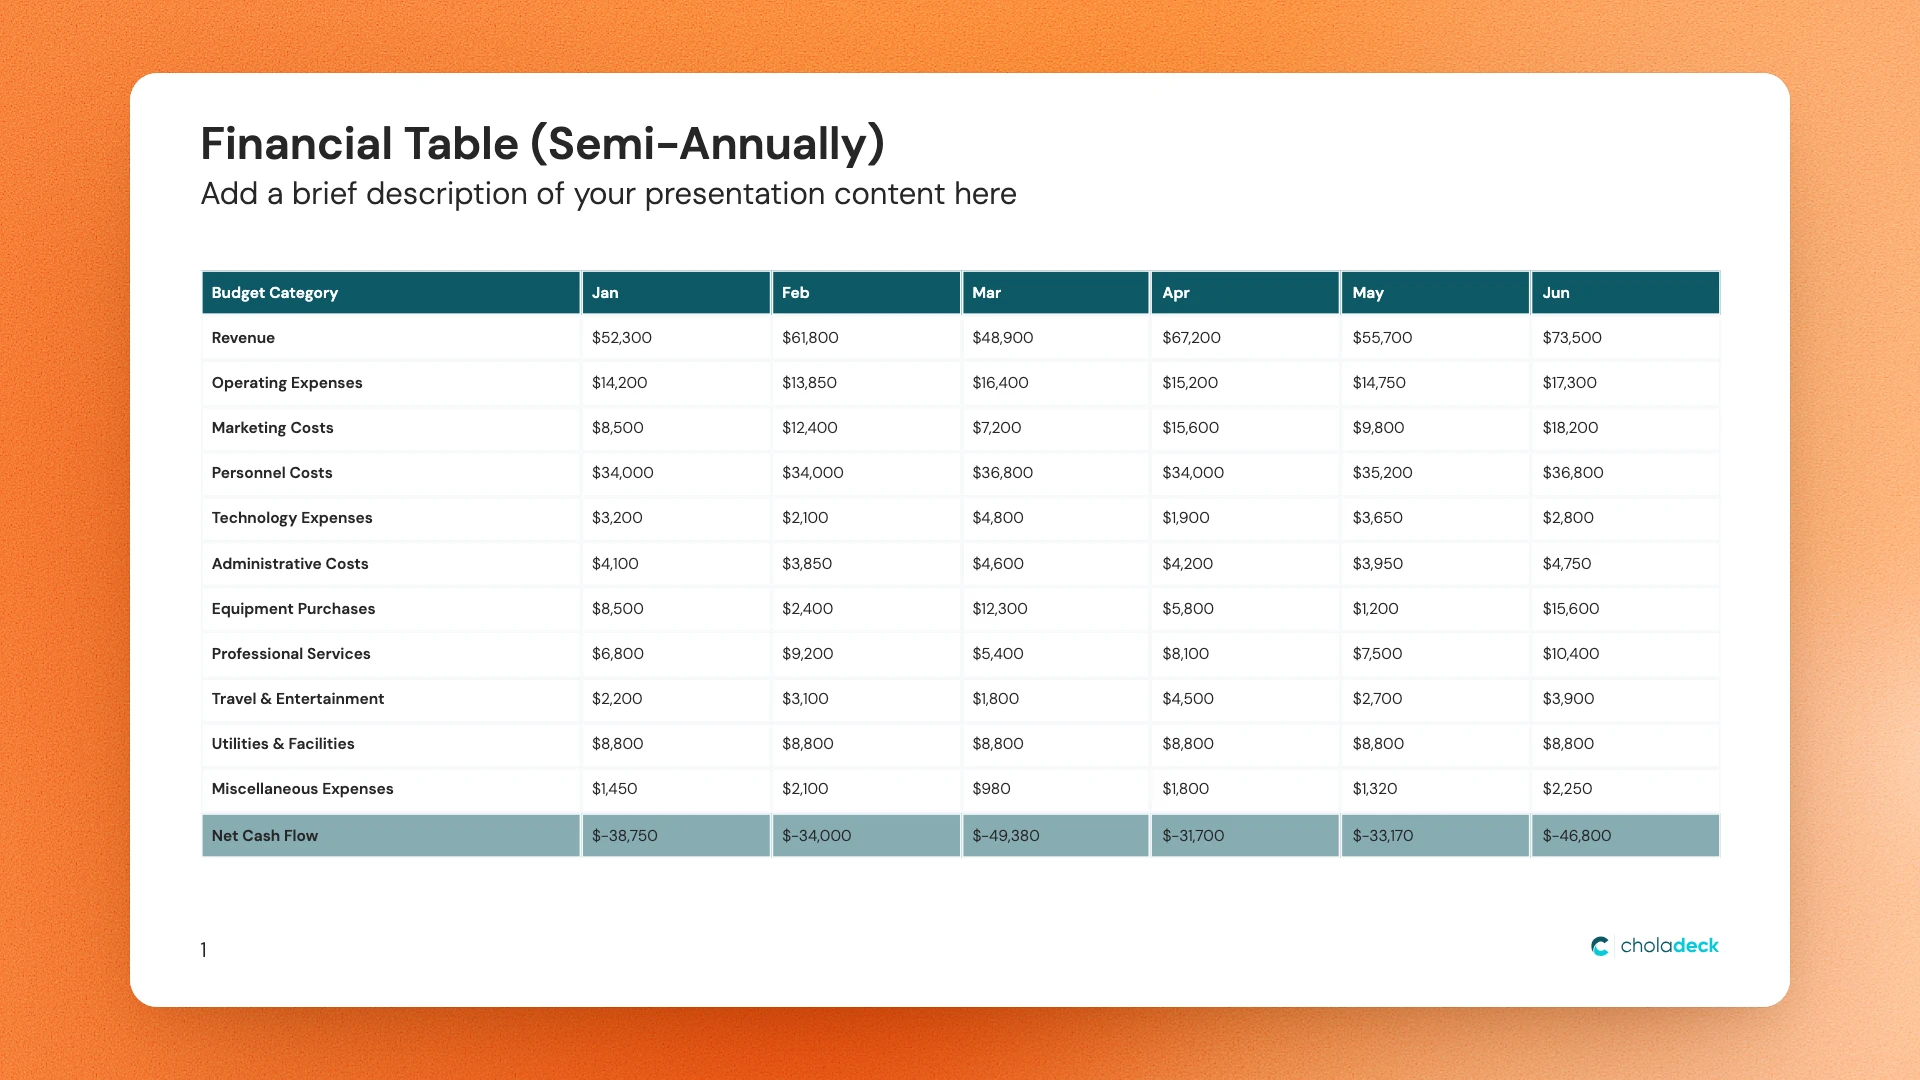
Tables, done right.
Real, flexible tables, just like PowerPoint. Add a row or column and the layout holds.
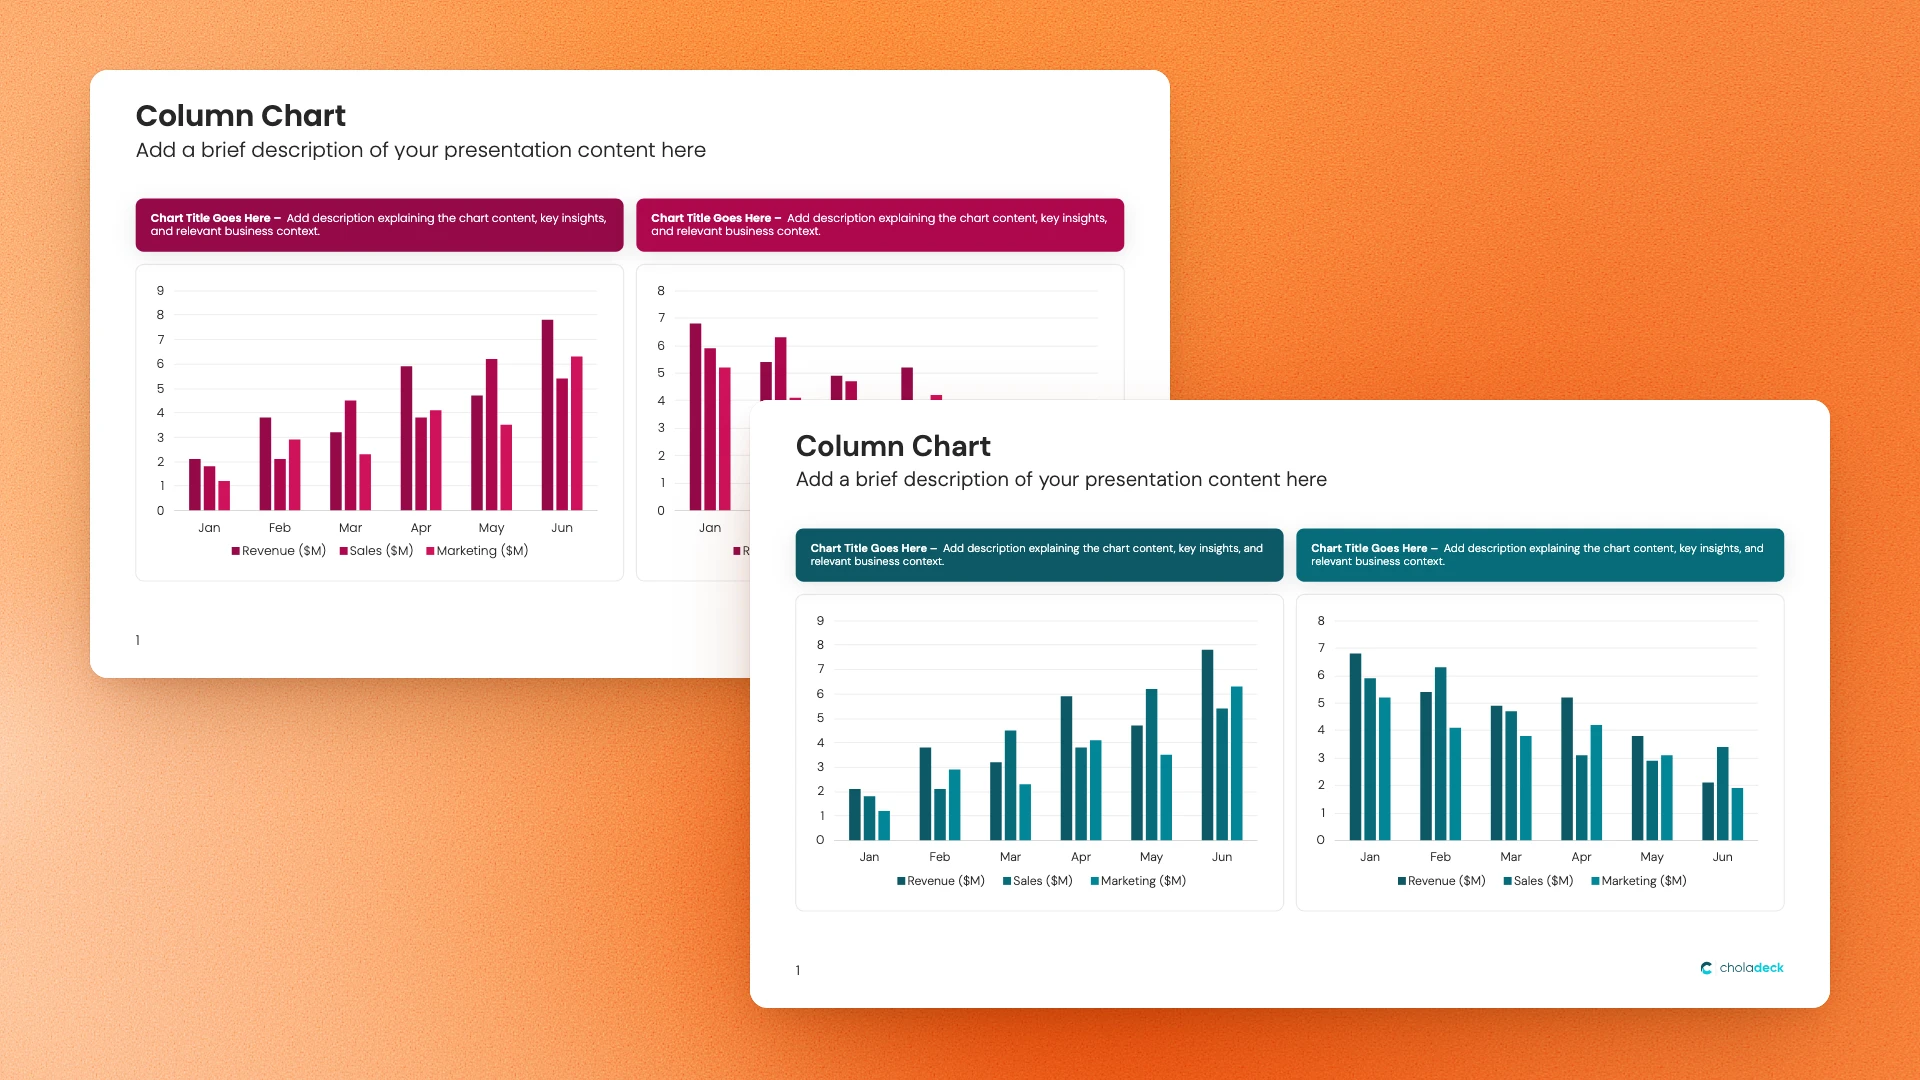
On brand, automatically.
Your charts and tables carry your colors and style, so they match the rest of your presentation. Everything looks like one piece of work.
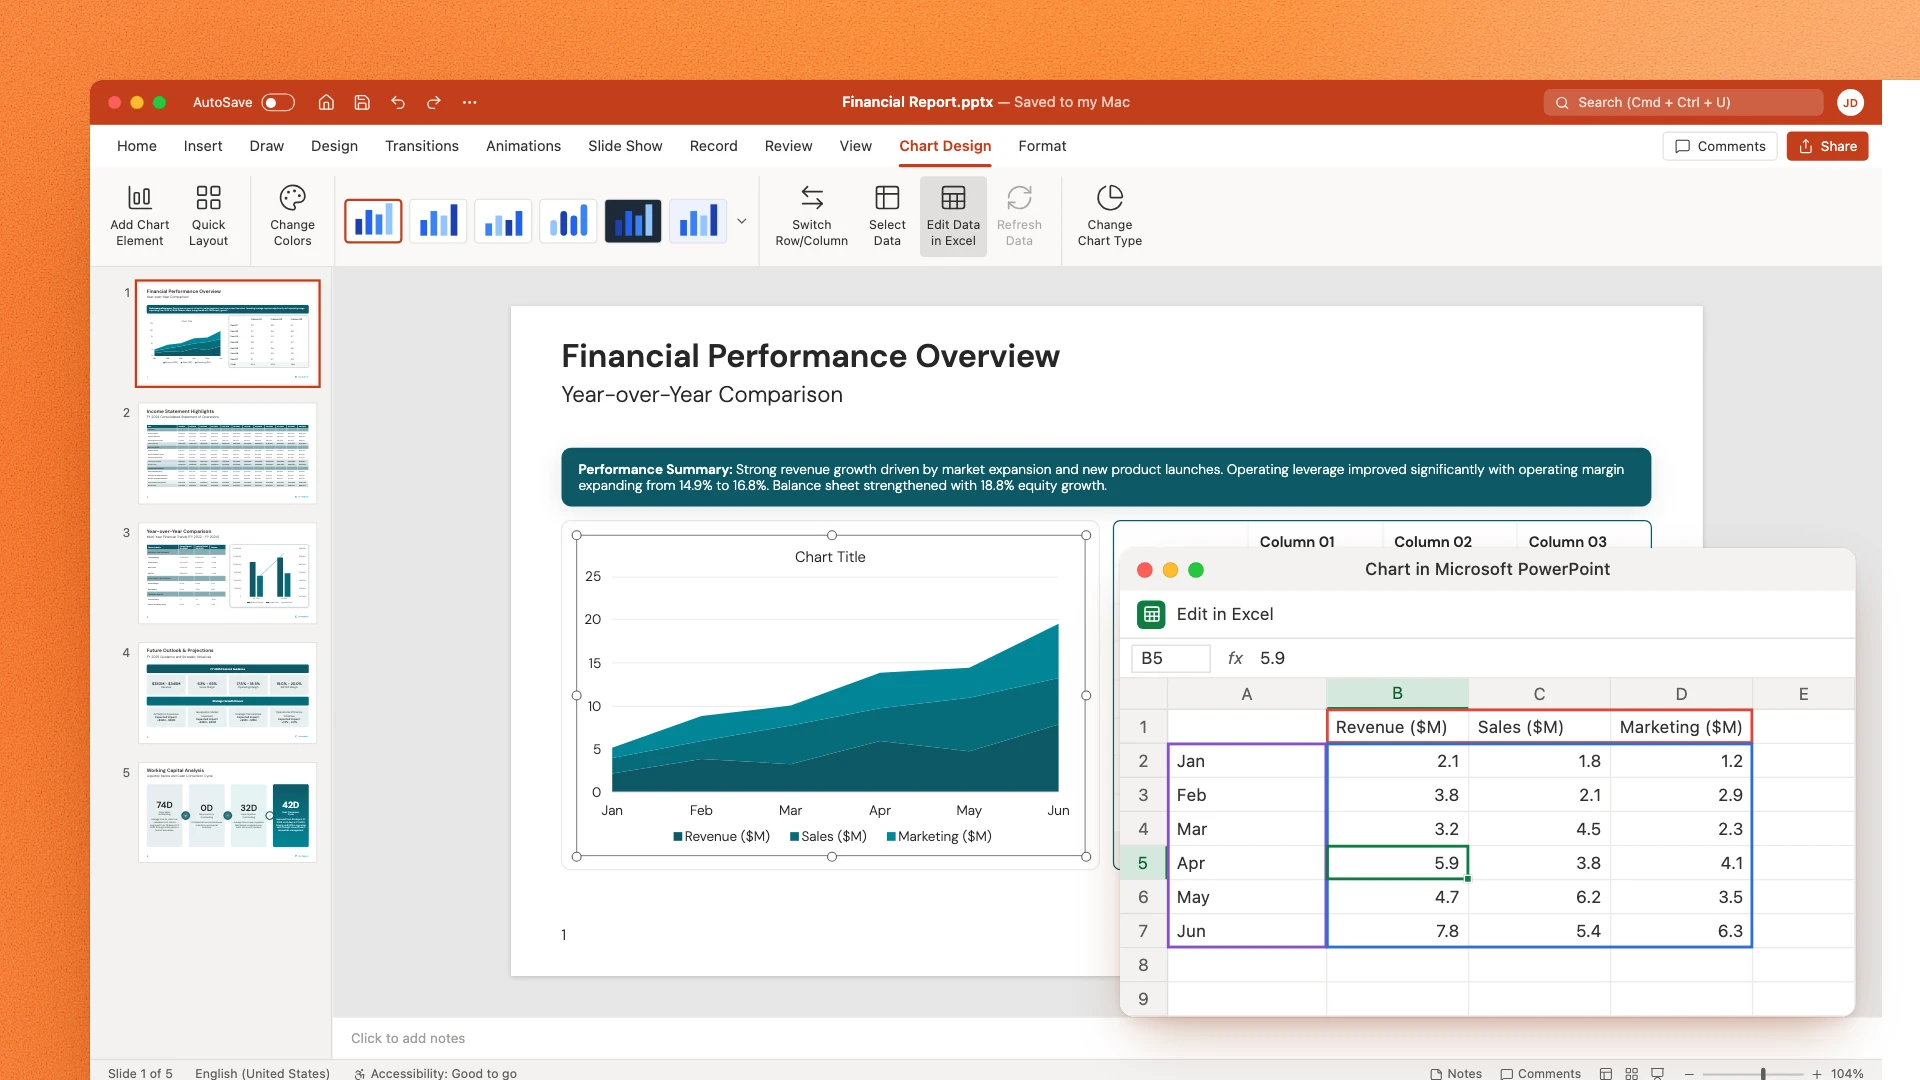
Editable everywhere, even after export.
Change a number in Choladeck or in PowerPoint after you export. Your charts stay fully editable wherever you open them.
A chart or table for every kind of data
13 chart types, full tables, and layouts built for your key numbers.
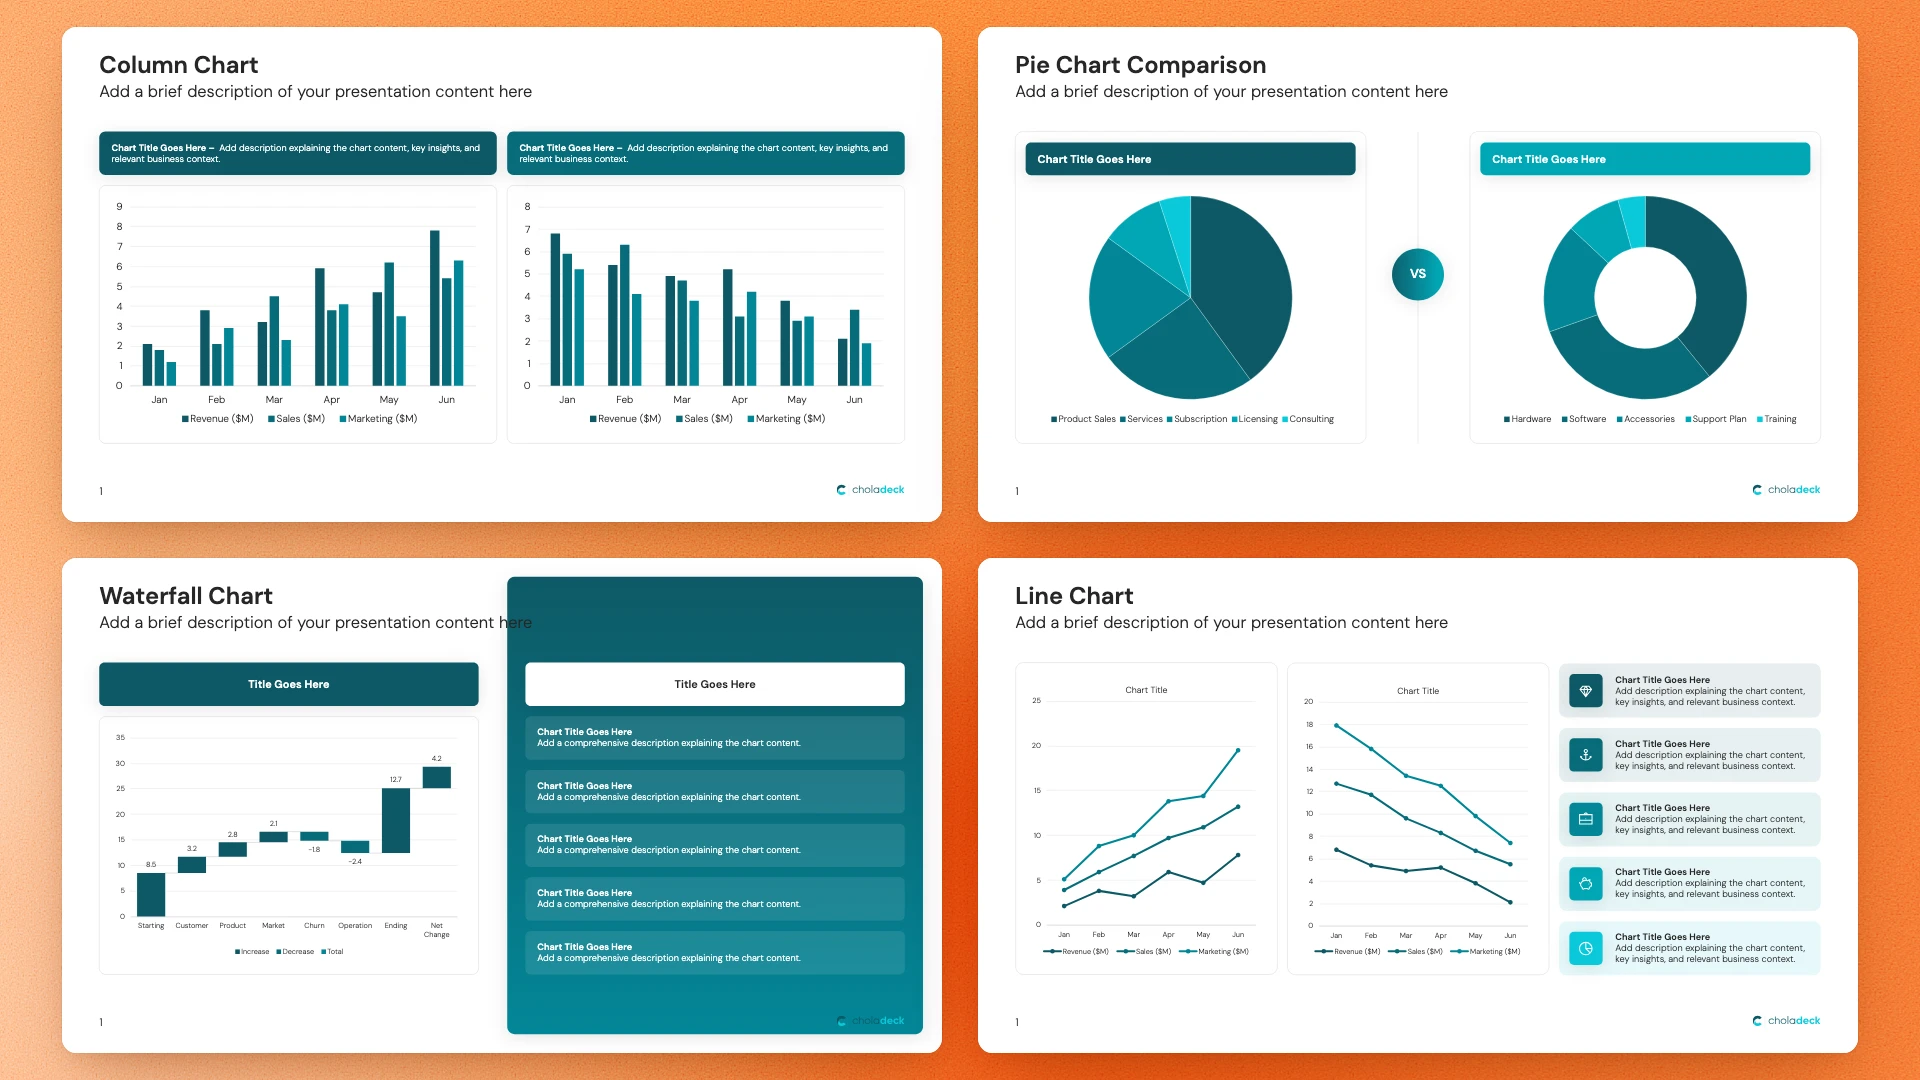
Charts
Column, stacked column, bar, stacked bar, line, stacked line, area, stacked area, pie, doughnut, scatter, waterfall, and combo.
Learn more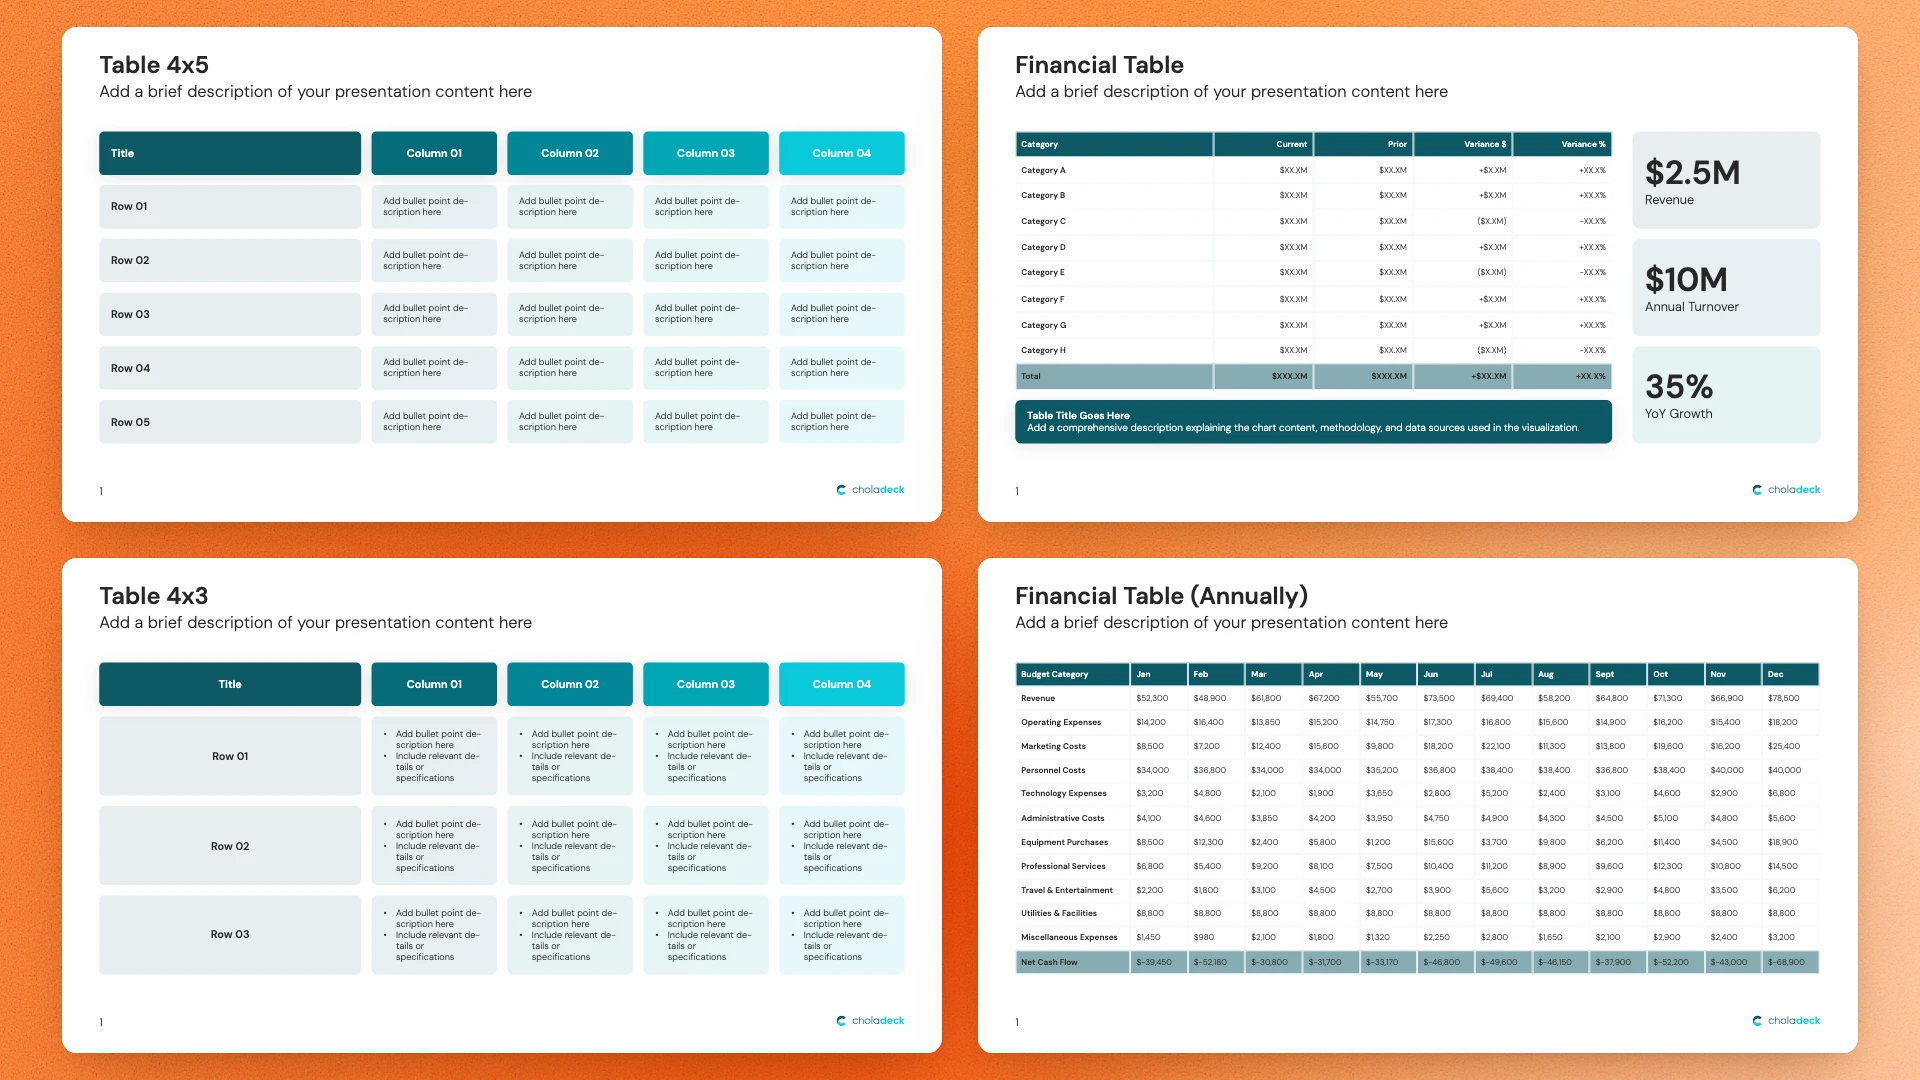
Tables
Full, flexible tables for laying out any data, with as many rows and columns as you need.
Learn more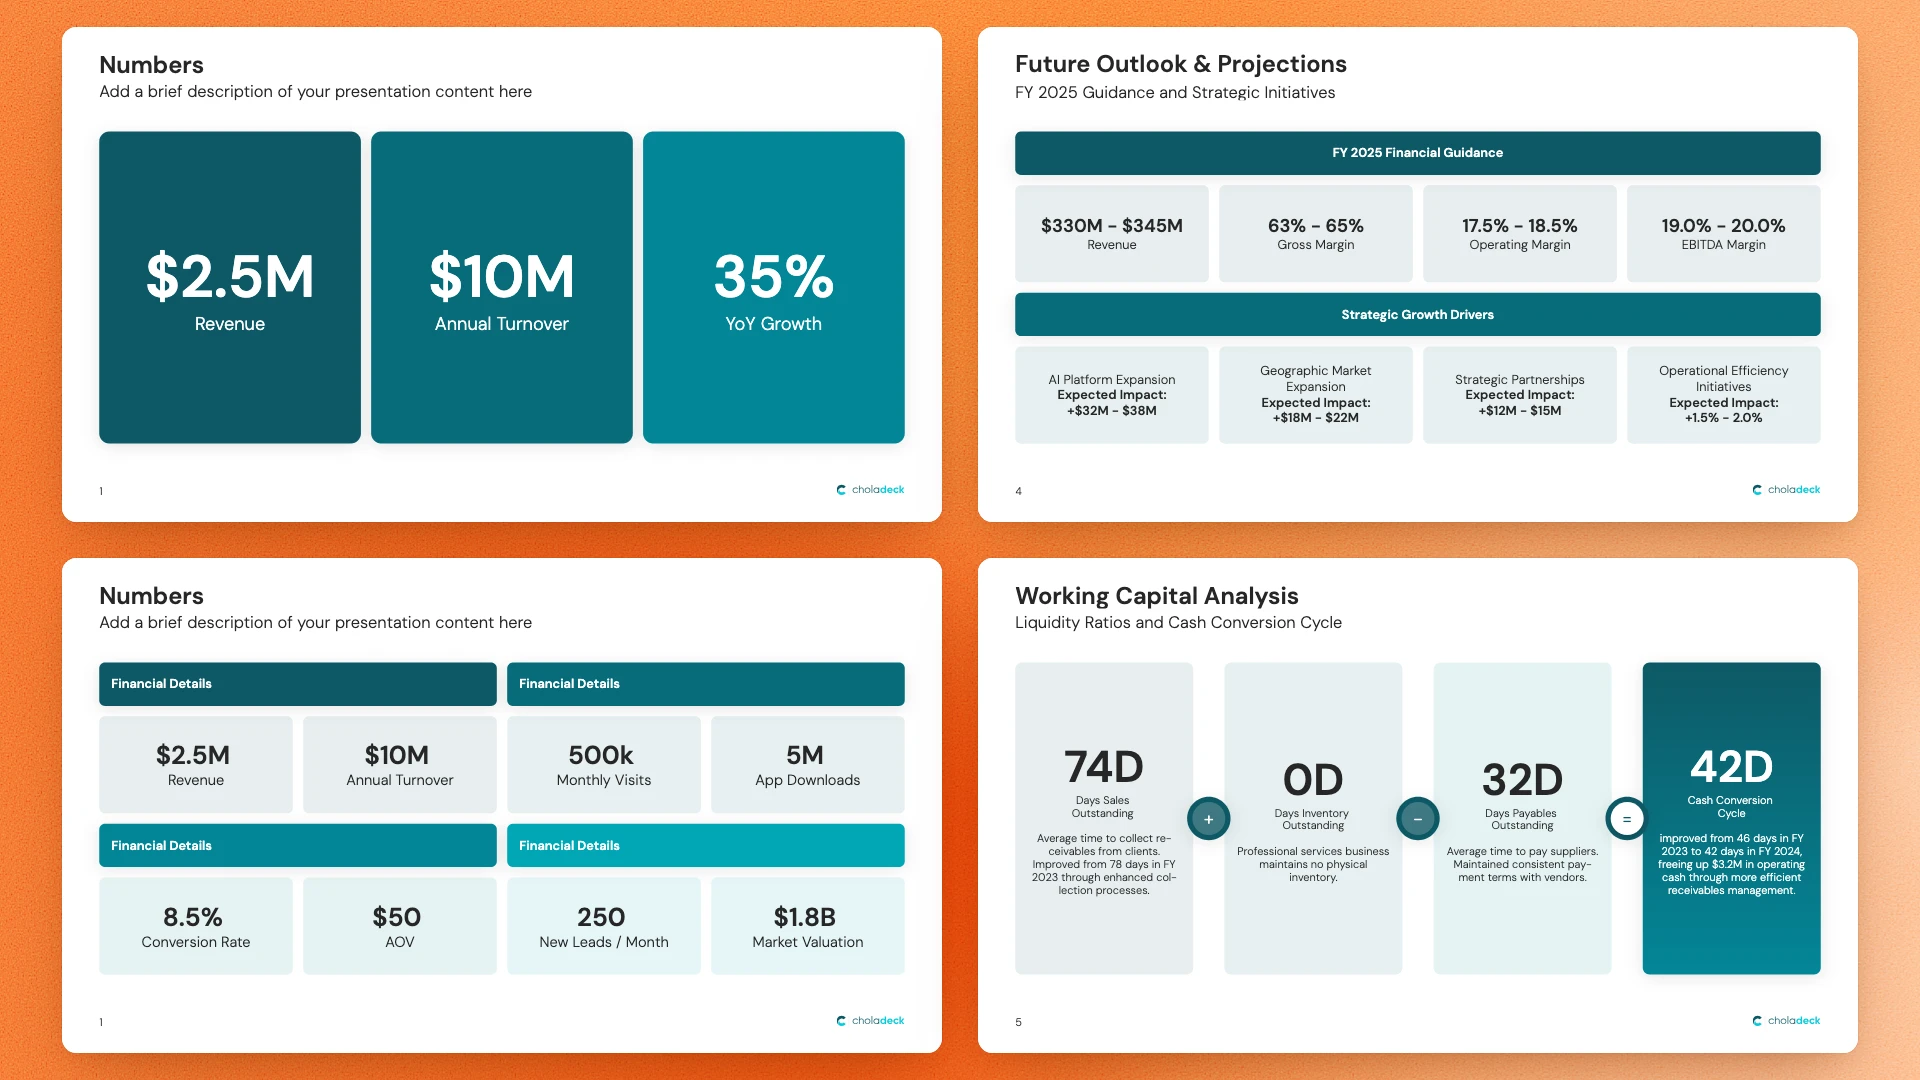
From your numbers to a finished chart in seconds
Pick a chart, add your data, and it stays editable from start to finish.
STEP 01
Choose the type that fits your data, already professionally designed and on brand.
STEP 02
Paste your data straight from Excel, or type it in. The chart or table updates live as you type.
STEP 03
Send your presentation to PowerPoint, Google Slides, or Keynote. Click any chart and the data opens, ready to change.
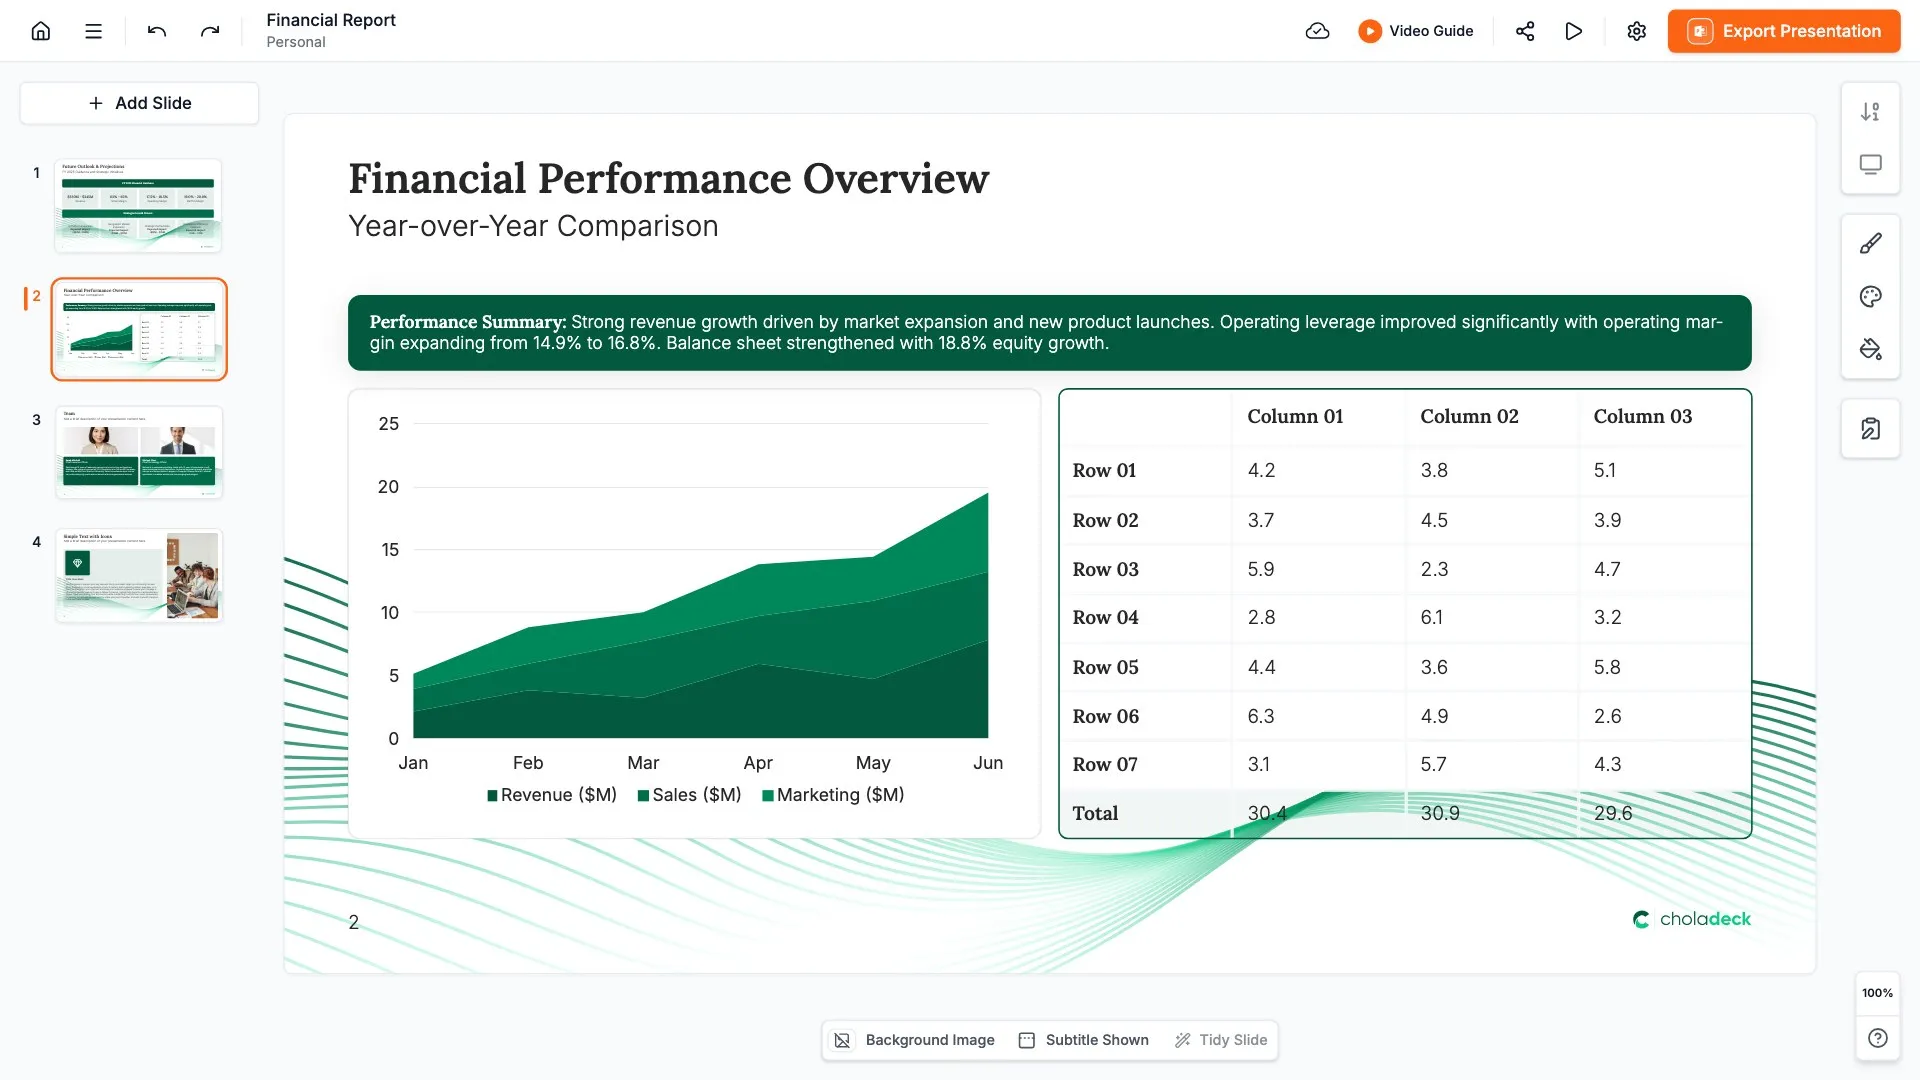
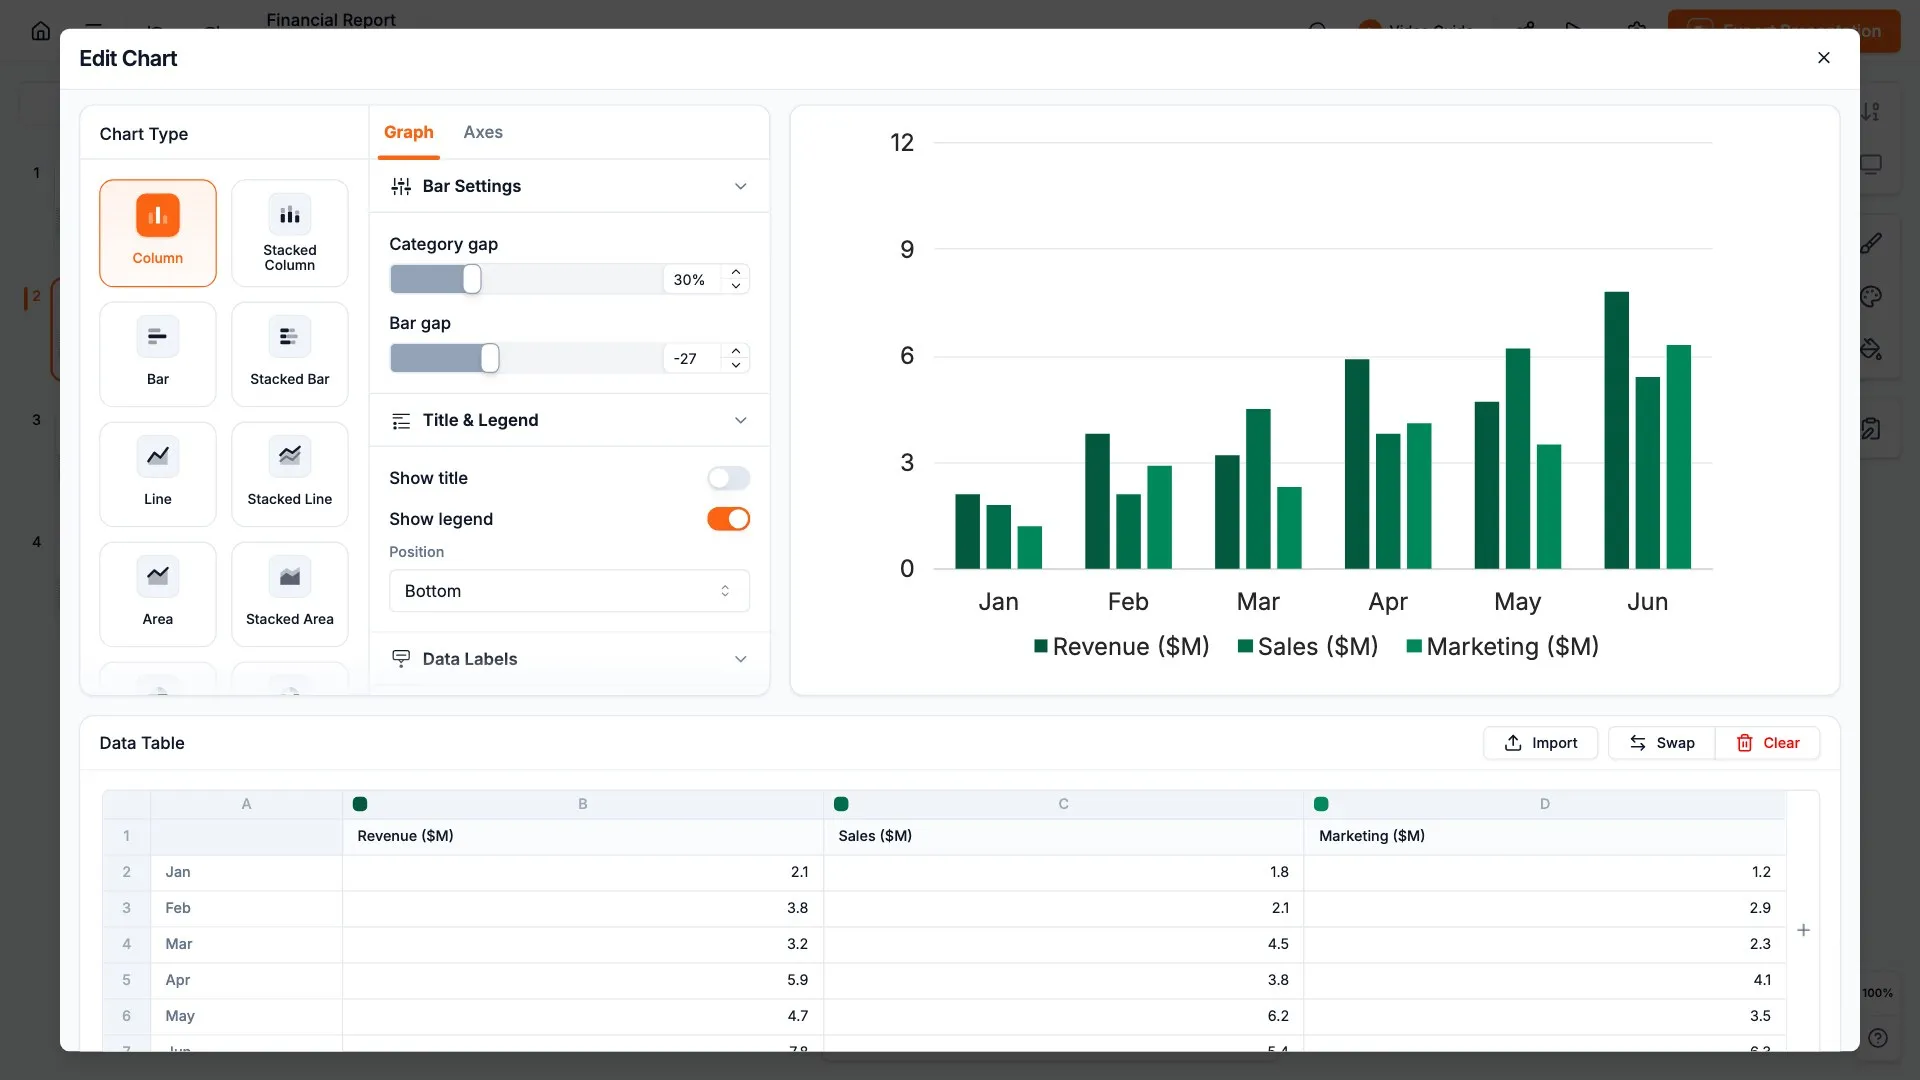
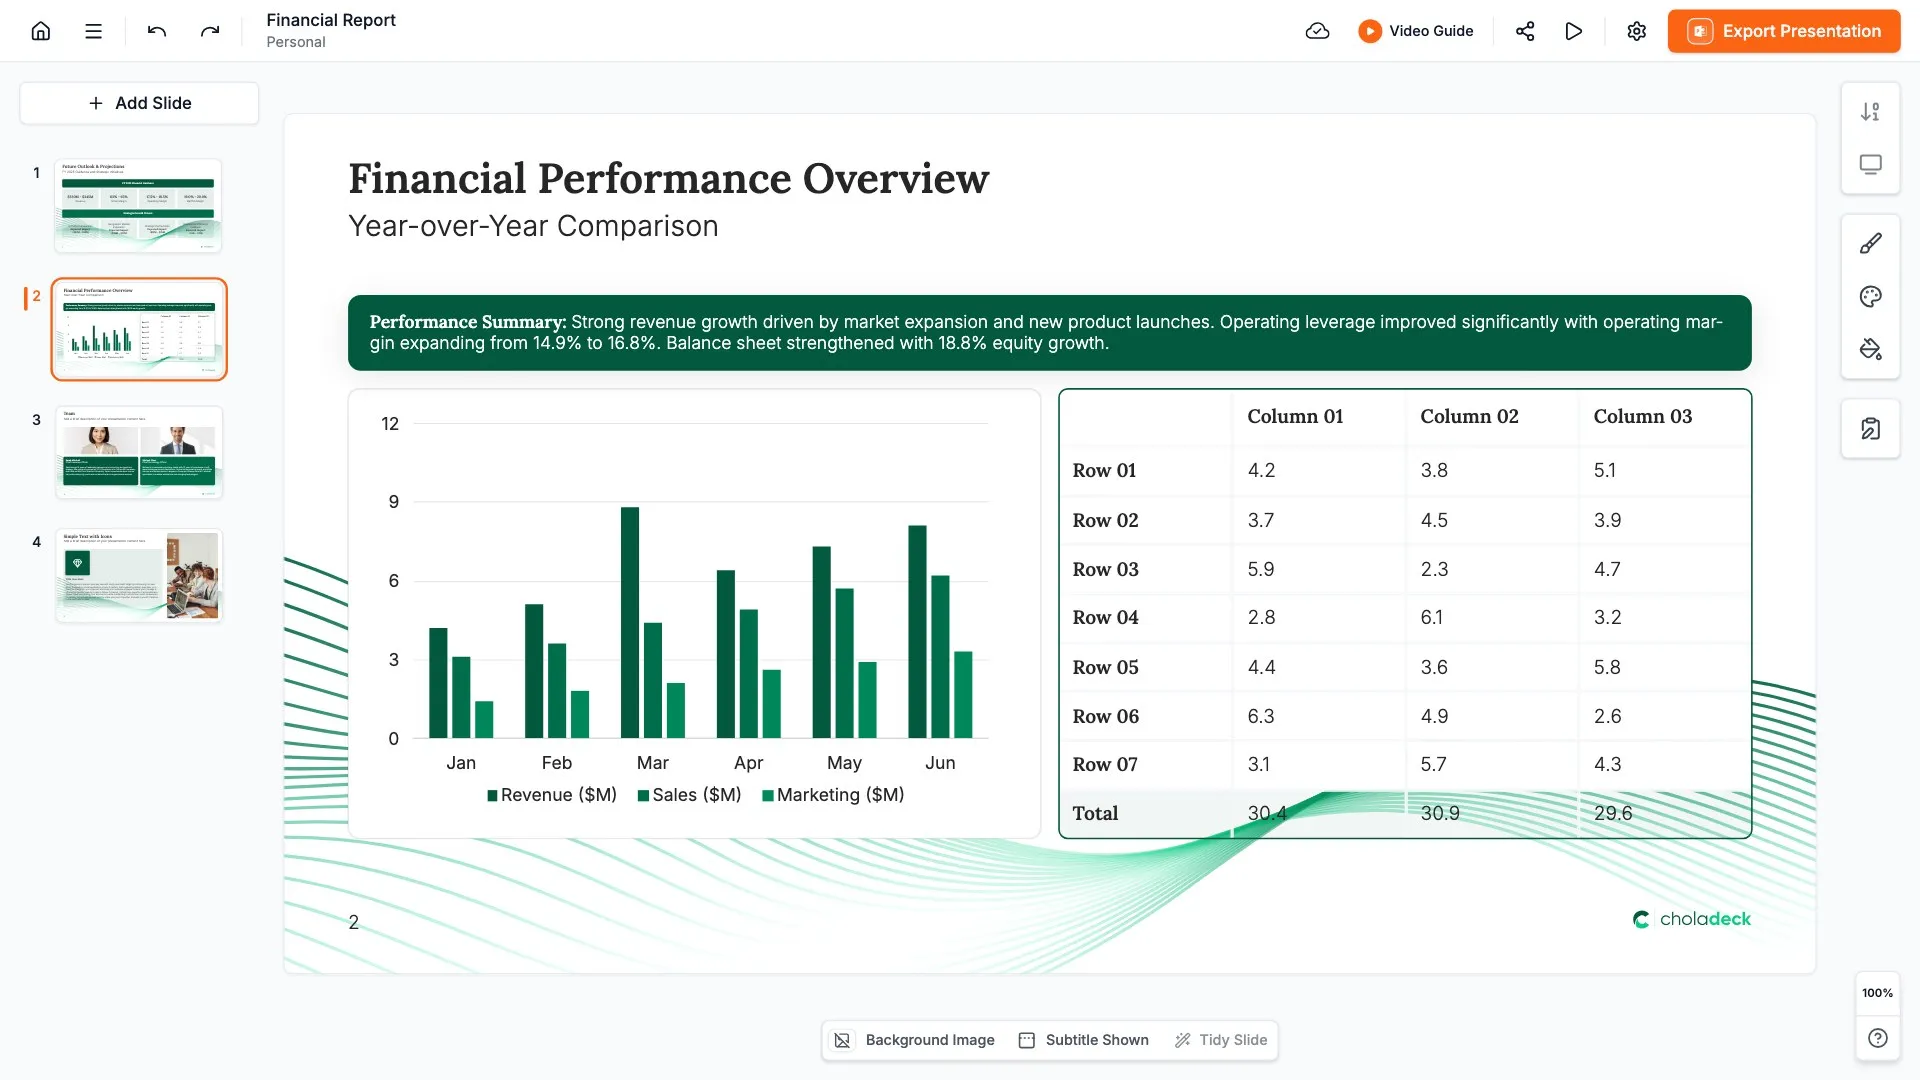
Professional charts and tables you can edit anywhere, anytime.
Turn your numbers into
professional charts and tables
Pick a chart, paste in your data, and export it to PowerPoint. It stays fully editable.
Free to start. No credit card required.